Hmong vs Immigrants from Bolivia Median Male Earnings
COMPARE
Hmong
Immigrants from Bolivia
Median Male Earnings
Median Male Earnings Comparison
Hmong
Immigrants from Bolivia
$48,254
MEDIAN MALE EARNINGS
0.2/ 100
METRIC RATING
279th/ 347
METRIC RANK
$60,088
MEDIAN MALE EARNINGS
99.6/ 100
METRIC RATING
75th/ 347
METRIC RANK
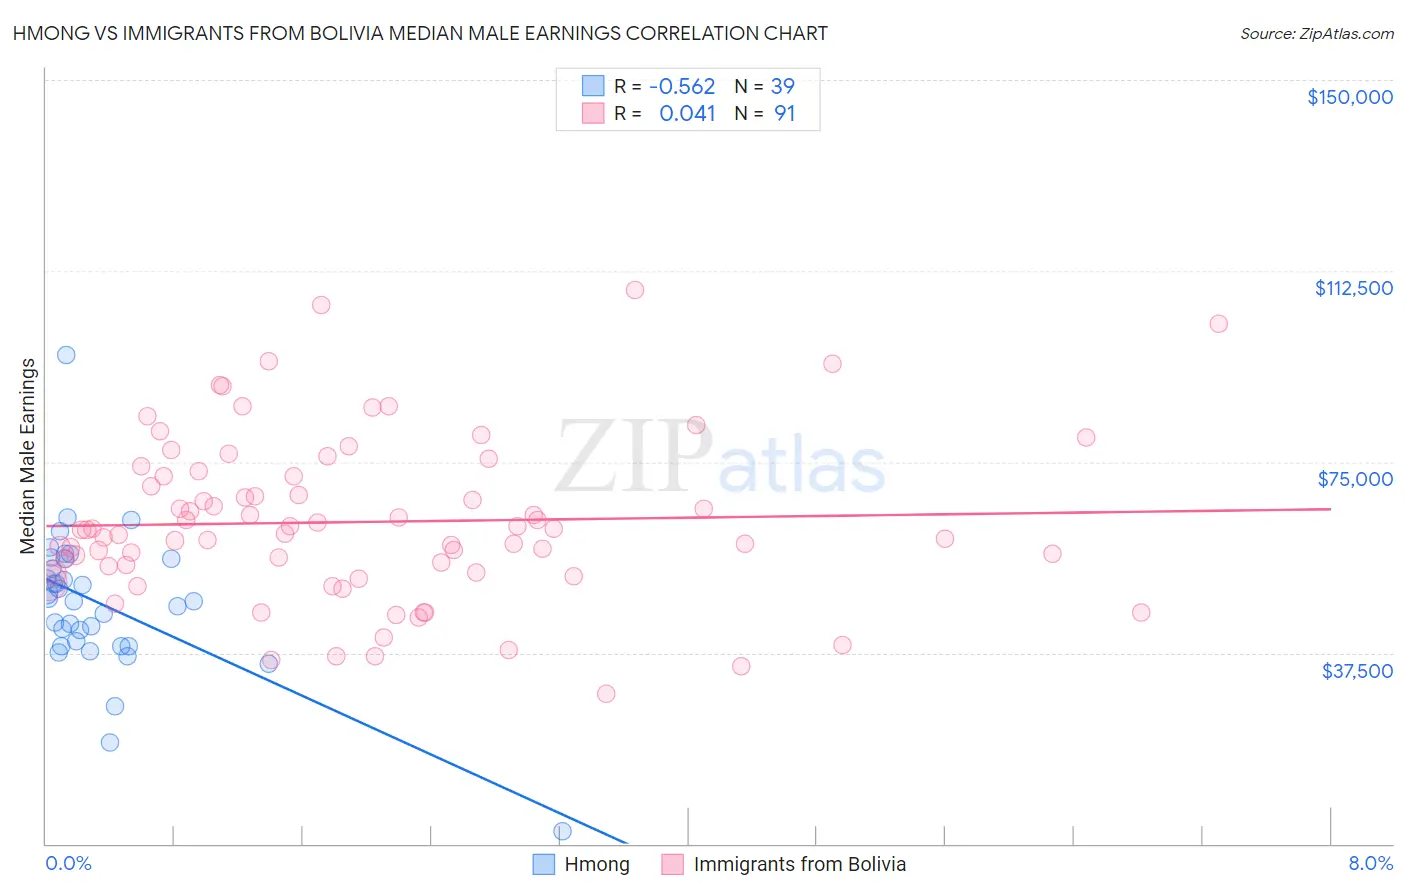
Hmong vs Immigrants from Bolivia Median Male Earnings Correlation Chart
The statistical analysis conducted on geographies consisting of 24,672,334 people shows a substantial negative correlation between the proportion of Hmong and median male earnings in the United States with a correlation coefficient (R) of -0.562 and weighted average of $48,254. Similarly, the statistical analysis conducted on geographies consisting of 158,704,796 people shows no correlation between the proportion of Immigrants from Bolivia and median male earnings in the United States with a correlation coefficient (R) of 0.041 and weighted average of $60,088, a difference of 24.5%.
Median Male Earnings Correlation Summary
| Measurement | Hmong | Immigrants from Bolivia |
| Minimum | $2,499 | $29,412 |
| Maximum | $95,990 | $108,819 |
| Range | $93,491 | $79,407 |
| Mean | $47,121 | $63,204 |
| Median | $47,633 | $61,601 |
| Interquartile 25% (IQ1) | $38,872 | $53,242 |
| Interquartile 75% (IQ3) | $55,920 | $72,136 |
| Interquartile Range (IQR) | $17,048 | $18,895 |
| Standard Deviation (Sample) | $14,307 | $16,071 |
| Standard Deviation (Population) | $14,122 | $15,982 |
Similar Demographics by Median Male Earnings
Demographics Similar to Hmong by Median Male Earnings
In terms of median male earnings, the demographic groups most similar to Hmong are Comanche ($48,202, a difference of 0.11%), Immigrants from Liberia ($48,317, a difference of 0.13%), Belizean ($48,358, a difference of 0.22%), Marshallese ($48,137, a difference of 0.24%), and Blackfeet ($48,402, a difference of 0.31%).
| Demographics | Rating | Rank | Median Male Earnings |
| Salvadorans | 0.3 /100 | #272 | Tragic $48,646 |
| Jamaicans | 0.3 /100 | #273 | Tragic $48,632 |
| Colville | 0.3 /100 | #274 | Tragic $48,516 |
| Immigrants | Somalia | 0.3 /100 | #275 | Tragic $48,439 |
| Blackfeet | 0.3 /100 | #276 | Tragic $48,402 |
| Belizeans | 0.2 /100 | #277 | Tragic $48,358 |
| Immigrants | Liberia | 0.2 /100 | #278 | Tragic $48,317 |
| Hmong | 0.2 /100 | #279 | Tragic $48,254 |
| Comanche | 0.2 /100 | #280 | Tragic $48,202 |
| Marshallese | 0.2 /100 | #281 | Tragic $48,137 |
| Central Americans | 0.2 /100 | #282 | Tragic $48,093 |
| Immigrants | Jamaica | 0.2 /100 | #283 | Tragic $48,040 |
| Africans | 0.2 /100 | #284 | Tragic $47,994 |
| Paiute | 0.2 /100 | #285 | Tragic $47,991 |
| Mexican American Indians | 0.2 /100 | #286 | Tragic $47,990 |
Demographics Similar to Immigrants from Bolivia by Median Male Earnings
In terms of median male earnings, the demographic groups most similar to Immigrants from Bolivia are Romanian ($60,063, a difference of 0.040%), Argentinean ($60,117, a difference of 0.050%), Paraguayan ($59,975, a difference of 0.19%), Immigrants from Egypt ($59,925, a difference of 0.27%), and Immigrants from North America ($60,265, a difference of 0.29%).
| Demographics | Rating | Rank | Median Male Earnings |
| Immigrants | Serbia | 99.7 /100 | #68 | Exceptional $60,600 |
| Immigrants | Canada | 99.7 /100 | #69 | Exceptional $60,388 |
| Immigrants | Bulgaria | 99.7 /100 | #70 | Exceptional $60,358 |
| Mongolians | 99.7 /100 | #71 | Exceptional $60,350 |
| Immigrants | Western Europe | 99.7 /100 | #72 | Exceptional $60,334 |
| Immigrants | North America | 99.7 /100 | #73 | Exceptional $60,265 |
| Argentineans | 99.6 /100 | #74 | Exceptional $60,117 |
| Immigrants | Bolivia | 99.6 /100 | #75 | Exceptional $60,088 |
| Romanians | 99.6 /100 | #76 | Exceptional $60,063 |
| Paraguayans | 99.5 /100 | #77 | Exceptional $59,975 |
| Immigrants | Egypt | 99.5 /100 | #78 | Exceptional $59,925 |
| Immigrants | Ukraine | 99.5 /100 | #79 | Exceptional $59,820 |
| Immigrants | Hungary | 99.5 /100 | #80 | Exceptional $59,806 |
| Ukrainians | 99.4 /100 | #81 | Exceptional $59,728 |
| Croatians | 99.4 /100 | #82 | Exceptional $59,715 |