Hmong vs Apache Median Male Earnings
COMPARE
Hmong
Apache
Median Male Earnings
Median Male Earnings Comparison
Hmong
Apache
$48,254
MEDIAN MALE EARNINGS
0.2/ 100
METRIC RATING
279th/ 347
METRIC RANK
$46,429
MEDIAN MALE EARNINGS
0.0/ 100
METRIC RATING
311th/ 347
METRIC RANK
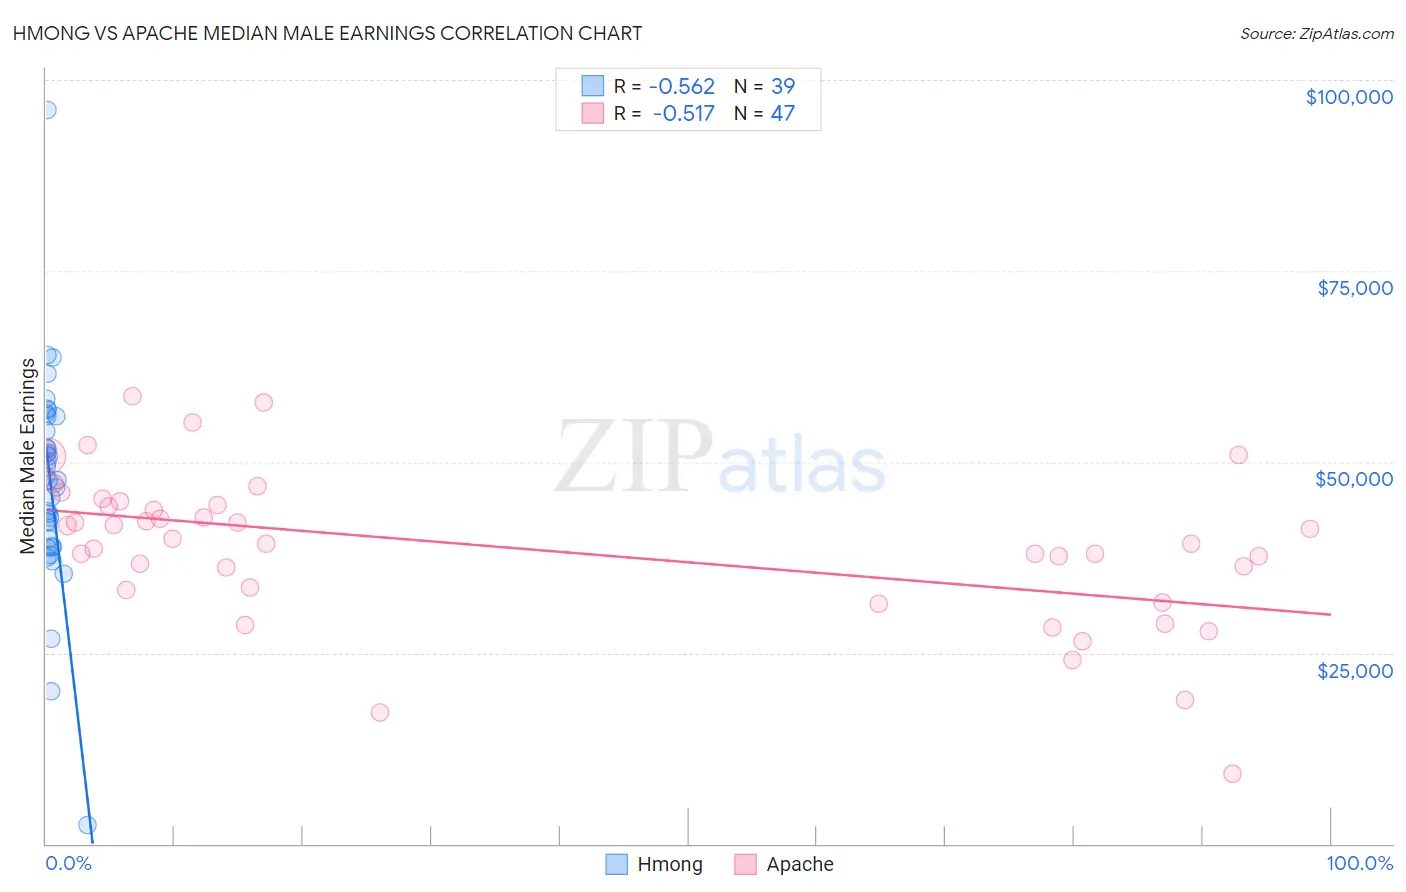
Hmong vs Apache Median Male Earnings Correlation Chart
The statistical analysis conducted on geographies consisting of 24,672,334 people shows a substantial negative correlation between the proportion of Hmong and median male earnings in the United States with a correlation coefficient (R) of -0.562 and weighted average of $48,254. Similarly, the statistical analysis conducted on geographies consisting of 231,058,501 people shows a substantial negative correlation between the proportion of Apache and median male earnings in the United States with a correlation coefficient (R) of -0.517 and weighted average of $46,429, a difference of 3.9%.
Median Male Earnings Correlation Summary
| Measurement | Hmong | Apache |
| Minimum | $2,499 | $9,161 |
| Maximum | $95,990 | $58,566 |
| Range | $93,491 | $49,405 |
| Mean | $47,121 | $38,686 |
| Median | $47,633 | $39,318 |
| Interquartile 25% (IQ1) | $38,872 | $33,190 |
| Interquartile 75% (IQ3) | $55,920 | $44,375 |
| Interquartile Range (IQR) | $17,048 | $11,185 |
| Standard Deviation (Sample) | $14,307 | $10,062 |
| Standard Deviation (Population) | $14,122 | $9,955 |
Similar Demographics by Median Male Earnings
Demographics Similar to Hmong by Median Male Earnings
In terms of median male earnings, the demographic groups most similar to Hmong are Comanche ($48,202, a difference of 0.11%), Immigrants from Liberia ($48,317, a difference of 0.13%), Belizean ($48,358, a difference of 0.22%), Marshallese ($48,137, a difference of 0.24%), and Blackfeet ($48,402, a difference of 0.31%).
| Demographics | Rating | Rank | Median Male Earnings |
| Salvadorans | 0.3 /100 | #272 | Tragic $48,646 |
| Jamaicans | 0.3 /100 | #273 | Tragic $48,632 |
| Colville | 0.3 /100 | #274 | Tragic $48,516 |
| Immigrants | Somalia | 0.3 /100 | #275 | Tragic $48,439 |
| Blackfeet | 0.3 /100 | #276 | Tragic $48,402 |
| Belizeans | 0.2 /100 | #277 | Tragic $48,358 |
| Immigrants | Liberia | 0.2 /100 | #278 | Tragic $48,317 |
| Hmong | 0.2 /100 | #279 | Tragic $48,254 |
| Comanche | 0.2 /100 | #280 | Tragic $48,202 |
| Marshallese | 0.2 /100 | #281 | Tragic $48,137 |
| Central Americans | 0.2 /100 | #282 | Tragic $48,093 |
| Immigrants | Jamaica | 0.2 /100 | #283 | Tragic $48,040 |
| Africans | 0.2 /100 | #284 | Tragic $47,994 |
| Paiute | 0.2 /100 | #285 | Tragic $47,991 |
| Mexican American Indians | 0.2 /100 | #286 | Tragic $47,990 |
Demographics Similar to Apache by Median Male Earnings
In terms of median male earnings, the demographic groups most similar to Apache are Hispanic or Latino ($46,419, a difference of 0.020%), Honduran ($46,374, a difference of 0.12%), Chippewa ($46,368, a difference of 0.13%), Cuban ($46,580, a difference of 0.33%), and Creek ($46,594, a difference of 0.36%).
| Demographics | Rating | Rank | Median Male Earnings |
| Bangladeshis | 0.1 /100 | #304 | Tragic $46,744 |
| Guatemalans | 0.0 /100 | #305 | Tragic $46,736 |
| Dutch West Indians | 0.0 /100 | #306 | Tragic $46,656 |
| Immigrants | Dominican Republic | 0.0 /100 | #307 | Tragic $46,655 |
| Ottawa | 0.0 /100 | #308 | Tragic $46,611 |
| Creek | 0.0 /100 | #309 | Tragic $46,594 |
| Cubans | 0.0 /100 | #310 | Tragic $46,580 |
| Apache | 0.0 /100 | #311 | Tragic $46,429 |
| Hispanics or Latinos | 0.0 /100 | #312 | Tragic $46,419 |
| Hondurans | 0.0 /100 | #313 | Tragic $46,374 |
| Chippewa | 0.0 /100 | #314 | Tragic $46,368 |
| Immigrants | Guatemala | 0.0 /100 | #315 | Tragic $46,244 |
| Immigrants | Caribbean | 0.0 /100 | #316 | Tragic $46,193 |
| Mexicans | 0.0 /100 | #317 | Tragic $46,147 |
| Cheyenne | 0.0 /100 | #318 | Tragic $46,062 |