Guyanese vs Armenian Wage/Income Gap
COMPARE
Guyanese
Armenian
Wage/Income Gap
Wage/Income Gap Comparison
Guyanese
Armenians
18.3%
WAGE/INCOME GAP
100.0/ 100
METRIC RATING
5th/ 347
METRIC RANK
24.8%
WAGE/INCOME GAP
91.3/ 100
METRIC RATING
136th/ 347
METRIC RANK
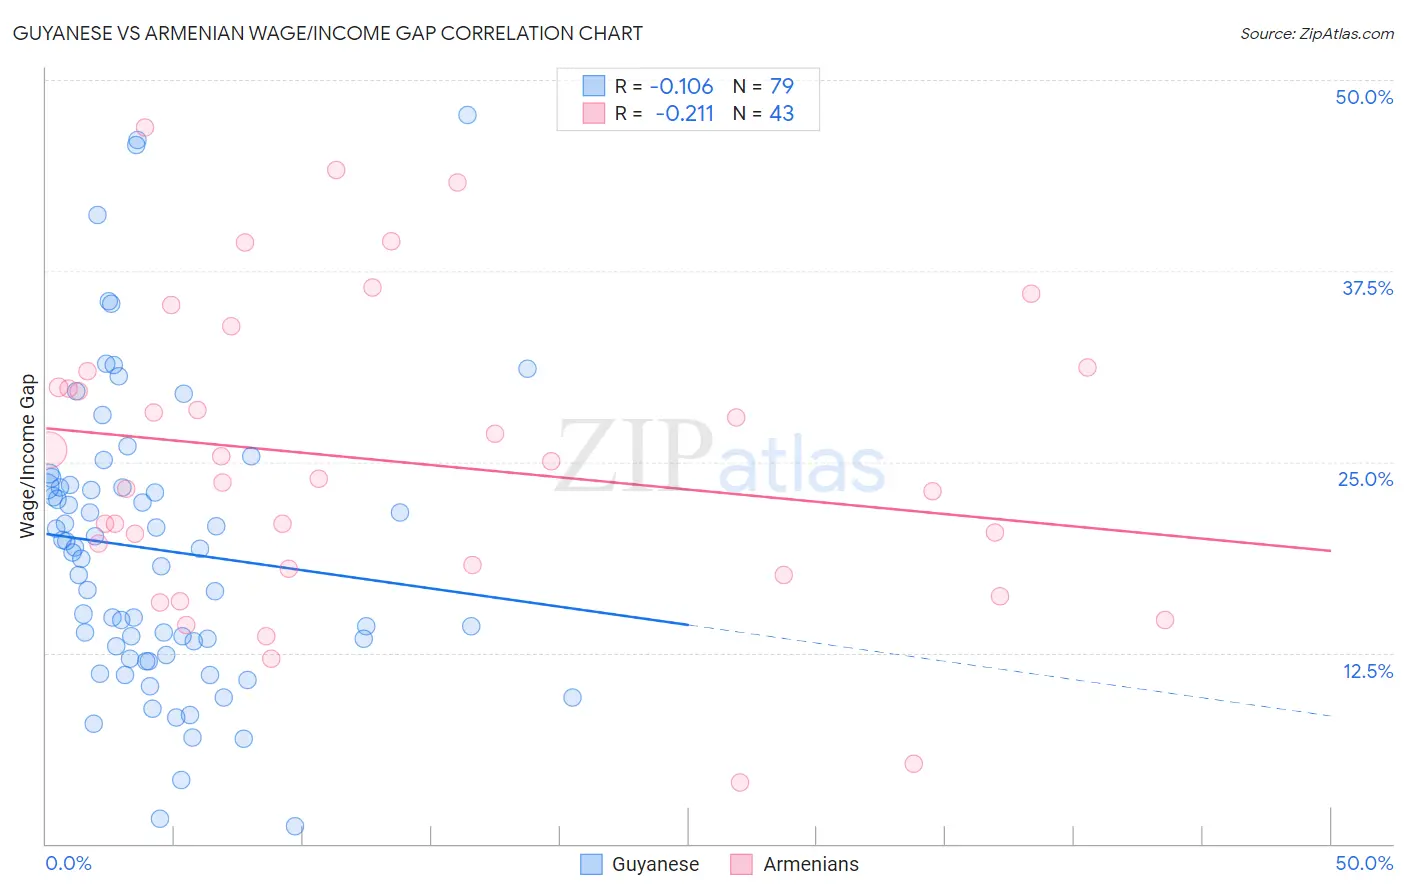
Guyanese vs Armenian Wage/Income Gap Correlation Chart
The statistical analysis conducted on geographies consisting of 176,905,997 people shows a poor negative correlation between the proportion of Guyanese and wage/income gap percentage in the United States with a correlation coefficient (R) of -0.106 and weighted average of 18.3%. Similarly, the statistical analysis conducted on geographies consisting of 310,772,070 people shows a weak negative correlation between the proportion of Armenians and wage/income gap percentage in the United States with a correlation coefficient (R) of -0.211 and weighted average of 24.8%, a difference of 35.4%.
Wage/Income Gap Correlation Summary
| Measurement | Guyanese | Armenian |
| Minimum | 1.1% | 4.0% |
| Maximum | 47.7% | 46.9% |
| Range | 46.5% | 42.9% |
| Mean | 19.2% | 25.0% |
| Median | 19.1% | 23.9% |
| Interquartile 25% (IQ1) | 12.4% | 18.0% |
| Interquartile 75% (IQ3) | 23.4% | 30.9% |
| Interquartile Range (IQR) | 11.0% | 12.9% |
| Standard Deviation (Sample) | 9.6% | 9.9% |
| Standard Deviation (Population) | 9.6% | 9.7% |
Similar Demographics by Wage/Income Gap
Demographics Similar to Guyanese by Wage/Income Gap
In terms of wage/income gap, the demographic groups most similar to Guyanese are Immigrants from Guyana (18.4%, a difference of 0.26%), British West Indian (18.0%, a difference of 1.6%), Puerto Rican (18.7%, a difference of 2.3%), Immigrants from Barbados (17.8%, a difference of 2.6%), and Immigrants from Jamaica (18.8%, a difference of 2.9%).
| Demographics | Rating | Rank | Wage/Income Gap |
| Immigrants | Grenada | 100.0 /100 | #1 | Exceptional 16.2% |
| Immigrants | St. Vincent and the Grenadines | 100.0 /100 | #2 | Exceptional 16.4% |
| Immigrants | Barbados | 100.0 /100 | #3 | Exceptional 17.8% |
| British West Indians | 100.0 /100 | #4 | Exceptional 18.0% |
| Guyanese | 100.0 /100 | #5 | Exceptional 18.3% |
| Immigrants | Guyana | 100.0 /100 | #6 | Exceptional 18.4% |
| Puerto Ricans | 100.0 /100 | #7 | Exceptional 18.7% |
| Immigrants | Jamaica | 100.0 /100 | #8 | Exceptional 18.8% |
| Barbadians | 100.0 /100 | #9 | Exceptional 19.0% |
| Crow | 100.0 /100 | #10 | Exceptional 19.1% |
| Immigrants | Haiti | 100.0 /100 | #11 | Exceptional 19.2% |
| Immigrants | West Indies | 100.0 /100 | #12 | Exceptional 19.2% |
| Trinidadians and Tobagonians | 100.0 /100 | #13 | Exceptional 19.3% |
| Immigrants | Trinidad and Tobago | 100.0 /100 | #14 | Exceptional 19.3% |
| West Indians | 100.0 /100 | #15 | Exceptional 19.6% |
Demographics Similar to Armenians by Wage/Income Gap
In terms of wage/income gap, the demographic groups most similar to Armenians are Immigrants from South Eastern Asia (24.8%, a difference of 0.080%), South American Indian (24.7%, a difference of 0.14%), Mexican American Indian (24.7%, a difference of 0.20%), Immigrants from Costa Rica (24.7%, a difference of 0.24%), and Colombian (24.7%, a difference of 0.24%).
| Demographics | Rating | Rank | Wage/Income Gap |
| Yup'ik | 93.3 /100 | #129 | Exceptional 24.7% |
| Alsatians | 93.2 /100 | #130 | Exceptional 24.7% |
| Immigrants | Philippines | 93.0 /100 | #131 | Exceptional 24.7% |
| Immigrants | Costa Rica | 92.4 /100 | #132 | Exceptional 24.7% |
| Colombians | 92.4 /100 | #133 | Exceptional 24.7% |
| Mexican American Indians | 92.2 /100 | #134 | Exceptional 24.7% |
| South American Indians | 92.0 /100 | #135 | Exceptional 24.7% |
| Armenians | 91.3 /100 | #136 | Exceptional 24.8% |
| Immigrants | South Eastern Asia | 90.9 /100 | #137 | Exceptional 24.8% |
| Immigrants | Bosnia and Herzegovina | 90.1 /100 | #138 | Exceptional 24.8% |
| Hispanics or Latinos | 89.5 /100 | #139 | Excellent 24.9% |
| Immigrants | Nepal | 89.3 /100 | #140 | Excellent 24.9% |
| Hawaiians | 89.3 /100 | #141 | Excellent 24.9% |
| Afghans | 88.1 /100 | #142 | Excellent 24.9% |
| Immigrants | Uganda | 88.0 /100 | #143 | Excellent 24.9% |