Guamanian/Chamorro vs Immigrants from Switzerland Wage/Income Gap
COMPARE
Guamanian/Chamorro
Immigrants from Switzerland
Wage/Income Gap
Wage/Income Gap Comparison
Guamanians/Chamorros
Immigrants from Switzerland
26.0%
WAGE/INCOME GAP
38.0/ 100
METRIC RATING
180th/ 347
METRIC RANK
27.7%
WAGE/INCOME GAP
1.0/ 100
METRIC RATING
264th/ 347
METRIC RANK
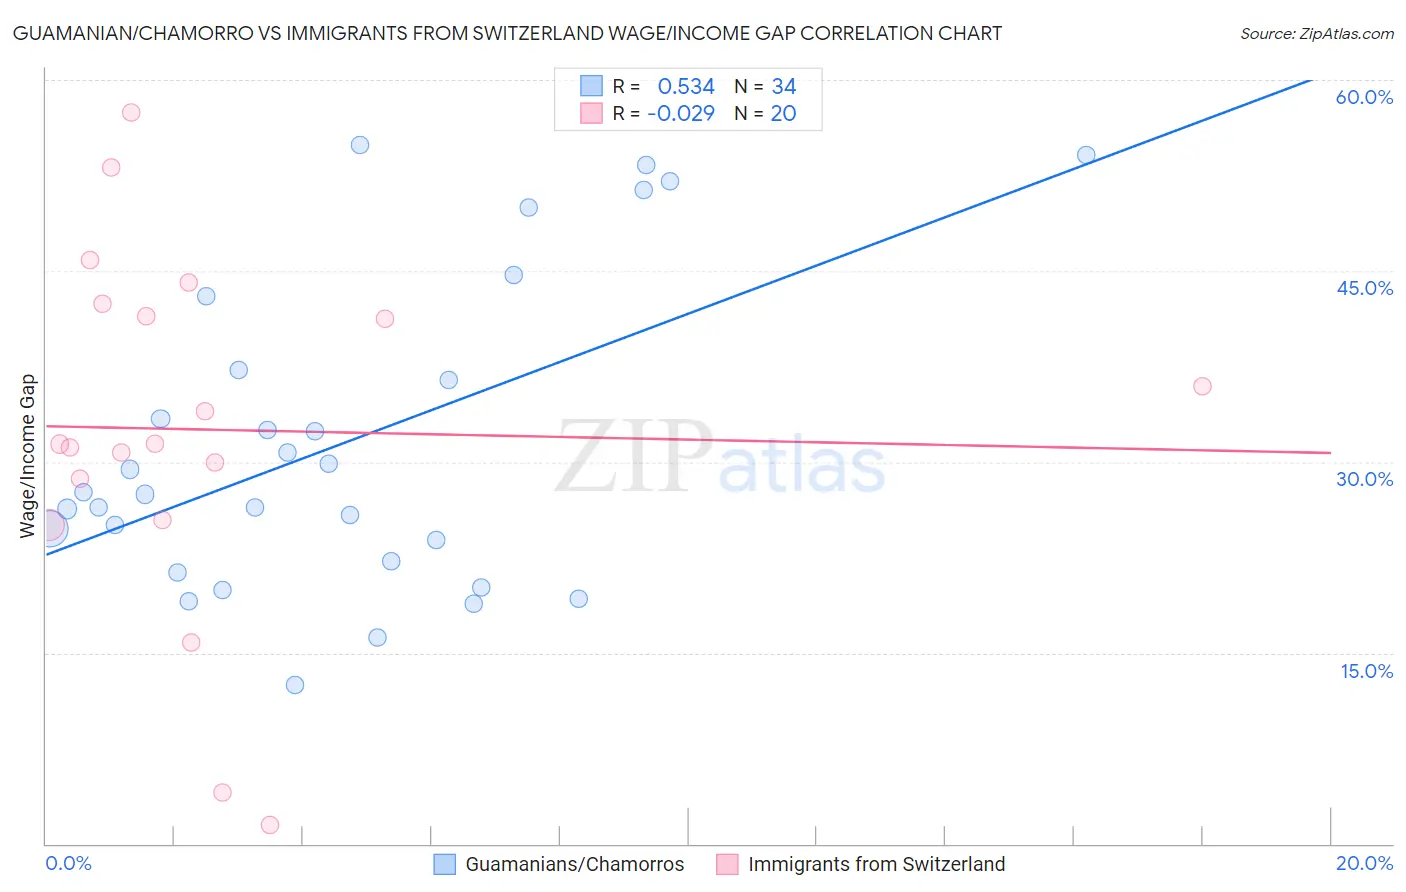
Guamanian/Chamorro vs Immigrants from Switzerland Wage/Income Gap Correlation Chart
The statistical analysis conducted on geographies consisting of 221,896,137 people shows a substantial positive correlation between the proportion of Guamanians/Chamorros and wage/income gap percentage in the United States with a correlation coefficient (R) of 0.534 and weighted average of 26.0%. Similarly, the statistical analysis conducted on geographies consisting of 148,012,868 people shows no correlation between the proportion of Immigrants from Switzerland and wage/income gap percentage in the United States with a correlation coefficient (R) of -0.029 and weighted average of 27.7%, a difference of 6.6%.
Wage/Income Gap Correlation Summary
| Measurement | Guamanian/Chamorro | Immigrants from Switzerland |
| Minimum | 12.5% | 1.5% |
| Maximum | 54.9% | 57.5% |
| Range | 42.4% | 56.0% |
| Mean | 31.4% | 32.5% |
| Median | 27.5% | 31.4% |
| Interquartile 25% (IQ1) | 22.2% | 27.1% |
| Interquartile 75% (IQ3) | 37.2% | 42.0% |
| Interquartile Range (IQR) | 15.1% | 14.9% |
| Standard Deviation (Sample) | 12.1% | 14.2% |
| Standard Deviation (Population) | 12.0% | 13.8% |
Similar Demographics by Wage/Income Gap
Demographics Similar to Guamanians/Chamorros by Wage/Income Gap
In terms of wage/income gap, the demographic groups most similar to Guamanians/Chamorros are Samoan (26.0%, a difference of 0.040%), Immigrants from Bolivia (26.0%, a difference of 0.11%), Immigrants from Serbia (26.0%, a difference of 0.19%), Immigrants from Kazakhstan (26.0%, a difference of 0.20%), and Mexican (26.0%, a difference of 0.26%).
| Demographics | Rating | Rank | Wage/Income Gap |
| Immigrants | Belarus | 52.9 /100 | #173 | Average 25.7% |
| Alaskan Athabascans | 50.0 /100 | #174 | Average 25.8% |
| Sri Lankans | 47.0 /100 | #175 | Average 25.8% |
| Paraguayans | 46.7 /100 | #176 | Average 25.8% |
| Cambodians | 45.1 /100 | #177 | Average 25.8% |
| Chinese | 42.0 /100 | #178 | Average 25.9% |
| Samoans | 38.6 /100 | #179 | Fair 26.0% |
| Guamanians/Chamorros | 38.0 /100 | #180 | Fair 26.0% |
| Immigrants | Bolivia | 36.4 /100 | #181 | Fair 26.0% |
| Immigrants | Serbia | 35.4 /100 | #182 | Fair 26.0% |
| Immigrants | Kazakhstan | 35.2 /100 | #183 | Fair 26.0% |
| Mexicans | 34.4 /100 | #184 | Fair 26.0% |
| Pakistanis | 33.7 /100 | #185 | Fair 26.1% |
| Immigrants | Indonesia | 32.5 /100 | #186 | Fair 26.1% |
| Palestinians | 29.9 /100 | #187 | Fair 26.1% |
Demographics Similar to Immigrants from Switzerland by Wage/Income Gap
In terms of wage/income gap, the demographic groups most similar to Immigrants from Switzerland are Serbian (27.7%, a difference of 0.0%), Hmong (27.7%, a difference of 0.010%), Turkish (27.7%, a difference of 0.020%), New Zealander (27.7%, a difference of 0.10%), and Potawatomi (27.7%, a difference of 0.12%).
| Demographics | Rating | Rank | Wage/Income Gap |
| Luxembourgers | 1.9 /100 | #257 | Tragic 27.4% |
| Slavs | 1.8 /100 | #258 | Tragic 27.4% |
| Icelanders | 1.8 /100 | #259 | Tragic 27.5% |
| Tongans | 1.7 /100 | #260 | Tragic 27.5% |
| Immigrants | Germany | 1.5 /100 | #261 | Tragic 27.5% |
| Immigrants | Lebanon | 1.5 /100 | #262 | Tragic 27.5% |
| Syrians | 1.4 /100 | #263 | Tragic 27.6% |
| Immigrants | Switzerland | 1.0 /100 | #264 | Tragic 27.7% |
| Serbians | 1.0 /100 | #265 | Tragic 27.7% |
| Hmong | 1.0 /100 | #266 | Tragic 27.7% |
| Turks | 1.0 /100 | #267 | Tragic 27.7% |
| New Zealanders | 1.0 /100 | #268 | Tragic 27.7% |
| Potawatomi | 0.9 /100 | #269 | Tragic 27.7% |
| Immigrants | Western Europe | 0.9 /100 | #270 | Tragic 27.8% |
| Ute | 0.8 /100 | #271 | Tragic 27.8% |