Greek vs Immigrants from Hungary Per Capita Income
COMPARE
Greek
Immigrants from Hungary
Per Capita Income
Per Capita Income Comparison
Greeks
Immigrants from Hungary
$49,309
PER CAPITA INCOME
99.8/ 100
METRIC RATING
71st/ 347
METRIC RANK
$49,303
PER CAPITA INCOME
99.8/ 100
METRIC RATING
72nd/ 347
METRIC RANK
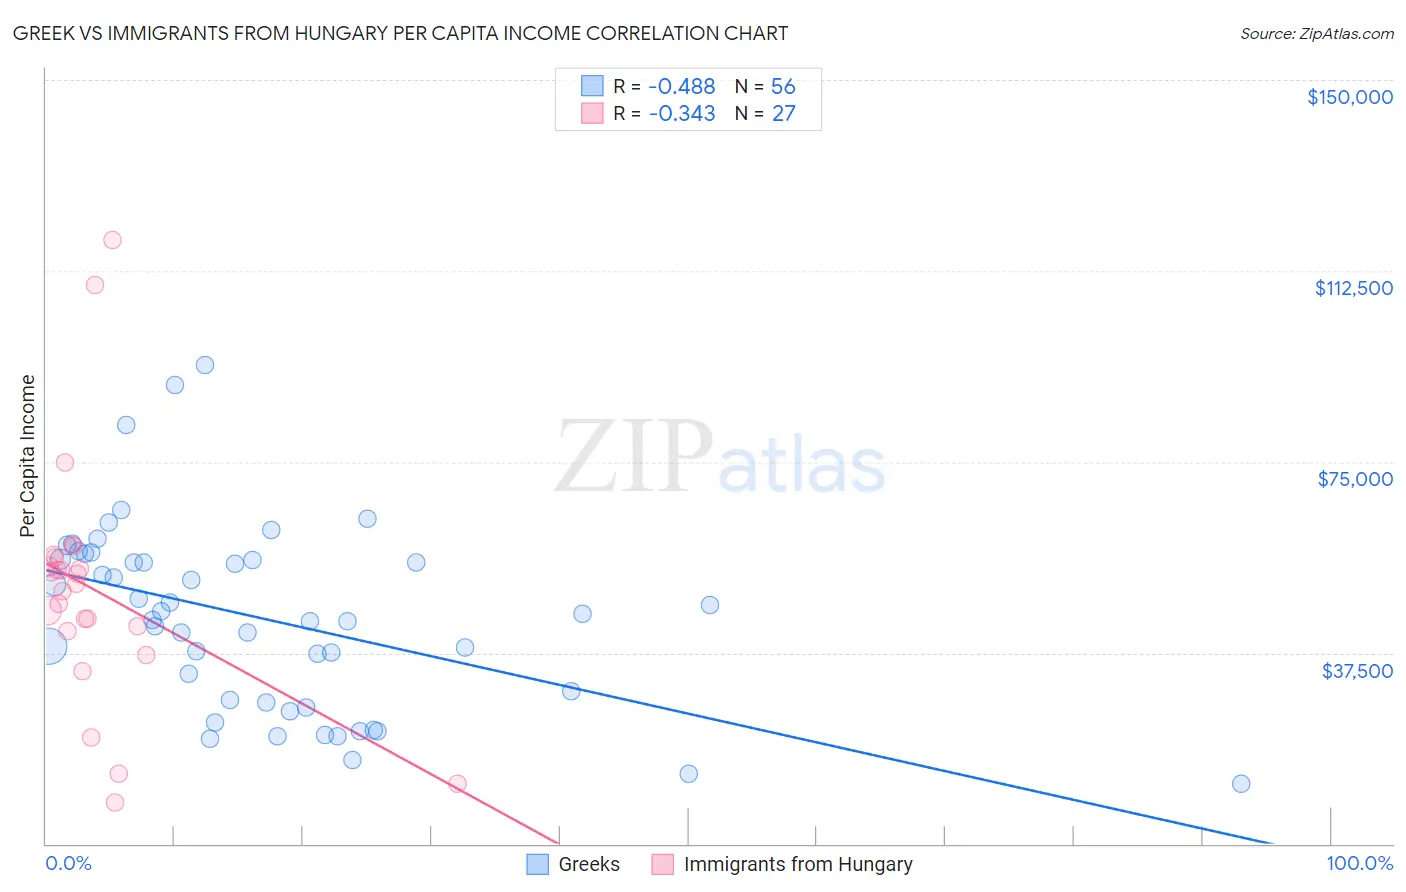
Greek vs Immigrants from Hungary Per Capita Income Correlation Chart
The statistical analysis conducted on geographies consisting of 482,808,471 people shows a moderate negative correlation between the proportion of Greeks and per capita income in the United States with a correlation coefficient (R) of -0.488 and weighted average of $49,309. Similarly, the statistical analysis conducted on geographies consisting of 195,712,632 people shows a mild negative correlation between the proportion of Immigrants from Hungary and per capita income in the United States with a correlation coefficient (R) of -0.343 and weighted average of $49,303, a difference of 0.010%.
Per Capita Income Correlation Summary
| Measurement | Greek | Immigrants from Hungary |
| Minimum | $11,668 | $8,083 |
| Maximum | $93,958 | $118,659 |
| Range | $82,290 | $110,576 |
| Mean | $44,253 | $49,900 |
| Median | $44,552 | $51,036 |
| Interquartile 25% (IQ1) | $28,035 | $41,686 |
| Interquartile 75% (IQ3) | $55,859 | $56,245 |
| Interquartile Range (IQR) | $27,823 | $14,559 |
| Standard Deviation (Sample) | $18,189 | $24,211 |
| Standard Deviation (Population) | $18,026 | $23,759 |
Demographics Similar to Greeks and Immigrants from Hungary by Per Capita Income
In terms of per capita income, the demographic groups most similar to Greeks are Immigrants from Eastern Europe ($49,316, a difference of 0.010%), Immigrants from North America ($49,302, a difference of 0.010%), Immigrants from Canada ($49,412, a difference of 0.21%), Lithuanian ($49,448, a difference of 0.28%), and Mongolian ($49,173, a difference of 0.28%). Similarly, the demographic groups most similar to Immigrants from Hungary are Immigrants from North America ($49,302, a difference of 0.0%), Immigrants from Eastern Europe ($49,316, a difference of 0.030%), Immigrants from Canada ($49,412, a difference of 0.22%), Mongolian ($49,173, a difference of 0.26%), and Lithuanian ($49,448, a difference of 0.29%).
| Demographics | Rating | Rank | Per Capita Income |
| Argentineans | 99.9 /100 | #61 | Exceptional $49,862 |
| Immigrants | Asia | 99.9 /100 | #62 | Exceptional $49,741 |
| Maltese | 99.9 /100 | #63 | Exceptional $49,640 |
| Immigrants | Argentina | 99.9 /100 | #64 | Exceptional $49,627 |
| Bolivians | 99.9 /100 | #65 | Exceptional $49,526 |
| Immigrants | Bulgaria | 99.9 /100 | #66 | Exceptional $49,482 |
| Immigrants | Romania | 99.9 /100 | #67 | Exceptional $49,463 |
| Lithuanians | 99.8 /100 | #68 | Exceptional $49,448 |
| Immigrants | Canada | 99.8 /100 | #69 | Exceptional $49,412 |
| Immigrants | Eastern Europe | 99.8 /100 | #70 | Exceptional $49,316 |
| Greeks | 99.8 /100 | #71 | Exceptional $49,309 |
| Immigrants | Hungary | 99.8 /100 | #72 | Exceptional $49,303 |
| Immigrants | North America | 99.8 /100 | #73 | Exceptional $49,302 |
| Mongolians | 99.8 /100 | #74 | Exceptional $49,173 |
| Immigrants | Bolivia | 99.7 /100 | #75 | Exceptional $48,970 |
| Immigrants | England | 99.7 /100 | #76 | Exceptional $48,844 |
| Immigrants | Kazakhstan | 99.7 /100 | #77 | Exceptional $48,747 |
| Immigrants | Italy | 99.6 /100 | #78 | Exceptional $48,654 |
| Romanians | 99.5 /100 | #79 | Exceptional $48,445 |
| Egyptians | 99.5 /100 | #80 | Exceptional $48,358 |
| Armenians | 99.4 /100 | #81 | Exceptional $48,287 |