Greek vs Bhutanese Per Capita Income
COMPARE
Greek
Bhutanese
Per Capita Income
Per Capita Income Comparison
Greeks
Bhutanese
$49,309
PER CAPITA INCOME
99.8/ 100
METRIC RATING
71st/ 347
METRIC RANK
$49,894
PER CAPITA INCOME
99.9/ 100
METRIC RATING
59th/ 347
METRIC RANK
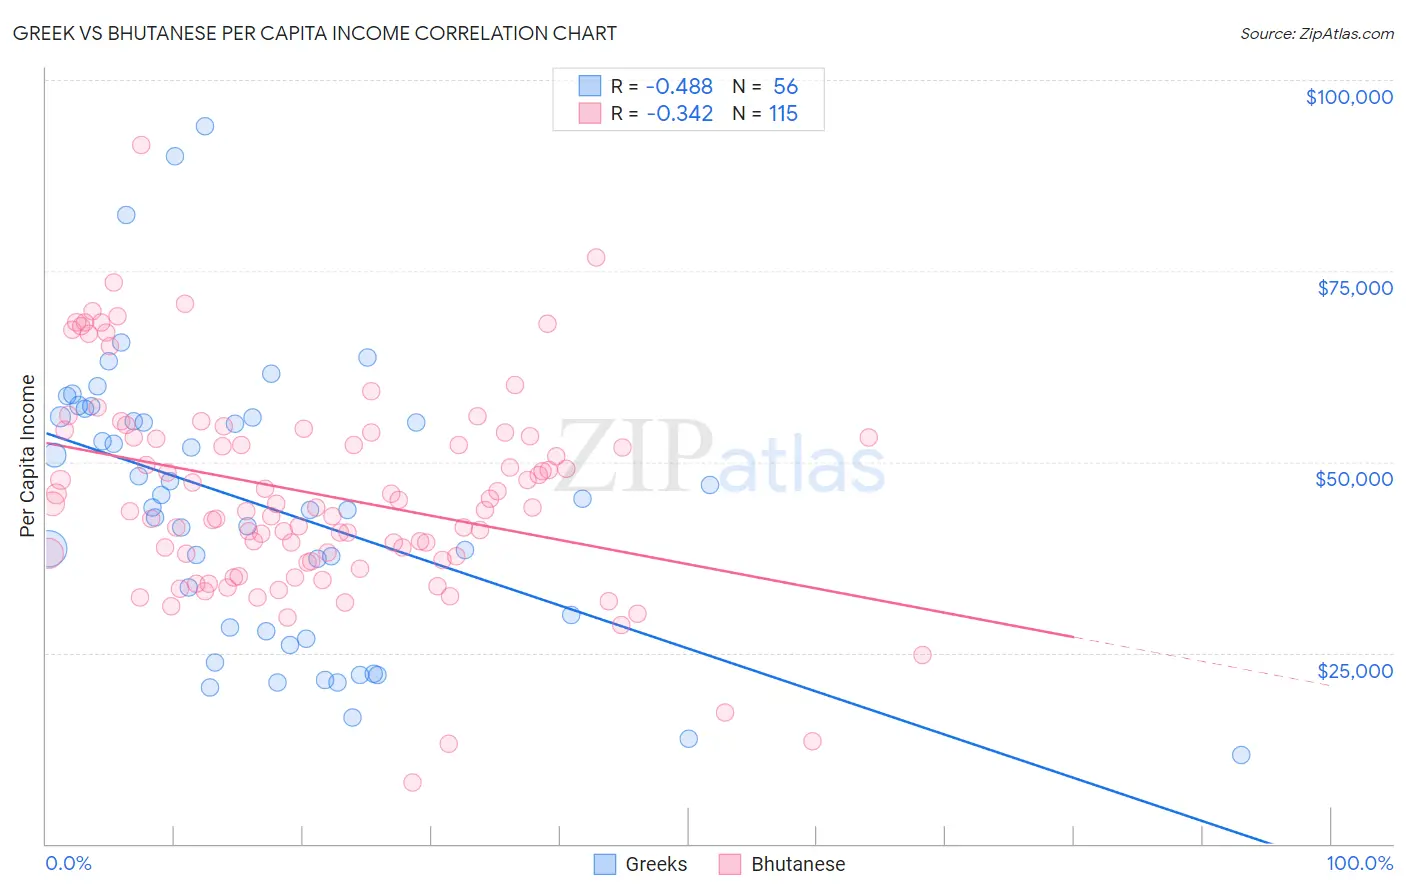
Greek vs Bhutanese Per Capita Income Correlation Chart
The statistical analysis conducted on geographies consisting of 482,808,471 people shows a moderate negative correlation between the proportion of Greeks and per capita income in the United States with a correlation coefficient (R) of -0.488 and weighted average of $49,309. Similarly, the statistical analysis conducted on geographies consisting of 455,599,247 people shows a mild negative correlation between the proportion of Bhutanese and per capita income in the United States with a correlation coefficient (R) of -0.342 and weighted average of $49,894, a difference of 1.2%.
Per Capita Income Correlation Summary
| Measurement | Greek | Bhutanese |
| Minimum | $11,668 | $8,097 |
| Maximum | $93,958 | $91,569 |
| Range | $82,290 | $83,472 |
| Mean | $44,253 | $45,753 |
| Median | $44,552 | $44,077 |
| Interquartile 25% (IQ1) | $28,035 | $37,217 |
| Interquartile 75% (IQ3) | $55,859 | $53,334 |
| Interquartile Range (IQR) | $27,823 | $16,117 |
| Standard Deviation (Sample) | $18,189 | $13,593 |
| Standard Deviation (Population) | $18,026 | $13,533 |
Demographics Similar to Greeks and Bhutanese by Per Capita Income
In terms of per capita income, the demographic groups most similar to Greeks are Immigrants from Eastern Europe ($49,316, a difference of 0.010%), Immigrants from Hungary ($49,303, a difference of 0.010%), Immigrants from North America ($49,302, a difference of 0.010%), Immigrants from Canada ($49,412, a difference of 0.21%), and Lithuanian ($49,448, a difference of 0.28%). Similarly, the demographic groups most similar to Bhutanese are Immigrants from Scotland ($49,893, a difference of 0.0%), Argentinean ($49,862, a difference of 0.070%), Immigrants from Malaysia ($49,983, a difference of 0.18%), South African ($50,044, a difference of 0.30%), and Immigrants from Asia ($49,741, a difference of 0.31%).
| Demographics | Rating | Rank | Per Capita Income |
| Immigrants | Western Europe | 99.9 /100 | #55 | Exceptional $50,065 |
| Asians | 99.9 /100 | #56 | Exceptional $50,057 |
| South Africans | 99.9 /100 | #57 | Exceptional $50,044 |
| Immigrants | Malaysia | 99.9 /100 | #58 | Exceptional $49,983 |
| Bhutanese | 99.9 /100 | #59 | Exceptional $49,894 |
| Immigrants | Scotland | 99.9 /100 | #60 | Exceptional $49,893 |
| Argentineans | 99.9 /100 | #61 | Exceptional $49,862 |
| Immigrants | Asia | 99.9 /100 | #62 | Exceptional $49,741 |
| Maltese | 99.9 /100 | #63 | Exceptional $49,640 |
| Immigrants | Argentina | 99.9 /100 | #64 | Exceptional $49,627 |
| Bolivians | 99.9 /100 | #65 | Exceptional $49,526 |
| Immigrants | Bulgaria | 99.9 /100 | #66 | Exceptional $49,482 |
| Immigrants | Romania | 99.9 /100 | #67 | Exceptional $49,463 |
| Lithuanians | 99.8 /100 | #68 | Exceptional $49,448 |
| Immigrants | Canada | 99.8 /100 | #69 | Exceptional $49,412 |
| Immigrants | Eastern Europe | 99.8 /100 | #70 | Exceptional $49,316 |
| Greeks | 99.8 /100 | #71 | Exceptional $49,309 |
| Immigrants | Hungary | 99.8 /100 | #72 | Exceptional $49,303 |
| Immigrants | North America | 99.8 /100 | #73 | Exceptional $49,302 |
| Mongolians | 99.8 /100 | #74 | Exceptional $49,173 |
| Immigrants | Bolivia | 99.7 /100 | #75 | Exceptional $48,970 |