German vs Immigrants from Switzerland Per Capita Income
COMPARE
German
Immigrants from Switzerland
Per Capita Income
Per Capita Income Comparison
Germans
Immigrants from Switzerland
$43,067
PER CAPITA INCOME
33.9/ 100
METRIC RATING
183rd/ 347
METRIC RANK
$54,866
PER CAPITA INCOME
100.0/ 100
METRIC RATING
16th/ 347
METRIC RANK
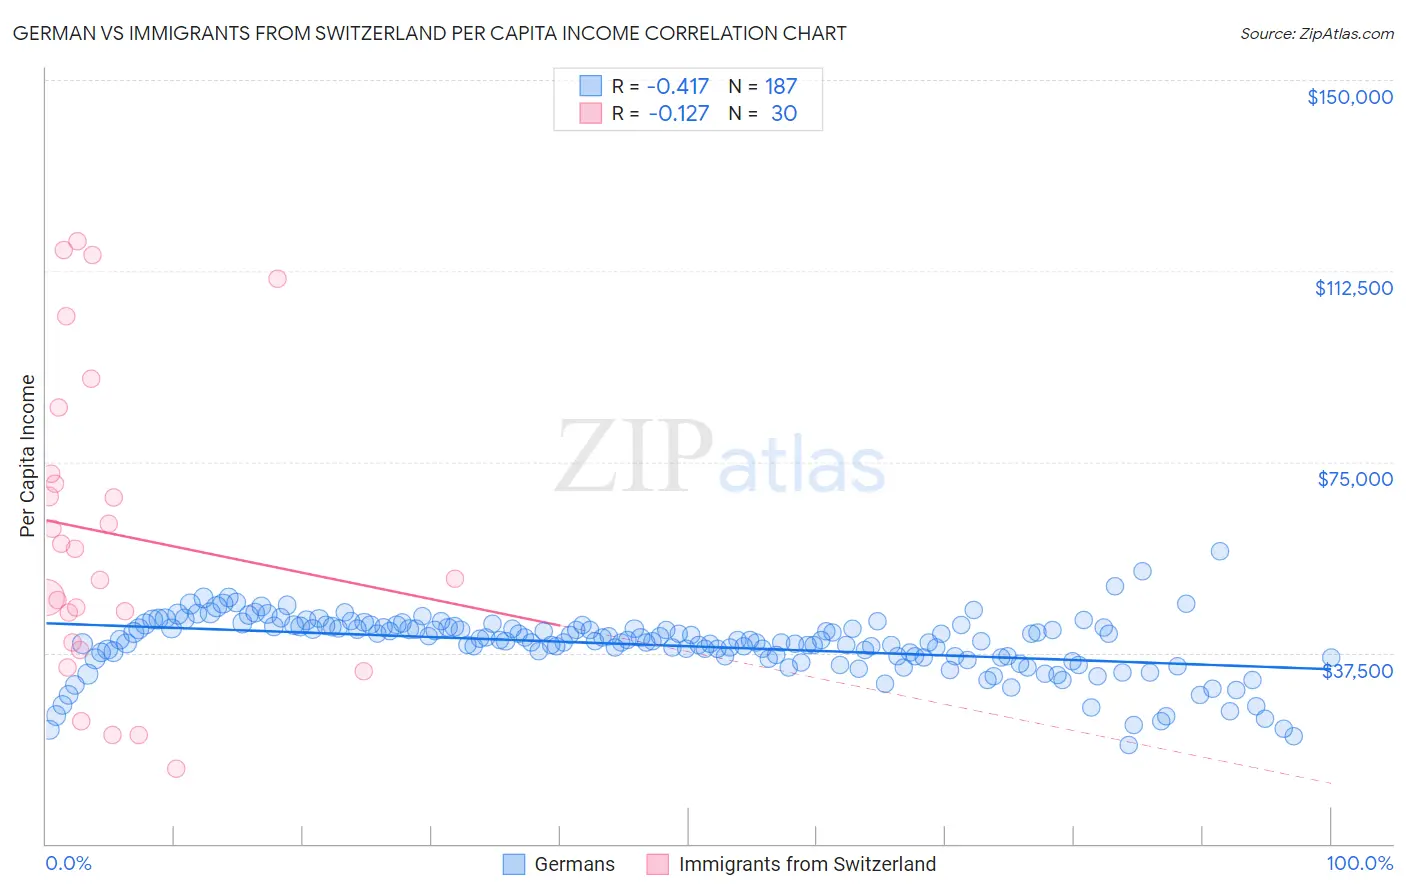
German vs Immigrants from Switzerland Per Capita Income Correlation Chart
The statistical analysis conducted on geographies consisting of 581,359,924 people shows a moderate negative correlation between the proportion of Germans and per capita income in the United States with a correlation coefficient (R) of -0.417 and weighted average of $43,067. Similarly, the statistical analysis conducted on geographies consisting of 148,083,583 people shows a poor negative correlation between the proportion of Immigrants from Switzerland and per capita income in the United States with a correlation coefficient (R) of -0.127 and weighted average of $54,866, a difference of 27.4%.
Per Capita Income Correlation Summary
| Measurement | German | Immigrants from Switzerland |
| Minimum | $19,415 | $14,801 |
| Maximum | $57,467 | $118,438 |
| Range | $38,052 | $103,637 |
| Mean | $39,066 | $60,936 |
| Median | $39,927 | $54,944 |
| Interquartile 25% (IQ1) | $36,606 | $39,569 |
| Interquartile 75% (IQ3) | $42,630 | $72,692 |
| Interquartile Range (IQR) | $6,024 | $33,123 |
| Standard Deviation (Sample) | $5,932 | $29,867 |
| Standard Deviation (Population) | $5,916 | $29,365 |
Similar Demographics by Per Capita Income
Demographics Similar to Germans by Per Capita Income
In terms of per capita income, the demographic groups most similar to Germans are Spaniard ($43,028, a difference of 0.090%), Immigrants ($43,010, a difference of 0.13%), French Canadian ($43,003, a difference of 0.15%), Immigrants from Colombia ($42,971, a difference of 0.22%), and Immigrants from Africa ($42,950, a difference of 0.27%).
| Demographics | Rating | Rank | Per Capita Income |
| Immigrants | South Eastern Asia | 46.6 /100 | #176 | Average $43,539 |
| Tlingit-Haida | 45.9 /100 | #177 | Average $43,516 |
| Immigrants | Costa Rica | 44.5 /100 | #178 | Average $43,464 |
| Finns | 44.4 /100 | #179 | Average $43,461 |
| Sierra Leoneans | 42.9 /100 | #180 | Average $43,405 |
| Welsh | 38.2 /100 | #181 | Fair $43,233 |
| Immigrants | Vietnam | 38.1 /100 | #182 | Fair $43,229 |
| Germans | 33.9 /100 | #183 | Fair $43,067 |
| Spaniards | 32.9 /100 | #184 | Fair $43,028 |
| Immigrants | Immigrants | 32.5 /100 | #185 | Fair $43,010 |
| French Canadians | 32.3 /100 | #186 | Fair $43,003 |
| Immigrants | Colombia | 31.5 /100 | #187 | Fair $42,971 |
| Immigrants | Africa | 31.0 /100 | #188 | Fair $42,950 |
| Bermudans | 30.1 /100 | #189 | Fair $42,911 |
| Kenyans | 27.7 /100 | #190 | Fair $42,808 |
Demographics Similar to Immigrants from Switzerland by Per Capita Income
In terms of per capita income, the demographic groups most similar to Immigrants from Switzerland are Cypriot ($54,899, a difference of 0.060%), Immigrants from Belgium ($55,082, a difference of 0.39%), Immigrants from France ($54,557, a difference of 0.57%), Immigrants from India ($55,268, a difference of 0.73%), and Thai ($54,307, a difference of 1.0%).
| Demographics | Rating | Rank | Per Capita Income |
| Immigrants | Ireland | 100.0 /100 | #9 | Exceptional $56,584 |
| Okinawans | 100.0 /100 | #10 | Exceptional $55,817 |
| Eastern Europeans | 100.0 /100 | #11 | Exceptional $55,780 |
| Immigrants | Sweden | 100.0 /100 | #12 | Exceptional $55,582 |
| Immigrants | India | 100.0 /100 | #13 | Exceptional $55,268 |
| Immigrants | Belgium | 100.0 /100 | #14 | Exceptional $55,082 |
| Cypriots | 100.0 /100 | #15 | Exceptional $54,899 |
| Immigrants | Switzerland | 100.0 /100 | #16 | Exceptional $54,866 |
| Immigrants | France | 100.0 /100 | #17 | Exceptional $54,557 |
| Thais | 100.0 /100 | #18 | Exceptional $54,307 |
| Immigrants | China | 100.0 /100 | #19 | Exceptional $54,264 |
| Soviet Union | 100.0 /100 | #20 | Exceptional $54,202 |
| Immigrants | Northern Europe | 100.0 /100 | #21 | Exceptional $54,159 |
| Indians (Asian) | 100.0 /100 | #22 | Exceptional $53,874 |
| Immigrants | Eastern Asia | 100.0 /100 | #23 | Exceptional $53,806 |