Ethiopian vs Immigrants from Panama Median Household Income
COMPARE
Ethiopian
Immigrants from Panama
Median Household Income
Median Household Income Comparison
Ethiopians
Immigrants from Panama
$89,640
MEDIAN HOUSEHOLD INCOME
94.9/ 100
METRIC RATING
121st/ 347
METRIC RANK
$80,873
MEDIAN HOUSEHOLD INCOME
6.2/ 100
METRIC RATING
226th/ 347
METRIC RANK
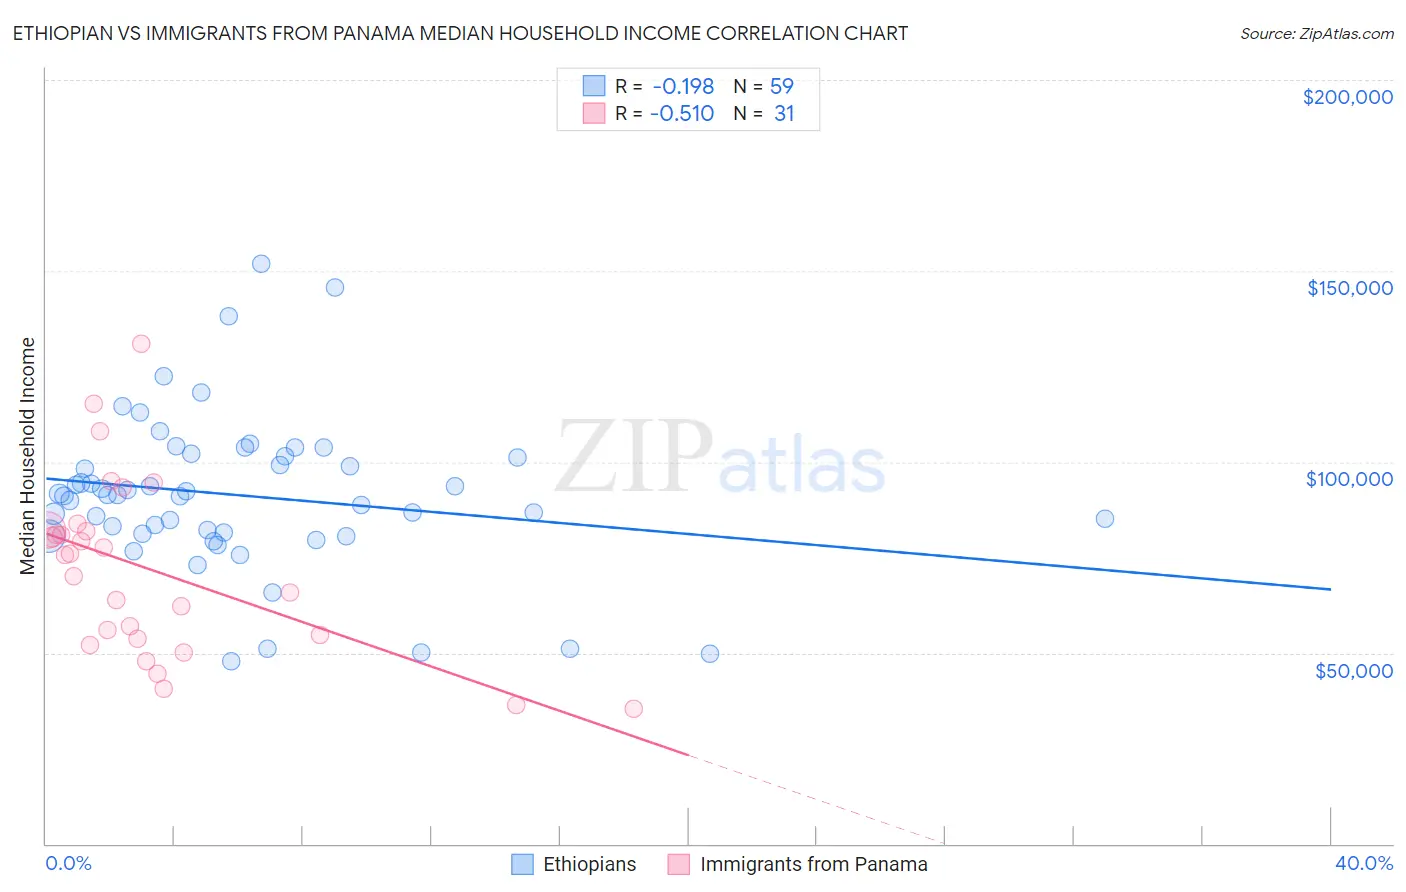
Ethiopian vs Immigrants from Panama Median Household Income Correlation Chart
The statistical analysis conducted on geographies consisting of 223,045,474 people shows a poor negative correlation between the proportion of Ethiopians and median household income in the United States with a correlation coefficient (R) of -0.198 and weighted average of $89,640. Similarly, the statistical analysis conducted on geographies consisting of 221,141,293 people shows a substantial negative correlation between the proportion of Immigrants from Panama and median household income in the United States with a correlation coefficient (R) of -0.510 and weighted average of $80,873, a difference of 10.8%.
Median Household Income Correlation Summary
| Measurement | Ethiopian | Immigrants from Panama |
| Minimum | $47,668 | $35,430 |
| Maximum | $151,943 | $130,979 |
| Range | $104,275 | $95,549 |
| Mean | $91,215 | $71,805 |
| Median | $91,248 | $75,655 |
| Interquartile 25% (IQ1) | $81,124 | $53,712 |
| Interquartile 75% (IQ3) | $101,374 | $82,267 |
| Interquartile Range (IQR) | $20,250 | $28,555 |
| Standard Deviation (Sample) | $20,515 | $23,036 |
| Standard Deviation (Population) | $20,340 | $22,661 |
Similar Demographics by Median Household Income
Demographics Similar to Ethiopians by Median Household Income
In terms of median household income, the demographic groups most similar to Ethiopians are Pakistani ($89,638, a difference of 0.0%), Immigrants from North Macedonia ($89,741, a difference of 0.11%), Albanian ($89,744, a difference of 0.12%), Immigrants from Zimbabwe ($89,496, a difference of 0.16%), and Syrian ($89,830, a difference of 0.21%).
| Demographics | Rating | Rank | Median Household Income |
| Immigrants | Northern Africa | 95.9 /100 | #114 | Exceptional $90,026 |
| Immigrants | Western Asia | 95.9 /100 | #115 | Exceptional $90,005 |
| Native Hawaiians | 95.7 /100 | #116 | Exceptional $89,919 |
| Taiwanese | 95.6 /100 | #117 | Exceptional $89,900 |
| Syrians | 95.4 /100 | #118 | Exceptional $89,830 |
| Albanians | 95.2 /100 | #119 | Exceptional $89,744 |
| Immigrants | North Macedonia | 95.2 /100 | #120 | Exceptional $89,741 |
| Ethiopians | 94.9 /100 | #121 | Exceptional $89,640 |
| Pakistanis | 94.8 /100 | #122 | Exceptional $89,638 |
| Immigrants | Zimbabwe | 94.4 /100 | #123 | Exceptional $89,496 |
| Immigrants | Jordan | 94.1 /100 | #124 | Exceptional $89,412 |
| Immigrants | Kuwait | 93.5 /100 | #125 | Exceptional $89,263 |
| Immigrants | Oceania | 92.9 /100 | #126 | Exceptional $89,100 |
| Immigrants | Peru | 92.5 /100 | #127 | Exceptional $89,010 |
| Portuguese | 92.3 /100 | #128 | Exceptional $88,976 |
Demographics Similar to Immigrants from Panama by Median Household Income
In terms of median household income, the demographic groups most similar to Immigrants from Panama are Scotch-Irish ($80,972, a difference of 0.12%), Guyanese ($80,734, a difference of 0.17%), Immigrants from Bangladesh ($80,722, a difference of 0.19%), Malaysian ($81,064, a difference of 0.24%), and Immigrants from El Salvador ($81,213, a difference of 0.42%).
| Demographics | Rating | Rank | Median Household Income |
| Nigerians | 10.3 /100 | #219 | Poor $81,725 |
| Immigrants | Venezuela | 9.0 /100 | #220 | Tragic $81,506 |
| Immigrants | Ghana | 9.0 /100 | #221 | Tragic $81,489 |
| Immigrants | Nigeria | 7.7 /100 | #222 | Tragic $81,236 |
| Immigrants | El Salvador | 7.6 /100 | #223 | Tragic $81,213 |
| Malaysians | 7.0 /100 | #224 | Tragic $81,064 |
| Scotch-Irish | 6.6 /100 | #225 | Tragic $80,972 |
| Immigrants | Panama | 6.2 /100 | #226 | Tragic $80,873 |
| Guyanese | 5.7 /100 | #227 | Tragic $80,734 |
| Immigrants | Bangladesh | 5.7 /100 | #228 | Tragic $80,722 |
| Delaware | 5.0 /100 | #229 | Tragic $80,527 |
| Bermudans | 4.7 /100 | #230 | Tragic $80,406 |
| Trinidadians and Tobagonians | 4.7 /100 | #231 | Tragic $80,402 |
| Immigrants | Trinidad and Tobago | 4.6 /100 | #232 | Tragic $80,373 |
| Immigrants | Azores | 4.5 /100 | #233 | Tragic $80,357 |