Australian vs Immigrants from Panama Median Household Income
COMPARE
Australian
Immigrants from Panama
Median Household Income
Median Household Income Comparison
Australians
Immigrants from Panama
$96,490
MEDIAN HOUSEHOLD INCOME
99.9/ 100
METRIC RATING
46th/ 347
METRIC RANK
$80,873
MEDIAN HOUSEHOLD INCOME
6.2/ 100
METRIC RATING
226th/ 347
METRIC RANK
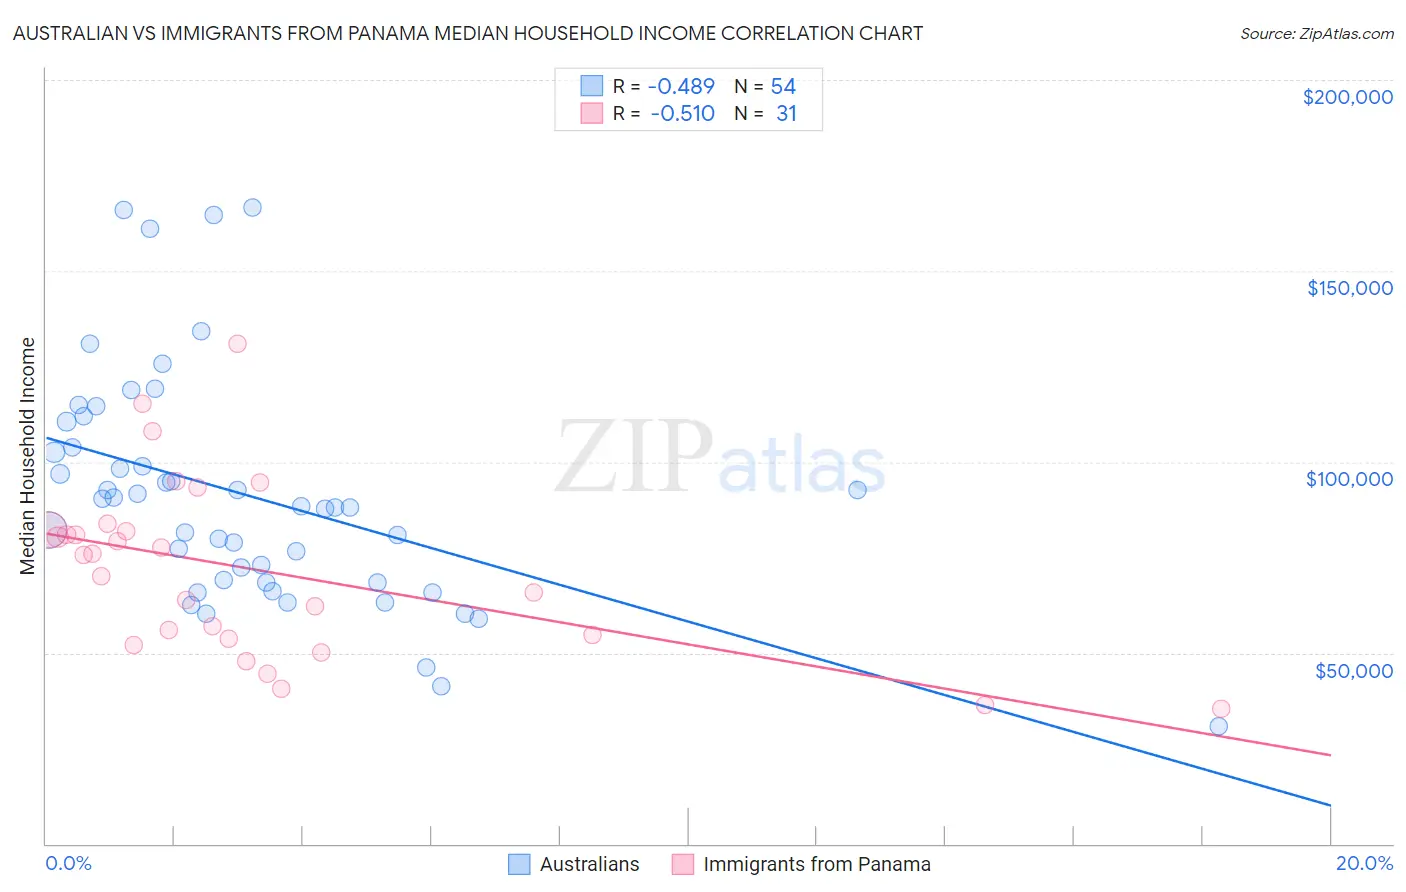
Australian vs Immigrants from Panama Median Household Income Correlation Chart
The statistical analysis conducted on geographies consisting of 223,978,576 people shows a moderate negative correlation between the proportion of Australians and median household income in the United States with a correlation coefficient (R) of -0.489 and weighted average of $96,490. Similarly, the statistical analysis conducted on geographies consisting of 221,141,293 people shows a substantial negative correlation between the proportion of Immigrants from Panama and median household income in the United States with a correlation coefficient (R) of -0.510 and weighted average of $80,873, a difference of 19.3%.
Median Household Income Correlation Summary
| Measurement | Australian | Immigrants from Panama |
| Minimum | $30,714 | $35,430 |
| Maximum | $166,528 | $130,979 |
| Range | $135,814 | $95,549 |
| Mean | $91,180 | $71,805 |
| Median | $88,142 | $75,655 |
| Interquartile 25% (IQ1) | $68,506 | $53,712 |
| Interquartile 75% (IQ3) | $103,837 | $82,267 |
| Interquartile Range (IQR) | $35,331 | $28,555 |
| Standard Deviation (Sample) | $30,330 | $23,036 |
| Standard Deviation (Population) | $30,047 | $22,661 |
Similar Demographics by Median Household Income
Demographics Similar to Australians by Median Household Income
In terms of median household income, the demographic groups most similar to Australians are Israeli ($96,552, a difference of 0.060%), Immigrants from Russia ($96,378, a difference of 0.12%), Cambodian ($96,324, a difference of 0.17%), Immigrants from Greece ($96,675, a difference of 0.19%), and Immigrants from Malaysia ($96,292, a difference of 0.21%).
| Demographics | Rating | Rank | Median Household Income |
| Afghans | 100.0 /100 | #39 | Exceptional $97,026 |
| Maltese | 100.0 /100 | #40 | Exceptional $97,015 |
| Immigrants | Turkey | 100.0 /100 | #41 | Exceptional $96,964 |
| Immigrants | Lithuania | 99.9 /100 | #42 | Exceptional $96,836 |
| Immigrants | France | 99.9 /100 | #43 | Exceptional $96,743 |
| Immigrants | Greece | 99.9 /100 | #44 | Exceptional $96,675 |
| Israelis | 99.9 /100 | #45 | Exceptional $96,552 |
| Australians | 99.9 /100 | #46 | Exceptional $96,490 |
| Immigrants | Russia | 99.9 /100 | #47 | Exceptional $96,378 |
| Cambodians | 99.9 /100 | #48 | Exceptional $96,324 |
| Immigrants | Malaysia | 99.9 /100 | #49 | Exceptional $96,292 |
| Bulgarians | 99.9 /100 | #50 | Exceptional $96,290 |
| Estonians | 99.9 /100 | #51 | Exceptional $95,930 |
| Immigrants | South Africa | 99.9 /100 | #52 | Exceptional $95,800 |
| Paraguayans | 99.9 /100 | #53 | Exceptional $95,737 |
Demographics Similar to Immigrants from Panama by Median Household Income
In terms of median household income, the demographic groups most similar to Immigrants from Panama are Scotch-Irish ($80,972, a difference of 0.12%), Guyanese ($80,734, a difference of 0.17%), Immigrants from Bangladesh ($80,722, a difference of 0.19%), Malaysian ($81,064, a difference of 0.24%), and Immigrants from El Salvador ($81,213, a difference of 0.42%).
| Demographics | Rating | Rank | Median Household Income |
| Nigerians | 10.3 /100 | #219 | Poor $81,725 |
| Immigrants | Venezuela | 9.0 /100 | #220 | Tragic $81,506 |
| Immigrants | Ghana | 9.0 /100 | #221 | Tragic $81,489 |
| Immigrants | Nigeria | 7.7 /100 | #222 | Tragic $81,236 |
| Immigrants | El Salvador | 7.6 /100 | #223 | Tragic $81,213 |
| Malaysians | 7.0 /100 | #224 | Tragic $81,064 |
| Scotch-Irish | 6.6 /100 | #225 | Tragic $80,972 |
| Immigrants | Panama | 6.2 /100 | #226 | Tragic $80,873 |
| Guyanese | 5.7 /100 | #227 | Tragic $80,734 |
| Immigrants | Bangladesh | 5.7 /100 | #228 | Tragic $80,722 |
| Delaware | 5.0 /100 | #229 | Tragic $80,527 |
| Bermudans | 4.7 /100 | #230 | Tragic $80,406 |
| Trinidadians and Tobagonians | 4.7 /100 | #231 | Tragic $80,402 |
| Immigrants | Trinidad and Tobago | 4.6 /100 | #232 | Tragic $80,373 |
| Immigrants | Azores | 4.5 /100 | #233 | Tragic $80,357 |