Estonian vs Immigrants from Belarus Median Family Income
COMPARE
Estonian
Immigrants from Belarus
Median Family Income
Median Family Income Comparison
Estonians
Immigrants from Belarus
$118,013
MEDIAN FAMILY INCOME
100.0/ 100
METRIC RATING
41st/ 347
METRIC RANK
$114,586
MEDIAN FAMILY INCOME
99.8/ 100
METRIC RATING
61st/ 347
METRIC RANK
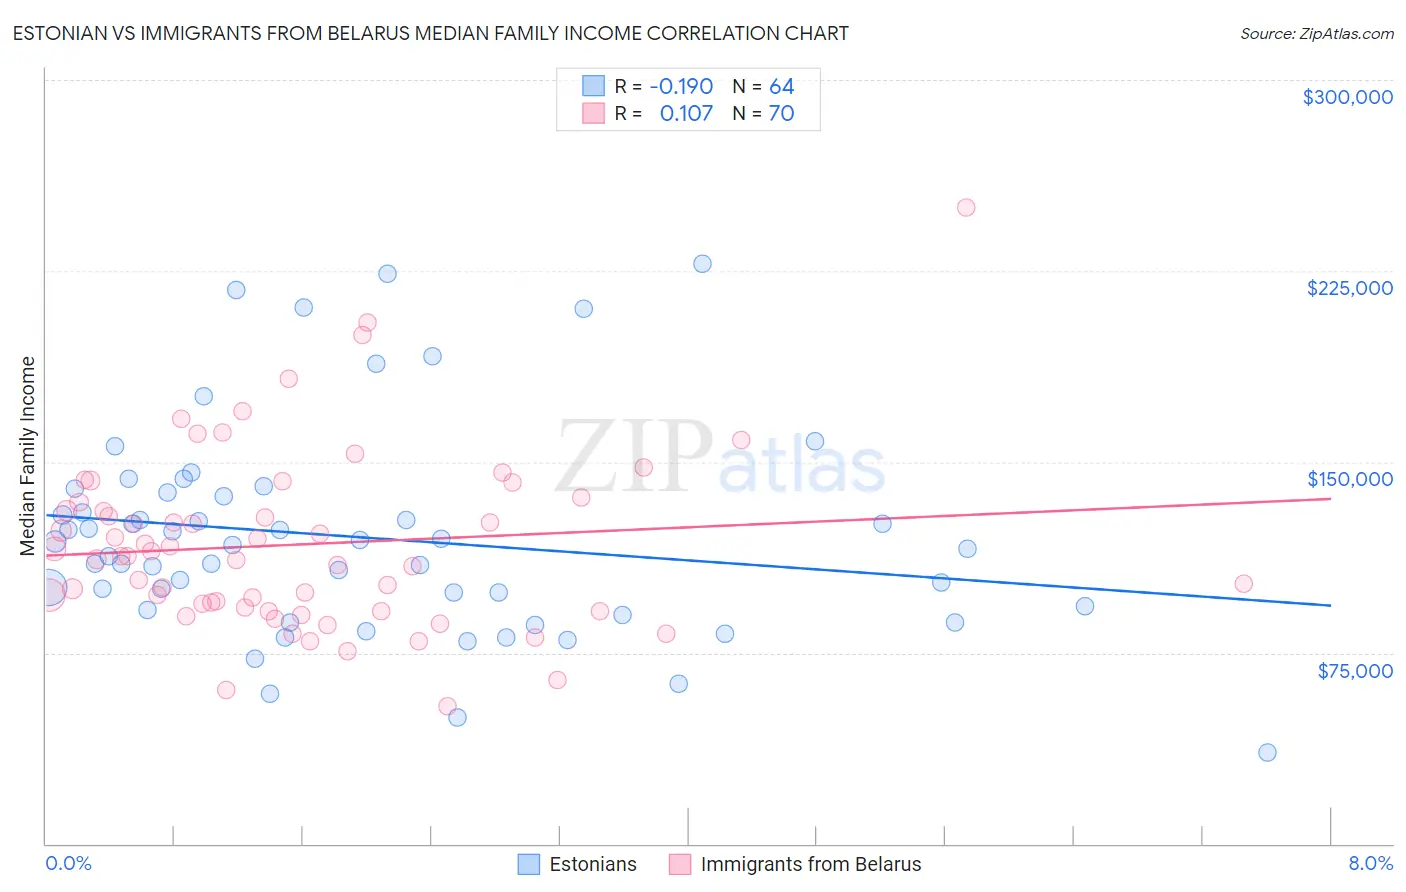
Estonian vs Immigrants from Belarus Median Family Income Correlation Chart
The statistical analysis conducted on geographies consisting of 123,476,939 people shows a poor negative correlation between the proportion of Estonians and median family income in the United States with a correlation coefficient (R) of -0.190 and weighted average of $118,013. Similarly, the statistical analysis conducted on geographies consisting of 150,185,977 people shows a poor positive correlation between the proportion of Immigrants from Belarus and median family income in the United States with a correlation coefficient (R) of 0.107 and weighted average of $114,586, a difference of 3.0%.
Median Family Income Correlation Summary
| Measurement | Estonian | Immigrants from Belarus |
| Minimum | $35,938 | $53,863 |
| Maximum | $228,043 | $250,001 |
| Range | $192,105 | $196,138 |
| Mean | $120,304 | $117,573 |
| Median | $116,733 | $112,923 |
| Interquartile 25% (IQ1) | $92,790 | $92,989 |
| Interquartile 75% (IQ3) | $137,031 | $134,250 |
| Interquartile Range (IQR) | $44,241 | $41,261 |
| Standard Deviation (Sample) | $41,178 | $34,918 |
| Standard Deviation (Population) | $40,855 | $34,668 |
Demographics Similar to Estonians and Immigrants from Belarus by Median Family Income
In terms of median family income, the demographic groups most similar to Estonians are Immigrants from Bolivia ($117,912, a difference of 0.090%), Bulgarian ($117,818, a difference of 0.17%), Cambodian ($117,780, a difference of 0.20%), Immigrants from Greece ($117,344, a difference of 0.57%), and Immigrants from Russia ($116,942, a difference of 0.92%). Similarly, the demographic groups most similar to Immigrants from Belarus are Immigrants from Latvia ($114,826, a difference of 0.21%), Immigrants from Netherlands ($114,987, a difference of 0.35%), Immigrants from Indonesia ($115,162, a difference of 0.50%), Greek ($115,192, a difference of 0.53%), and New Zealander ($115,230, a difference of 0.56%).
| Demographics | Rating | Rank | Median Family Income |
| Estonians | 100.0 /100 | #41 | Exceptional $118,013 |
| Immigrants | Bolivia | 100.0 /100 | #42 | Exceptional $117,912 |
| Bulgarians | 100.0 /100 | #43 | Exceptional $117,818 |
| Cambodians | 100.0 /100 | #44 | Exceptional $117,780 |
| Immigrants | Greece | 99.9 /100 | #45 | Exceptional $117,344 |
| Immigrants | Russia | 99.9 /100 | #46 | Exceptional $116,942 |
| Immigrants | Austria | 99.9 /100 | #47 | Exceptional $116,830 |
| Immigrants | South Africa | 99.9 /100 | #48 | Exceptional $116,286 |
| Chinese | 99.9 /100 | #49 | Exceptional $116,188 |
| Immigrants | Czechoslovakia | 99.9 /100 | #50 | Exceptional $116,165 |
| Immigrants | Malaysia | 99.9 /100 | #51 | Exceptional $115,880 |
| Maltese | 99.9 /100 | #52 | Exceptional $115,862 |
| Immigrants | Norway | 99.9 /100 | #53 | Exceptional $115,847 |
| Immigrants | Europe | 99.9 /100 | #54 | Exceptional $115,523 |
| Lithuanians | 99.8 /100 | #55 | Exceptional $115,395 |
| New Zealanders | 99.8 /100 | #56 | Exceptional $115,230 |
| Greeks | 99.8 /100 | #57 | Exceptional $115,192 |
| Immigrants | Indonesia | 99.8 /100 | #58 | Exceptional $115,162 |
| Immigrants | Netherlands | 99.8 /100 | #59 | Exceptional $114,987 |
| Immigrants | Latvia | 99.8 /100 | #60 | Exceptional $114,826 |
| Immigrants | Belarus | 99.8 /100 | #61 | Exceptional $114,586 |