Estonian vs Bangladeshi Median Family Income
COMPARE
Estonian
Bangladeshi
Median Family Income
Median Family Income Comparison
Estonians
Bangladeshis
$118,013
MEDIAN FAMILY INCOME
100.0/ 100
METRIC RATING
41st/ 347
METRIC RANK
$88,358
MEDIAN FAMILY INCOME
0.1/ 100
METRIC RATING
283rd/ 347
METRIC RANK
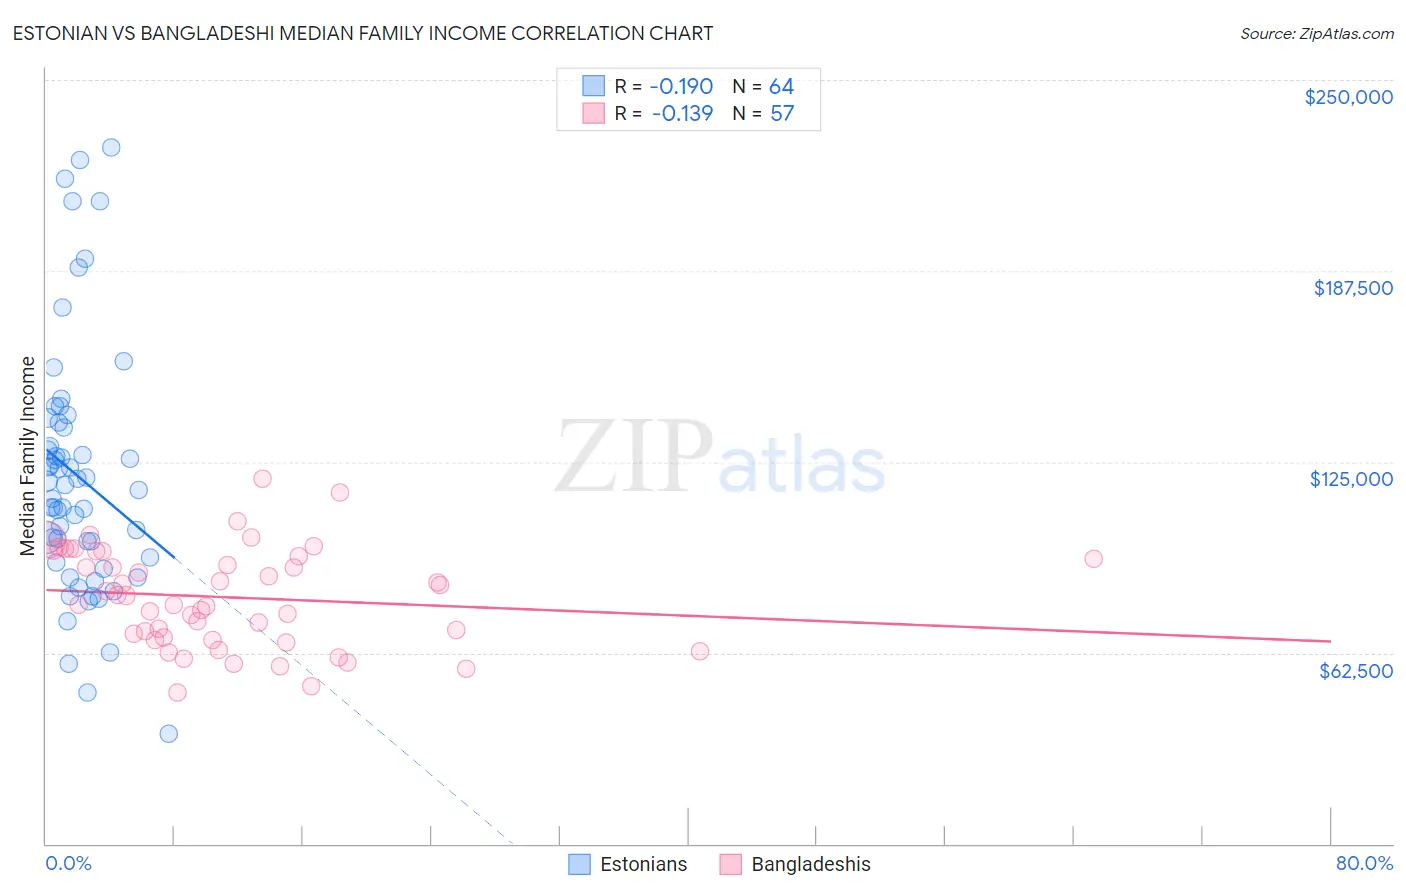
Estonian vs Bangladeshi Median Family Income Correlation Chart
The statistical analysis conducted on geographies consisting of 123,476,939 people shows a poor negative correlation between the proportion of Estonians and median family income in the United States with a correlation coefficient (R) of -0.190 and weighted average of $118,013. Similarly, the statistical analysis conducted on geographies consisting of 141,321,089 people shows a poor negative correlation between the proportion of Bangladeshis and median family income in the United States with a correlation coefficient (R) of -0.139 and weighted average of $88,358, a difference of 33.6%.
Median Family Income Correlation Summary
| Measurement | Estonian | Bangladeshi |
| Minimum | $35,938 | $49,670 |
| Maximum | $228,043 | $119,471 |
| Range | $192,105 | $69,801 |
| Mean | $120,304 | $80,654 |
| Median | $116,733 | $81,226 |
| Interquartile 25% (IQ1) | $92,790 | $67,095 |
| Interquartile 75% (IQ3) | $137,031 | $94,926 |
| Interquartile Range (IQR) | $44,241 | $27,831 |
| Standard Deviation (Sample) | $41,178 | $16,058 |
| Standard Deviation (Population) | $40,855 | $15,916 |
Similar Demographics by Median Family Income
Demographics Similar to Estonians by Median Family Income
In terms of median family income, the demographic groups most similar to Estonians are Immigrants from Lithuania ($118,053, a difference of 0.030%), Immigrants from Bolivia ($117,912, a difference of 0.090%), Bulgarian ($117,818, a difference of 0.17%), Cambodian ($117,780, a difference of 0.20%), and Immigrants from Asia ($118,291, a difference of 0.24%).
| Demographics | Rating | Rank | Median Family Income |
| Bolivians | 100.0 /100 | #34 | Exceptional $119,479 |
| Soviet Union | 100.0 /100 | #35 | Exceptional $119,262 |
| Israelis | 100.0 /100 | #36 | Exceptional $118,577 |
| Australians | 100.0 /100 | #37 | Exceptional $118,440 |
| Immigrants | Turkey | 100.0 /100 | #38 | Exceptional $118,325 |
| Immigrants | Asia | 100.0 /100 | #39 | Exceptional $118,291 |
| Immigrants | Lithuania | 100.0 /100 | #40 | Exceptional $118,053 |
| Estonians | 100.0 /100 | #41 | Exceptional $118,013 |
| Immigrants | Bolivia | 100.0 /100 | #42 | Exceptional $117,912 |
| Bulgarians | 100.0 /100 | #43 | Exceptional $117,818 |
| Cambodians | 100.0 /100 | #44 | Exceptional $117,780 |
| Immigrants | Greece | 99.9 /100 | #45 | Exceptional $117,344 |
| Immigrants | Russia | 99.9 /100 | #46 | Exceptional $116,942 |
| Immigrants | Austria | 99.9 /100 | #47 | Exceptional $116,830 |
| Immigrants | South Africa | 99.9 /100 | #48 | Exceptional $116,286 |
Demographics Similar to Bangladeshis by Median Family Income
In terms of median family income, the demographic groups most similar to Bangladeshis are Indonesian ($88,301, a difference of 0.060%), Guatemalan ($88,295, a difference of 0.070%), Immigrants from Nicaragua ($88,267, a difference of 0.10%), Potawatomi ($88,265, a difference of 0.11%), and Cherokee ($88,209, a difference of 0.17%).
| Demographics | Rating | Rank | Median Family Income |
| Immigrants | Zaire | 0.1 /100 | #276 | Tragic $89,285 |
| Immigrants | Jamaica | 0.1 /100 | #277 | Tragic $89,268 |
| Immigrants | Grenada | 0.1 /100 | #278 | Tragic $89,249 |
| Immigrants | Belize | 0.1 /100 | #279 | Tragic $89,197 |
| British West Indians | 0.1 /100 | #280 | Tragic $88,987 |
| Blackfeet | 0.1 /100 | #281 | Tragic $88,717 |
| Comanche | 0.1 /100 | #282 | Tragic $88,556 |
| Bangladeshis | 0.1 /100 | #283 | Tragic $88,358 |
| Indonesians | 0.1 /100 | #284 | Tragic $88,301 |
| Guatemalans | 0.1 /100 | #285 | Tragic $88,295 |
| Immigrants | Nicaragua | 0.1 /100 | #286 | Tragic $88,267 |
| Potawatomi | 0.1 /100 | #287 | Tragic $88,265 |
| Cherokee | 0.1 /100 | #288 | Tragic $88,209 |
| Central American Indians | 0.1 /100 | #289 | Tragic $88,034 |
| Shoshone | 0.1 /100 | #290 | Tragic $87,872 |