English vs Maltese Wage/Income Gap
COMPARE
English
Maltese
Wage/Income Gap
Wage/Income Gap Comparison
English
Maltese
29.5%
WAGE/INCOME GAP
0.0/ 100
METRIC RATING
336th/ 347
METRIC RANK
28.7%
WAGE/INCOME GAP
0.1/ 100
METRIC RATING
315th/ 347
METRIC RANK
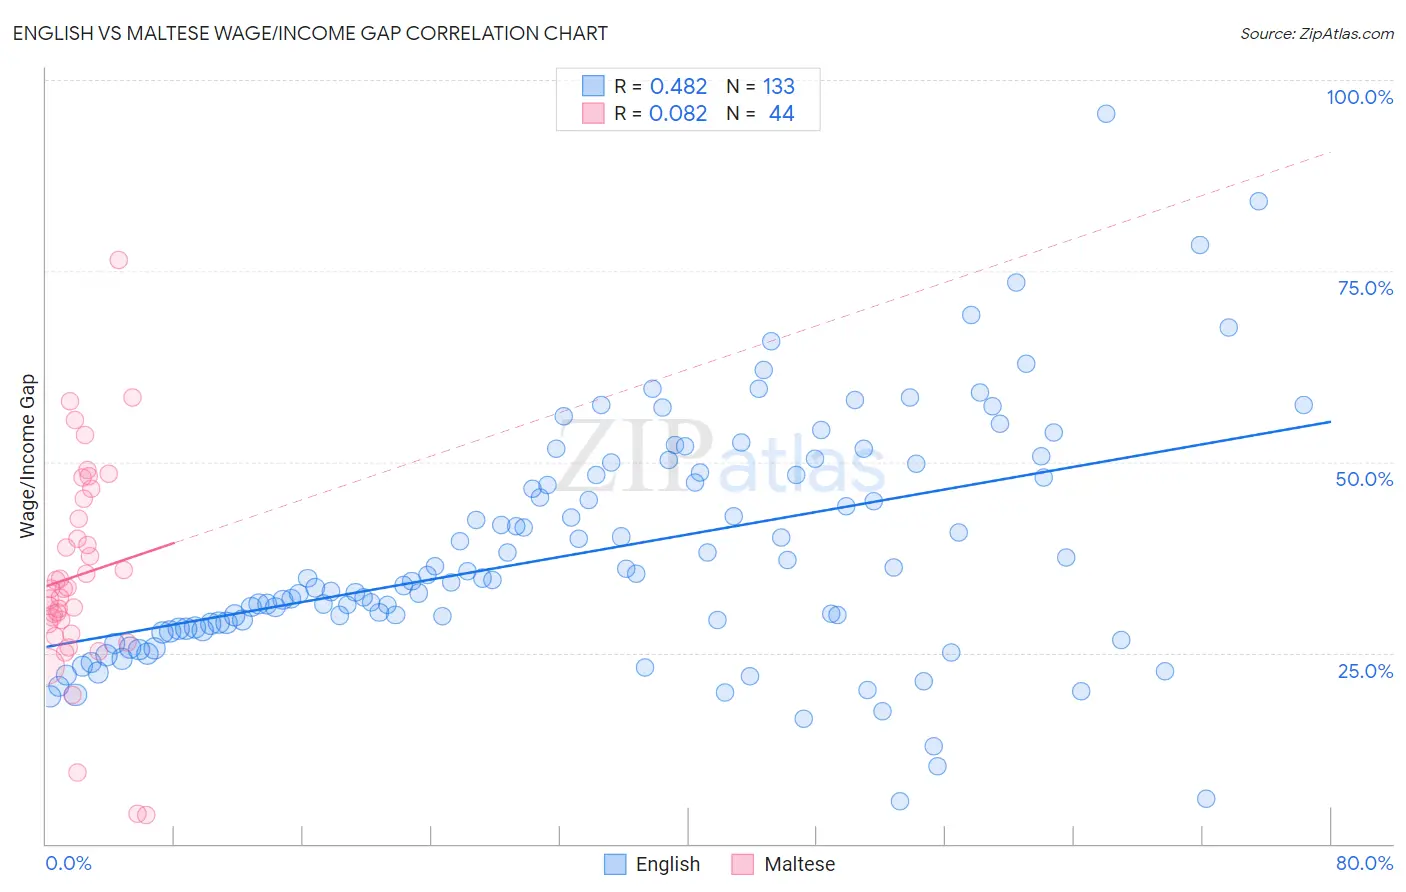
English vs Maltese Wage/Income Gap Correlation Chart
The statistical analysis conducted on geographies consisting of 575,625,723 people shows a moderate positive correlation between the proportion of English and wage/income gap percentage in the United States with a correlation coefficient (R) of 0.482 and weighted average of 29.5%. Similarly, the statistical analysis conducted on geographies consisting of 126,452,733 people shows a slight positive correlation between the proportion of Maltese and wage/income gap percentage in the United States with a correlation coefficient (R) of 0.082 and weighted average of 28.7%, a difference of 2.5%.
Wage/Income Gap Correlation Summary
| Measurement | English | Maltese |
| Minimum | 5.6% | 3.8% |
| Maximum | 95.6% | 76.5% |
| Range | 90.1% | 72.8% |
| Mean | 38.2% | 35.2% |
| Median | 34.6% | 33.4% |
| Interquartile 25% (IQ1) | 28.2% | 28.2% |
| Interquartile 75% (IQ3) | 48.5% | 43.9% |
| Interquartile Range (IQR) | 20.3% | 15.7% |
| Standard Deviation (Sample) | 15.5% | 13.9% |
| Standard Deviation (Population) | 15.4% | 13.7% |
Similar Demographics by Wage/Income Gap
Demographics Similar to English by Wage/Income Gap
In terms of wage/income gap, the demographic groups most similar to English are Immigrants from Taiwan (29.5%, a difference of 0.010%), Swedish (29.4%, a difference of 0.14%), European (29.4%, a difference of 0.28%), Immigrants from South Central Asia (29.3%, a difference of 0.47%), and Dutch (29.6%, a difference of 0.58%).
| Demographics | Rating | Rank | Wage/Income Gap |
| Scottish | 0.0 /100 | #329 | Tragic 29.1% |
| Germans | 0.0 /100 | #330 | Tragic 29.2% |
| Czechs | 0.0 /100 | #331 | Tragic 29.2% |
| Immigrants | South Central Asia | 0.0 /100 | #332 | Tragic 29.3% |
| Europeans | 0.0 /100 | #333 | Tragic 29.4% |
| Swedes | 0.0 /100 | #334 | Tragic 29.4% |
| Immigrants | Taiwan | 0.0 /100 | #335 | Tragic 29.5% |
| English | 0.0 /100 | #336 | Tragic 29.5% |
| Dutch | 0.0 /100 | #337 | Tragic 29.6% |
| Filipinos | 0.0 /100 | #338 | Tragic 29.7% |
| Iranians | 0.0 /100 | #339 | Tragic 29.7% |
| Swiss | 0.0 /100 | #340 | Tragic 30.0% |
| Thais | 0.0 /100 | #341 | Tragic 30.5% |
| Pennsylvania Germans | 0.0 /100 | #342 | Tragic 30.7% |
| Danes | 0.0 /100 | #343 | Tragic 31.0% |
Demographics Similar to Maltese by Wage/Income Gap
In terms of wage/income gap, the demographic groups most similar to Maltese are Lithuanian (28.7%, a difference of 0.010%), Immigrants from Scotland (28.7%, a difference of 0.050%), Belgian (28.8%, a difference of 0.12%), Basque (28.8%, a difference of 0.17%), and French (28.7%, a difference of 0.19%).
| Demographics | Rating | Rank | Wage/Income Gap |
| Poles | 0.1 /100 | #308 | Tragic 28.5% |
| Macedonians | 0.1 /100 | #309 | Tragic 28.6% |
| Finns | 0.1 /100 | #310 | Tragic 28.6% |
| Immigrants | Lithuania | 0.1 /100 | #311 | Tragic 28.6% |
| Eastern Europeans | 0.1 /100 | #312 | Tragic 28.6% |
| French | 0.1 /100 | #313 | Tragic 28.7% |
| Immigrants | Scotland | 0.1 /100 | #314 | Tragic 28.7% |
| Maltese | 0.1 /100 | #315 | Tragic 28.7% |
| Lithuanians | 0.1 /100 | #316 | Tragic 28.7% |
| Belgians | 0.1 /100 | #317 | Tragic 28.8% |
| Basques | 0.1 /100 | #318 | Tragic 28.8% |
| Slovaks | 0.1 /100 | #319 | Tragic 28.9% |
| British | 0.1 /100 | #320 | Tragic 28.9% |
| Welsh | 0.1 /100 | #321 | Tragic 28.9% |
| Immigrants | Singapore | 0.1 /100 | #322 | Tragic 28.9% |