Ecuadorian vs Immigrants from Micronesia Median Female Earnings
COMPARE
Ecuadorian
Immigrants from Micronesia
Median Female Earnings
Median Female Earnings Comparison
Ecuadorians
Immigrants from Micronesia
$39,117
MEDIAN FEMALE EARNINGS
23.0/ 100
METRIC RATING
198th/ 347
METRIC RANK
$35,477
MEDIAN FEMALE EARNINGS
0.0/ 100
METRIC RATING
298th/ 347
METRIC RANK
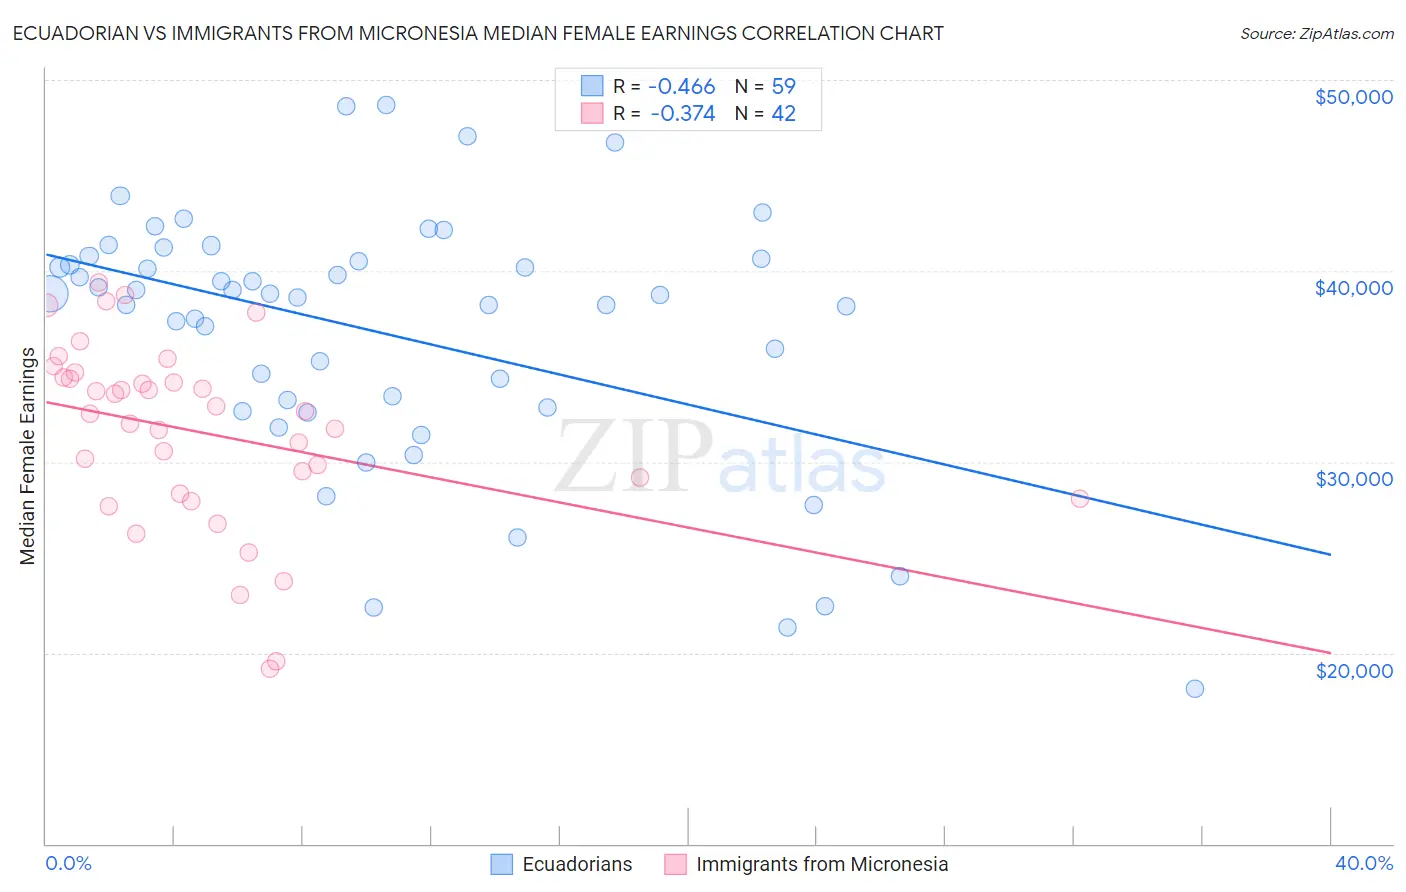
Ecuadorian vs Immigrants from Micronesia Median Female Earnings Correlation Chart
The statistical analysis conducted on geographies consisting of 317,768,911 people shows a moderate negative correlation between the proportion of Ecuadorians and median female earnings in the United States with a correlation coefficient (R) of -0.466 and weighted average of $39,117. Similarly, the statistical analysis conducted on geographies consisting of 61,601,305 people shows a mild negative correlation between the proportion of Immigrants from Micronesia and median female earnings in the United States with a correlation coefficient (R) of -0.374 and weighted average of $35,477, a difference of 10.3%.
Median Female Earnings Correlation Summary
| Measurement | Ecuadorian | Immigrants from Micronesia |
| Minimum | $18,150 | $19,167 |
| Maximum | $48,689 | $39,412 |
| Range | $30,539 | $20,245 |
| Mean | $36,751 | $31,538 |
| Median | $38,737 | $32,587 |
| Interquartile 25% (IQ1) | $32,822 | $28,333 |
| Interquartile 75% (IQ3) | $40,668 | $34,418 |
| Interquartile Range (IQR) | $7,846 | $6,085 |
| Standard Deviation (Sample) | $6,680 | $4,851 |
| Standard Deviation (Population) | $6,623 | $4,793 |
Similar Demographics by Median Female Earnings
Demographics Similar to Ecuadorians by Median Female Earnings
In terms of median female earnings, the demographic groups most similar to Ecuadorians are Icelander ($39,109, a difference of 0.020%), Assyrian/Chaldean/Syriac ($39,159, a difference of 0.11%), Immigrants from Panama ($39,049, a difference of 0.17%), Panamanian ($39,049, a difference of 0.17%), and Immigrants from Costa Rica ($39,186, a difference of 0.18%).
| Demographics | Rating | Rank | Median Female Earnings |
| Immigrants | Western Africa | 32.7 /100 | #191 | Fair $39,351 |
| Immigrants | Immigrants | 31.7 /100 | #192 | Fair $39,328 |
| Immigrants | Nigeria | 30.2 /100 | #193 | Fair $39,294 |
| Irish | 30.0 /100 | #194 | Fair $39,291 |
| Uruguayans | 27.3 /100 | #195 | Fair $39,228 |
| Immigrants | Costa Rica | 25.6 /100 | #196 | Fair $39,186 |
| Assyrians/Chaldeans/Syriacs | 24.6 /100 | #197 | Fair $39,159 |
| Ecuadorians | 23.0 /100 | #198 | Fair $39,117 |
| Icelanders | 22.7 /100 | #199 | Fair $39,109 |
| Immigrants | Panama | 20.6 /100 | #200 | Fair $39,049 |
| Panamanians | 20.6 /100 | #201 | Fair $39,049 |
| Slovaks | 19.9 /100 | #202 | Poor $39,029 |
| Czechs | 18.7 /100 | #203 | Poor $38,992 |
| Immigrants | Uruguay | 17.3 /100 | #204 | Poor $38,945 |
| Immigrants | Colombia | 16.3 /100 | #205 | Poor $38,913 |
Demographics Similar to Immigrants from Micronesia by Median Female Earnings
In terms of median female earnings, the demographic groups most similar to Immigrants from Micronesia are Hmong ($35,498, a difference of 0.060%), Immigrants from Guatemala ($35,444, a difference of 0.090%), Yuman ($35,377, a difference of 0.28%), Mexican American Indian ($35,629, a difference of 0.43%), and Pima ($35,326, a difference of 0.43%).
| Demographics | Rating | Rank | Median Female Earnings |
| Blackfeet | 0.0 /100 | #291 | Tragic $35,864 |
| Americans | 0.0 /100 | #292 | Tragic $35,777 |
| Guatemalans | 0.0 /100 | #293 | Tragic $35,695 |
| Cheyenne | 0.0 /100 | #294 | Tragic $35,673 |
| Comanche | 0.0 /100 | #295 | Tragic $35,661 |
| Mexican American Indians | 0.0 /100 | #296 | Tragic $35,629 |
| Hmong | 0.0 /100 | #297 | Tragic $35,498 |
| Immigrants | Micronesia | 0.0 /100 | #298 | Tragic $35,477 |
| Immigrants | Guatemala | 0.0 /100 | #299 | Tragic $35,444 |
| Yuman | 0.0 /100 | #300 | Tragic $35,377 |
| Pima | 0.0 /100 | #301 | Tragic $35,326 |
| Blacks/African Americans | 0.0 /100 | #302 | Tragic $35,315 |
| Immigrants | Latin America | 0.0 /100 | #303 | Tragic $35,307 |
| Crow | 0.0 /100 | #304 | Tragic $35,266 |
| Bahamians | 0.0 /100 | #305 | Tragic $35,125 |