Albanian vs Immigrants from Micronesia Median Female Earnings
COMPARE
Albanian
Immigrants from Micronesia
Median Female Earnings
Median Female Earnings Comparison
Albanians
Immigrants from Micronesia
$42,584
MEDIAN FEMALE EARNINGS
99.8/ 100
METRIC RATING
72nd/ 347
METRIC RANK
$35,477
MEDIAN FEMALE EARNINGS
0.0/ 100
METRIC RATING
298th/ 347
METRIC RANK
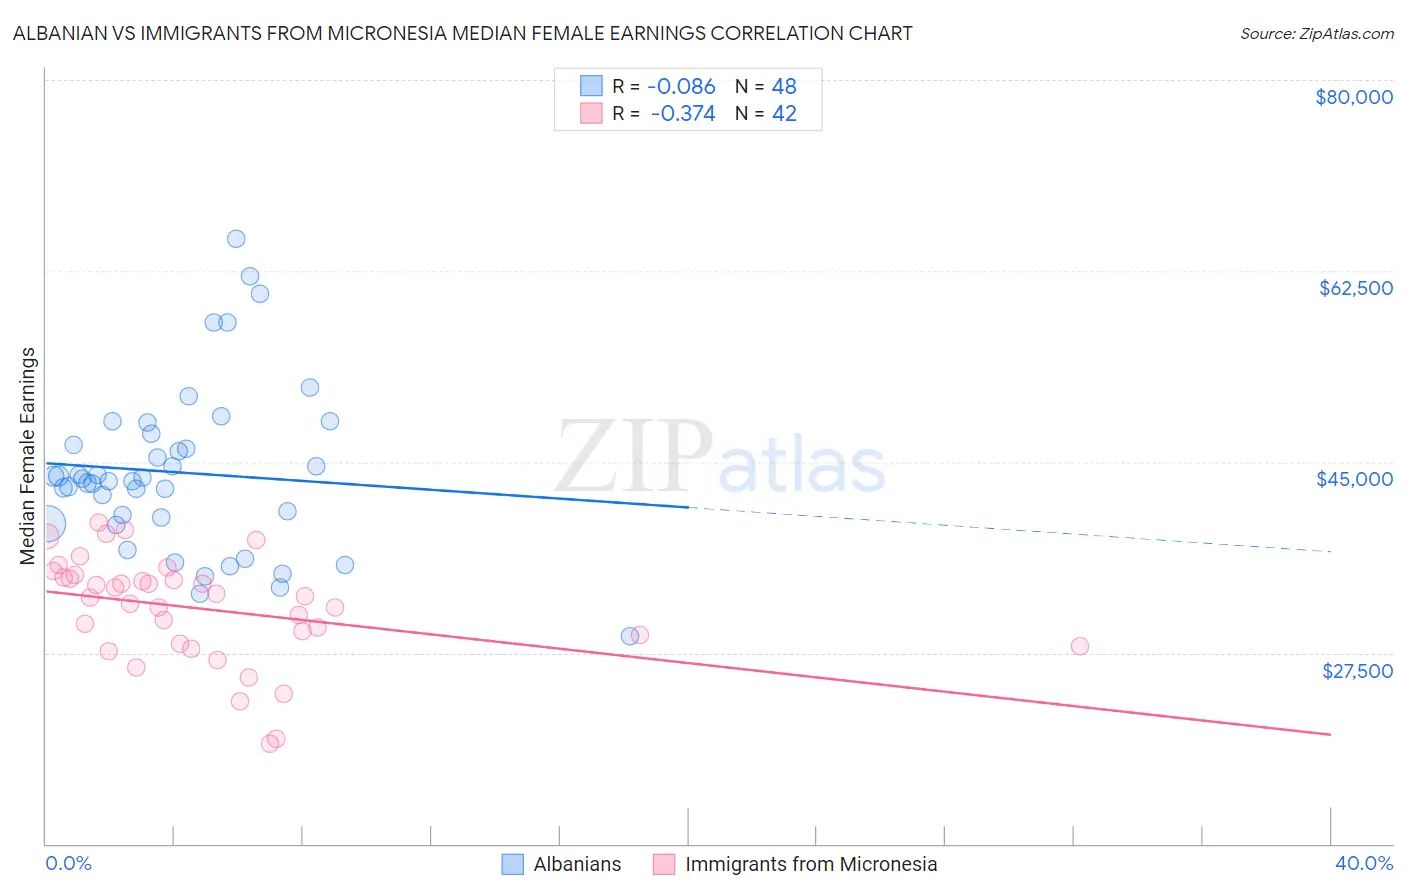
Albanian vs Immigrants from Micronesia Median Female Earnings Correlation Chart
The statistical analysis conducted on geographies consisting of 193,224,752 people shows a slight negative correlation between the proportion of Albanians and median female earnings in the United States with a correlation coefficient (R) of -0.086 and weighted average of $42,584. Similarly, the statistical analysis conducted on geographies consisting of 61,601,305 people shows a mild negative correlation between the proportion of Immigrants from Micronesia and median female earnings in the United States with a correlation coefficient (R) of -0.374 and weighted average of $35,477, a difference of 20.0%.
Median Female Earnings Correlation Summary
| Measurement | Albanian | Immigrants from Micronesia |
| Minimum | $29,043 | $19,167 |
| Maximum | $65,406 | $39,412 |
| Range | $36,363 | $20,245 |
| Mean | $44,026 | $31,538 |
| Median | $43,361 | $32,587 |
| Interquartile 25% (IQ1) | $39,614 | $28,333 |
| Interquartile 75% (IQ3) | $47,094 | $34,418 |
| Interquartile Range (IQR) | $7,480 | $6,085 |
| Standard Deviation (Sample) | $7,618 | $4,851 |
| Standard Deviation (Population) | $7,538 | $4,793 |
Similar Demographics by Median Female Earnings
Demographics Similar to Albanians by Median Female Earnings
In terms of median female earnings, the demographic groups most similar to Albanians are Mongolian ($42,542, a difference of 0.10%), Immigrants from South Africa ($42,508, a difference of 0.18%), Immigrants from Romania ($42,718, a difference of 0.32%), New Zealander ($42,446, a difference of 0.32%), and Immigrants from Italy ($42,446, a difference of 0.33%).
| Demographics | Rating | Rank | Median Female Earnings |
| Sierra Leoneans | 99.9 /100 | #65 | Exceptional $42,868 |
| Immigrants | Norway | 99.9 /100 | #66 | Exceptional $42,837 |
| Immigrants | Egypt | 99.9 /100 | #67 | Exceptional $42,837 |
| Immigrants | Austria | 99.8 /100 | #68 | Exceptional $42,824 |
| Immigrants | Spain | 99.8 /100 | #69 | Exceptional $42,815 |
| Immigrants | Ethiopia | 99.8 /100 | #70 | Exceptional $42,744 |
| Immigrants | Romania | 99.8 /100 | #71 | Exceptional $42,718 |
| Albanians | 99.8 /100 | #72 | Exceptional $42,584 |
| Mongolians | 99.7 /100 | #73 | Exceptional $42,542 |
| Immigrants | South Africa | 99.7 /100 | #74 | Exceptional $42,508 |
| New Zealanders | 99.7 /100 | #75 | Exceptional $42,446 |
| Immigrants | Italy | 99.7 /100 | #76 | Exceptional $42,446 |
| Immigrants | Albania | 99.6 /100 | #77 | Exceptional $42,388 |
| Immigrants | Kazakhstan | 99.6 /100 | #78 | Exceptional $42,386 |
| Greeks | 99.6 /100 | #79 | Exceptional $42,336 |
Demographics Similar to Immigrants from Micronesia by Median Female Earnings
In terms of median female earnings, the demographic groups most similar to Immigrants from Micronesia are Hmong ($35,498, a difference of 0.060%), Immigrants from Guatemala ($35,444, a difference of 0.090%), Yuman ($35,377, a difference of 0.28%), Mexican American Indian ($35,629, a difference of 0.43%), and Pima ($35,326, a difference of 0.43%).
| Demographics | Rating | Rank | Median Female Earnings |
| Blackfeet | 0.0 /100 | #291 | Tragic $35,864 |
| Americans | 0.0 /100 | #292 | Tragic $35,777 |
| Guatemalans | 0.0 /100 | #293 | Tragic $35,695 |
| Cheyenne | 0.0 /100 | #294 | Tragic $35,673 |
| Comanche | 0.0 /100 | #295 | Tragic $35,661 |
| Mexican American Indians | 0.0 /100 | #296 | Tragic $35,629 |
| Hmong | 0.0 /100 | #297 | Tragic $35,498 |
| Immigrants | Micronesia | 0.0 /100 | #298 | Tragic $35,477 |
| Immigrants | Guatemala | 0.0 /100 | #299 | Tragic $35,444 |
| Yuman | 0.0 /100 | #300 | Tragic $35,377 |
| Pima | 0.0 /100 | #301 | Tragic $35,326 |
| Blacks/African Americans | 0.0 /100 | #302 | Tragic $35,315 |
| Immigrants | Latin America | 0.0 /100 | #303 | Tragic $35,307 |
| Crow | 0.0 /100 | #304 | Tragic $35,266 |
| Bahamians | 0.0 /100 | #305 | Tragic $35,125 |