Eastern European vs Brazilian Wage/Income Gap
COMPARE
Eastern European
Brazilian
Wage/Income Gap
Wage/Income Gap Comparison
Eastern Europeans
Brazilians
28.6%
WAGE/INCOME GAP
0.1/ 100
METRIC RATING
312th/ 347
METRIC RANK
26.7%
WAGE/INCOME GAP
9.2/ 100
METRIC RATING
217th/ 347
METRIC RANK
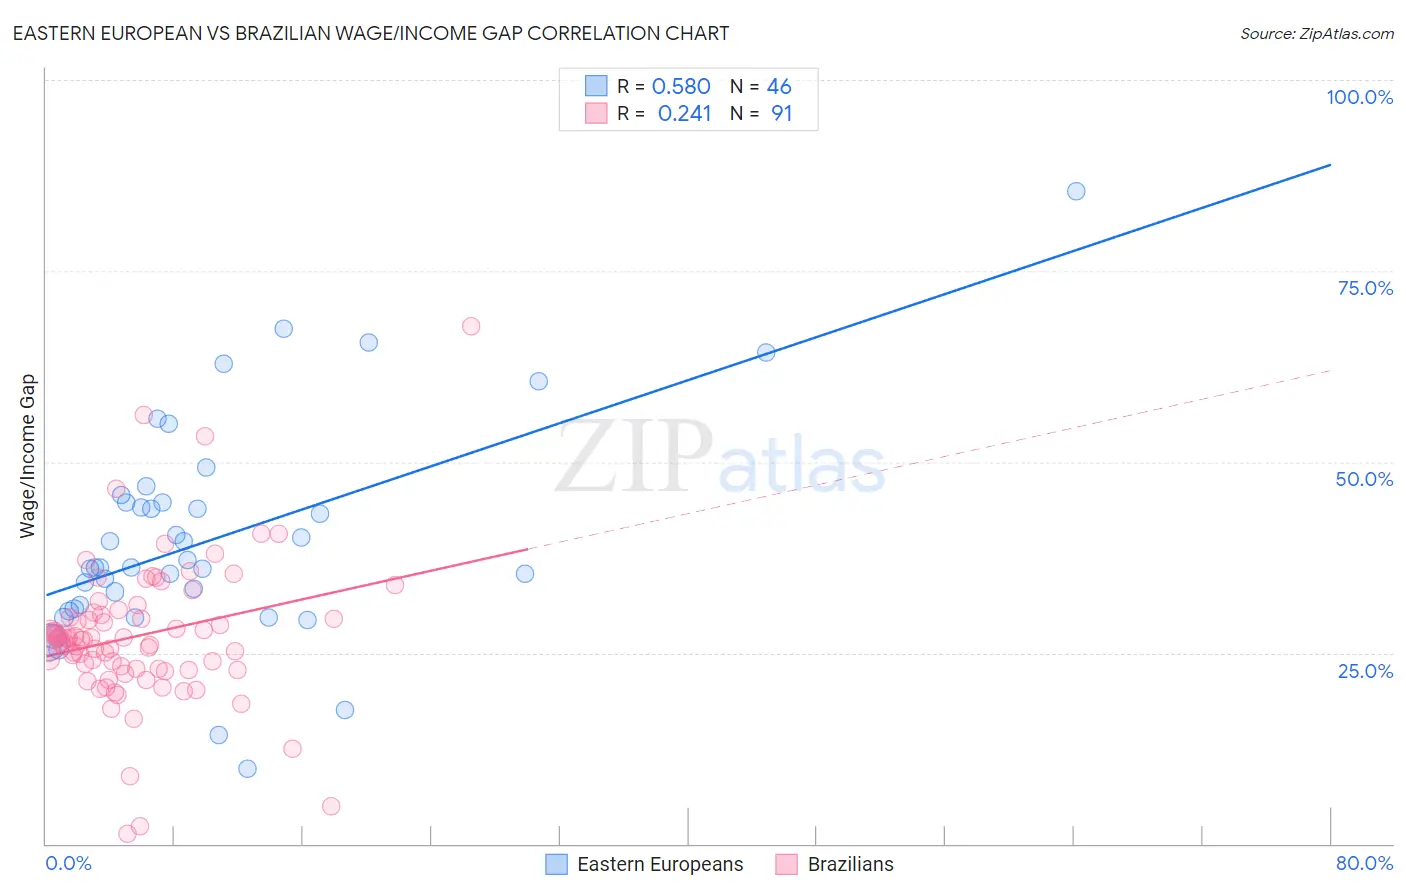
Eastern European vs Brazilian Wage/Income Gap Correlation Chart
The statistical analysis conducted on geographies consisting of 460,606,306 people shows a substantial positive correlation between the proportion of Eastern Europeans and wage/income gap percentage in the United States with a correlation coefficient (R) of 0.580 and weighted average of 28.6%. Similarly, the statistical analysis conducted on geographies consisting of 323,810,201 people shows a weak positive correlation between the proportion of Brazilians and wage/income gap percentage in the United States with a correlation coefficient (R) of 0.241 and weighted average of 26.7%, a difference of 7.2%.
Wage/Income Gap Correlation Summary
| Measurement | Eastern European | Brazilian |
| Minimum | 9.9% | 1.4% |
| Maximum | 85.4% | 67.8% |
| Range | 75.6% | 66.4% |
| Mean | 39.9% | 27.2% |
| Median | 36.2% | 26.7% |
| Interquartile 25% (IQ1) | 30.7% | 22.9% |
| Interquartile 75% (IQ3) | 44.6% | 29.9% |
| Interquartile Range (IQR) | 13.9% | 7.0% |
| Standard Deviation (Sample) | 14.4% | 9.5% |
| Standard Deviation (Population) | 14.3% | 9.5% |
Similar Demographics by Wage/Income Gap
Demographics Similar to Eastern Europeans by Wage/Income Gap
In terms of wage/income gap, the demographic groups most similar to Eastern Europeans are Immigrants from Lithuania (28.6%, a difference of 0.13%), French (28.7%, a difference of 0.13%), Finnish (28.6%, a difference of 0.20%), Immigrants from Scotland (28.7%, a difference of 0.27%), and Macedonian (28.6%, a difference of 0.29%).
| Demographics | Rating | Rank | Wage/Income Gap |
| Immigrants | South Africa | 0.1 /100 | #305 | Tragic 28.5% |
| Whites/Caucasians | 0.1 /100 | #306 | Tragic 28.5% |
| Immigrants | Denmark | 0.1 /100 | #307 | Tragic 28.5% |
| Poles | 0.1 /100 | #308 | Tragic 28.5% |
| Macedonians | 0.1 /100 | #309 | Tragic 28.6% |
| Finns | 0.1 /100 | #310 | Tragic 28.6% |
| Immigrants | Lithuania | 0.1 /100 | #311 | Tragic 28.6% |
| Eastern Europeans | 0.1 /100 | #312 | Tragic 28.6% |
| French | 0.1 /100 | #313 | Tragic 28.7% |
| Immigrants | Scotland | 0.1 /100 | #314 | Tragic 28.7% |
| Maltese | 0.1 /100 | #315 | Tragic 28.7% |
| Lithuanians | 0.1 /100 | #316 | Tragic 28.7% |
| Belgians | 0.1 /100 | #317 | Tragic 28.8% |
| Basques | 0.1 /100 | #318 | Tragic 28.8% |
| Slovaks | 0.1 /100 | #319 | Tragic 28.9% |
Demographics Similar to Brazilians by Wage/Income Gap
In terms of wage/income gap, the demographic groups most similar to Brazilians are Immigrants from Saudi Arabia (26.7%, a difference of 0.030%), Immigrants from Portugal (26.7%, a difference of 0.050%), Immigrants from Poland (26.7%, a difference of 0.050%), Immigrants from Latvia (26.7%, a difference of 0.070%), and Yugoslavian (26.7%, a difference of 0.10%).
| Demographics | Rating | Rank | Wage/Income Gap |
| Arabs | 12.3 /100 | #210 | Poor 26.6% |
| Mongolians | 11.4 /100 | #211 | Poor 26.6% |
| Iraqis | 11.2 /100 | #212 | Poor 26.6% |
| Immigrants | Iraq | 10.3 /100 | #213 | Poor 26.7% |
| Immigrants | China | 10.3 /100 | #214 | Poor 26.7% |
| Yugoslavians | 9.7 /100 | #215 | Tragic 26.7% |
| Immigrants | Portugal | 9.5 /100 | #216 | Tragic 26.7% |
| Brazilians | 9.2 /100 | #217 | Tragic 26.7% |
| Immigrants | Saudi Arabia | 9.1 /100 | #218 | Tragic 26.7% |
| Immigrants | Poland | 8.9 /100 | #219 | Tragic 26.7% |
| Immigrants | Latvia | 8.9 /100 | #220 | Tragic 26.7% |
| Immigrants | Spain | 8.5 /100 | #221 | Tragic 26.8% |
| Bolivians | 8.3 /100 | #222 | Tragic 26.8% |
| Jordanians | 8.0 /100 | #223 | Tragic 26.8% |
| Immigrants | Argentina | 7.2 /100 | #224 | Tragic 26.8% |