Dominican vs Inupiat Median Earnings
COMPARE
Dominican
Inupiat
Median Earnings
Median Earnings Comparison
Dominicans
Inupiat
$41,864
MEDIAN EARNINGS
0.2/ 100
METRIC RATING
283rd/ 347
METRIC RANK
$43,000
MEDIAN EARNINGS
0.8/ 100
METRIC RATING
263rd/ 347
METRIC RANK
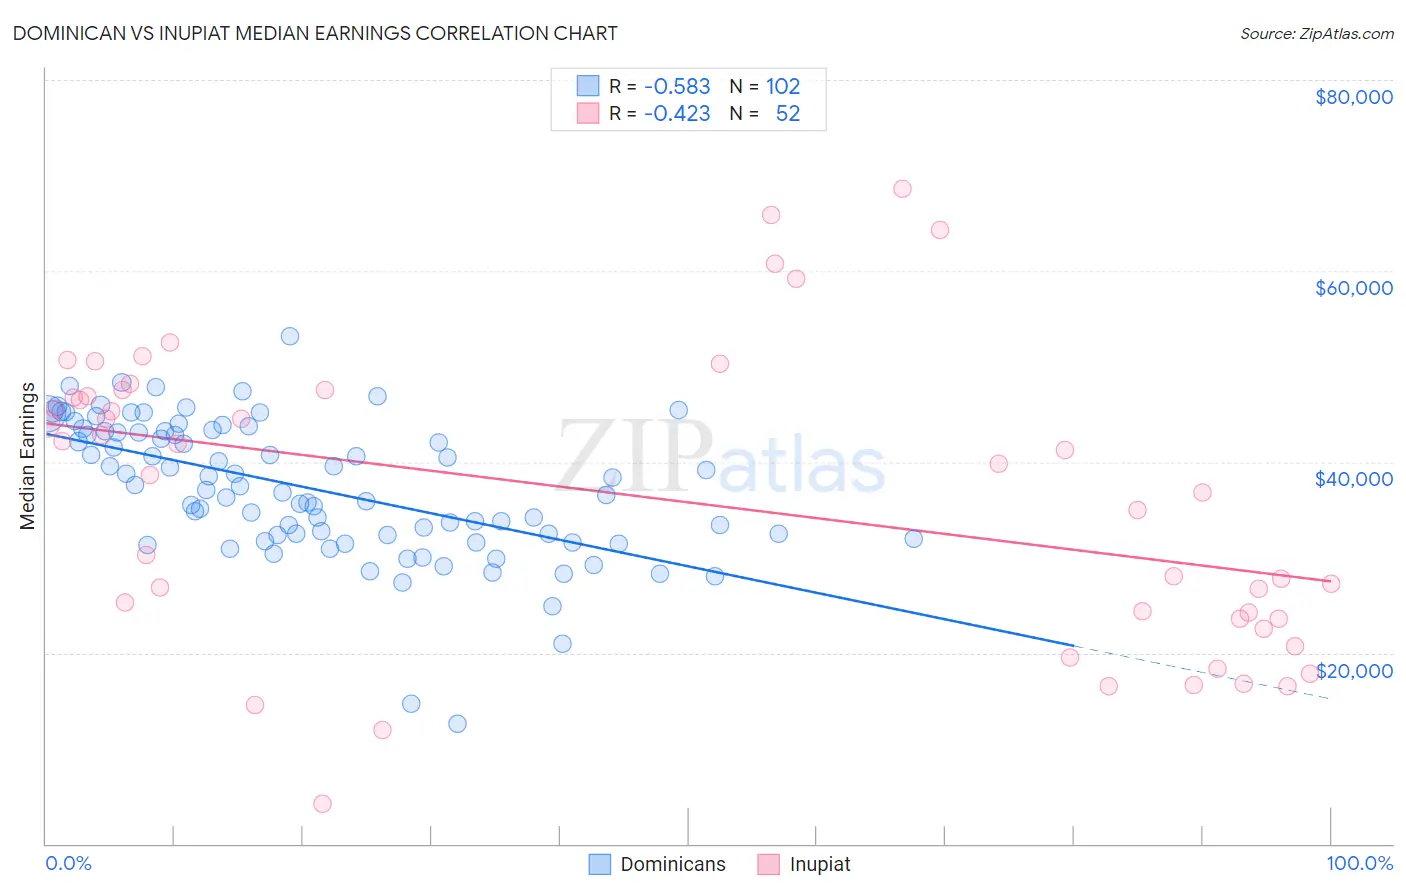
Dominican vs Inupiat Median Earnings Correlation Chart
The statistical analysis conducted on geographies consisting of 355,132,428 people shows a substantial negative correlation between the proportion of Dominicans and median earnings in the United States with a correlation coefficient (R) of -0.583 and weighted average of $41,864. Similarly, the statistical analysis conducted on geographies consisting of 96,339,660 people shows a moderate negative correlation between the proportion of Inupiat and median earnings in the United States with a correlation coefficient (R) of -0.423 and weighted average of $43,000, a difference of 2.7%.
Median Earnings Correlation Summary
| Measurement | Dominican | Inupiat |
| Minimum | $12,552 | $4,192 |
| Maximum | $53,134 | $68,590 |
| Range | $40,582 | $64,398 |
| Mean | $37,192 | $36,209 |
| Median | $37,213 | $39,208 |
| Interquartile 25% (IQ1) | $32,338 | $23,611 |
| Interquartile 75% (IQ3) | $43,235 | $47,170 |
| Interquartile Range (IQR) | $10,898 | $23,559 |
| Standard Deviation (Sample) | $7,182 | $15,551 |
| Standard Deviation (Population) | $7,146 | $15,401 |
Demographics Similar to Dominicans and Inupiat by Median Earnings
In terms of median earnings, the demographic groups most similar to Dominicans are African ($41,955, a difference of 0.22%), Marshallese ($41,969, a difference of 0.25%), Hmong ($42,111, a difference of 0.59%), Colville ($42,151, a difference of 0.69%), and Cajun ($42,189, a difference of 0.78%). Similarly, the demographic groups most similar to Inupiat are Immigrants from Liberia ($42,923, a difference of 0.18%), Salvadoran ($42,912, a difference of 0.20%), Immigrants from Laos ($42,884, a difference of 0.27%), Cree ($42,777, a difference of 0.52%), and American ($42,742, a difference of 0.60%).
| Demographics | Rating | Rank | Median Earnings |
| Inupiat | 0.8 /100 | #263 | Tragic $43,000 |
| Immigrants | Liberia | 0.7 /100 | #264 | Tragic $42,923 |
| Salvadorans | 0.7 /100 | #265 | Tragic $42,912 |
| Immigrants | Laos | 0.7 /100 | #266 | Tragic $42,884 |
| Cree | 0.6 /100 | #267 | Tragic $42,777 |
| Americans | 0.6 /100 | #268 | Tragic $42,742 |
| Belizeans | 0.5 /100 | #269 | Tragic $42,702 |
| Osage | 0.5 /100 | #270 | Tragic $42,651 |
| Pennsylvania Germans | 0.5 /100 | #271 | Tragic $42,615 |
| Iroquois | 0.4 /100 | #272 | Tragic $42,430 |
| Immigrants | Dominica | 0.4 /100 | #273 | Tragic $42,420 |
| Immigrants | El Salvador | 0.4 /100 | #274 | Tragic $42,413 |
| Immigrants | Belize | 0.3 /100 | #275 | Tragic $42,339 |
| Spanish Americans | 0.3 /100 | #276 | Tragic $42,316 |
| Central Americans | 0.3 /100 | #277 | Tragic $42,280 |
| Cajuns | 0.3 /100 | #278 | Tragic $42,189 |
| Colville | 0.2 /100 | #279 | Tragic $42,151 |
| Hmong | 0.2 /100 | #280 | Tragic $42,111 |
| Marshallese | 0.2 /100 | #281 | Tragic $41,969 |
| Africans | 0.2 /100 | #282 | Tragic $41,955 |
| Dominicans | 0.2 /100 | #283 | Tragic $41,864 |