Dominican vs Immigrants from Western Africa Median Earnings
COMPARE
Dominican
Immigrants from Western Africa
Median Earnings
Median Earnings Comparison
Dominicans
Immigrants from Western Africa
$41,864
MEDIAN EARNINGS
0.2/ 100
METRIC RATING
283rd/ 347
METRIC RANK
$44,893
MEDIAN EARNINGS
10.3/ 100
METRIC RATING
230th/ 347
METRIC RANK
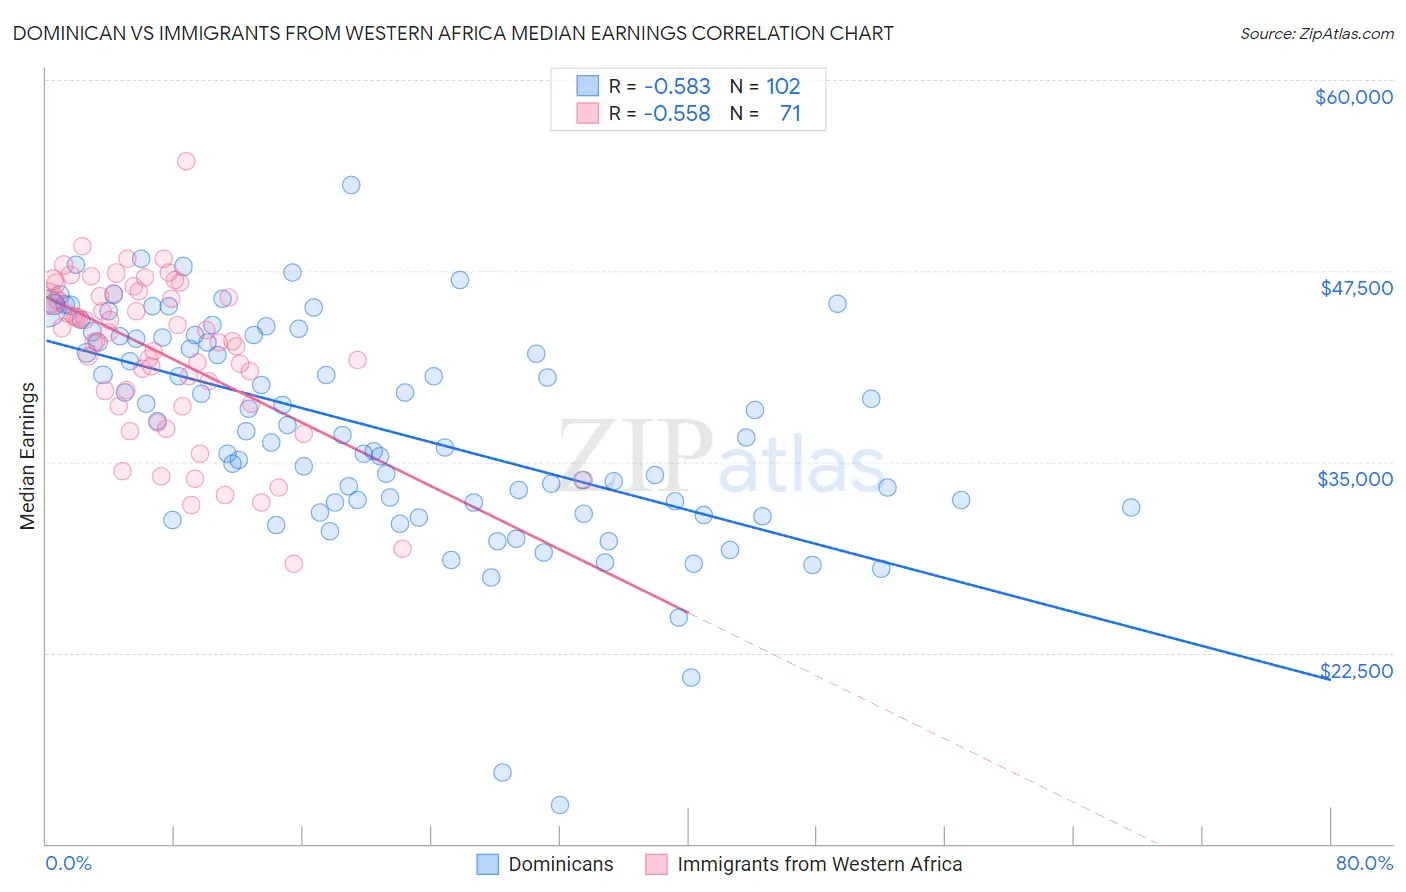
Dominican vs Immigrants from Western Africa Median Earnings Correlation Chart
The statistical analysis conducted on geographies consisting of 355,132,428 people shows a substantial negative correlation between the proportion of Dominicans and median earnings in the United States with a correlation coefficient (R) of -0.583 and weighted average of $41,864. Similarly, the statistical analysis conducted on geographies consisting of 357,863,895 people shows a substantial negative correlation between the proportion of Immigrants from Western Africa and median earnings in the United States with a correlation coefficient (R) of -0.558 and weighted average of $44,893, a difference of 7.2%.
Median Earnings Correlation Summary
| Measurement | Dominican | Immigrants from Western Africa |
| Minimum | $12,552 | $28,358 |
| Maximum | $53,134 | $54,719 |
| Range | $40,582 | $26,361 |
| Mean | $37,192 | $42,092 |
| Median | $37,213 | $42,904 |
| Interquartile 25% (IQ1) | $32,338 | $38,801 |
| Interquartile 75% (IQ3) | $43,235 | $45,834 |
| Interquartile Range (IQR) | $10,898 | $7,033 |
| Standard Deviation (Sample) | $7,182 | $5,206 |
| Standard Deviation (Population) | $7,146 | $5,170 |
Similar Demographics by Median Earnings
Demographics Similar to Dominicans by Median Earnings
In terms of median earnings, the demographic groups most similar to Dominicans are Blackfeet ($41,822, a difference of 0.10%), African ($41,955, a difference of 0.22%), Marshallese ($41,969, a difference of 0.25%), Immigrants from Nicaragua ($41,737, a difference of 0.31%), and Mexican American Indian ($41,719, a difference of 0.35%).
| Demographics | Rating | Rank | Median Earnings |
| Spanish Americans | 0.3 /100 | #276 | Tragic $42,316 |
| Central Americans | 0.3 /100 | #277 | Tragic $42,280 |
| Cajuns | 0.3 /100 | #278 | Tragic $42,189 |
| Colville | 0.2 /100 | #279 | Tragic $42,151 |
| Hmong | 0.2 /100 | #280 | Tragic $42,111 |
| Marshallese | 0.2 /100 | #281 | Tragic $41,969 |
| Africans | 0.2 /100 | #282 | Tragic $41,955 |
| Dominicans | 0.2 /100 | #283 | Tragic $41,864 |
| Blackfeet | 0.2 /100 | #284 | Tragic $41,822 |
| Immigrants | Nicaragua | 0.1 /100 | #285 | Tragic $41,737 |
| Mexican American Indians | 0.1 /100 | #286 | Tragic $41,719 |
| Indonesians | 0.1 /100 | #287 | Tragic $41,701 |
| Immigrants | Dominican Republic | 0.1 /100 | #288 | Tragic $41,554 |
| Comanche | 0.1 /100 | #289 | Tragic $41,519 |
| Paiute | 0.1 /100 | #290 | Tragic $41,508 |
Demographics Similar to Immigrants from Western Africa by Median Earnings
In terms of median earnings, the demographic groups most similar to Immigrants from Western Africa are Scotch-Irish ($44,924, a difference of 0.070%), Japanese ($44,825, a difference of 0.15%), Immigrants from Iraq ($44,988, a difference of 0.21%), Delaware ($44,783, a difference of 0.24%), and Immigrants from Sudan ($44,767, a difference of 0.28%).
| Demographics | Rating | Rank | Median Earnings |
| Whites/Caucasians | 15.0 /100 | #223 | Poor $45,197 |
| West Indians | 13.9 /100 | #224 | Poor $45,132 |
| Immigrants | Cambodia | 13.2 /100 | #225 | Poor $45,090 |
| Immigrants | Nigeria | 12.2 /100 | #226 | Poor $45,030 |
| Native Hawaiians | 12.2 /100 | #227 | Poor $45,027 |
| Immigrants | Iraq | 11.6 /100 | #228 | Poor $44,988 |
| Scotch-Irish | 10.7 /100 | #229 | Poor $44,924 |
| Immigrants | Western Africa | 10.3 /100 | #230 | Poor $44,893 |
| Japanese | 9.5 /100 | #231 | Tragic $44,825 |
| Delaware | 9.0 /100 | #232 | Tragic $44,783 |
| Immigrants | Sudan | 8.8 /100 | #233 | Tragic $44,767 |
| Cape Verdeans | 7.5 /100 | #234 | Tragic $44,640 |
| Venezuelans | 6.9 /100 | #235 | Tragic $44,580 |
| British West Indians | 6.7 /100 | #236 | Tragic $44,552 |
| Immigrants | Ecuador | 5.9 /100 | #237 | Tragic $44,462 |