Dominican vs Immigrants from Chile Wage/Income Gap
COMPARE
Dominican
Immigrants from Chile
Wage/Income Gap
Wage/Income Gap Comparison
Dominicans
Immigrants from Chile
20.6%
WAGE/INCOME GAP
100.0/ 100
METRIC RATING
24th/ 347
METRIC RANK
25.7%
WAGE/INCOME GAP
53.2/ 100
METRIC RATING
172nd/ 347
METRIC RANK
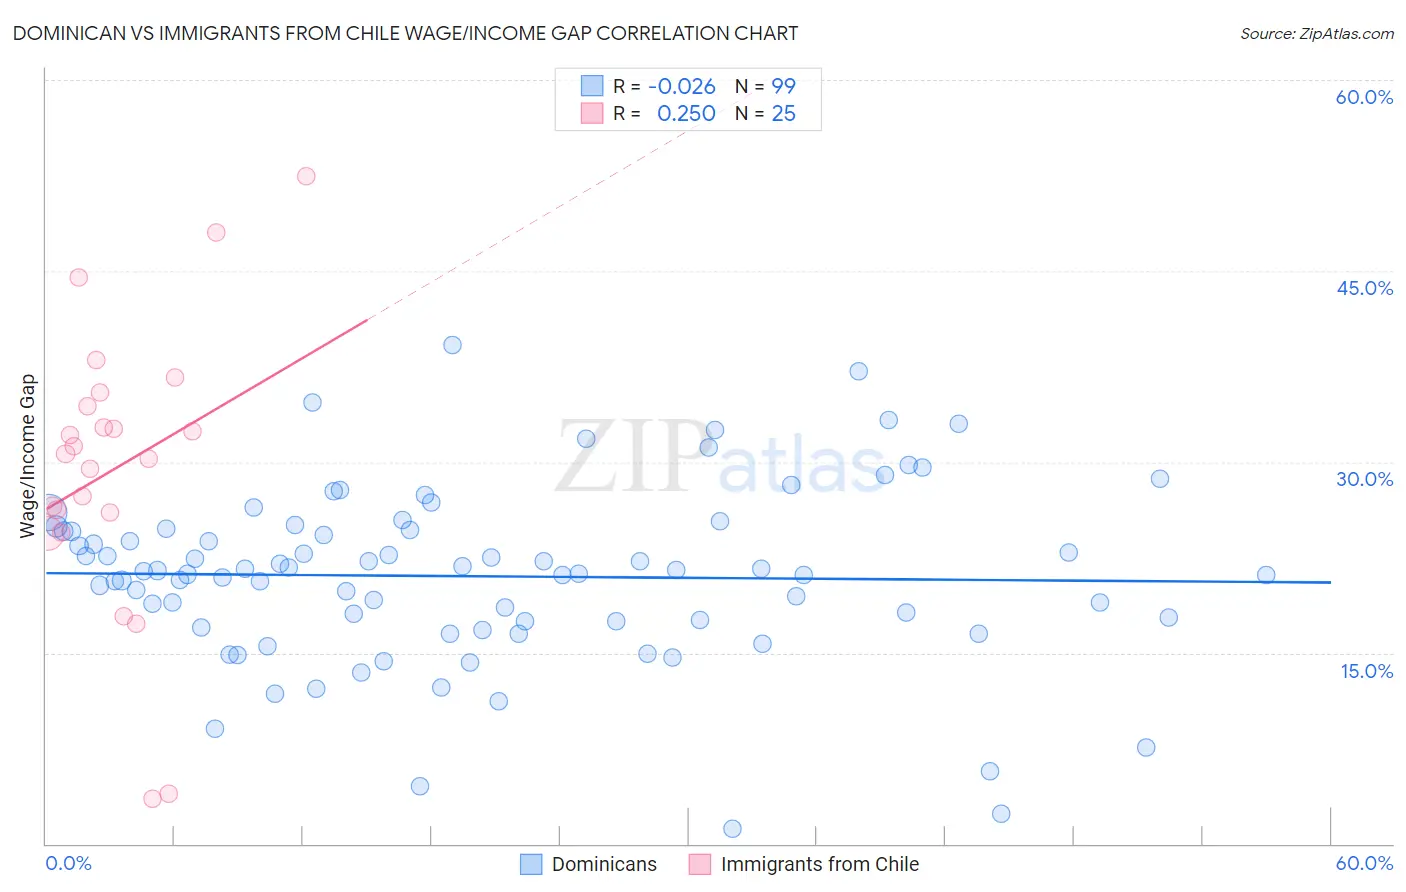
Dominican vs Immigrants from Chile Wage/Income Gap Correlation Chart
The statistical analysis conducted on geographies consisting of 354,862,114 people shows no correlation between the proportion of Dominicans and wage/income gap percentage in the United States with a correlation coefficient (R) of -0.026 and weighted average of 20.6%. Similarly, the statistical analysis conducted on geographies consisting of 218,595,517 people shows a weak positive correlation between the proportion of Immigrants from Chile and wage/income gap percentage in the United States with a correlation coefficient (R) of 0.250 and weighted average of 25.7%, a difference of 24.9%.
Wage/Income Gap Correlation Summary
| Measurement | Dominican | Immigrants from Chile |
| Minimum | 1.2% | 3.5% |
| Maximum | 39.2% | 52.4% |
| Range | 37.9% | 48.9% |
| Mean | 21.0% | 29.5% |
| Median | 21.4% | 30.7% |
| Interquartile 25% (IQ1) | 17.5% | 25.2% |
| Interquartile 75% (IQ3) | 24.7% | 34.9% |
| Interquartile Range (IQR) | 7.2% | 9.7% |
| Standard Deviation (Sample) | 6.9% | 11.2% |
| Standard Deviation (Population) | 6.8% | 11.0% |
Similar Demographics by Wage/Income Gap
Demographics Similar to Dominicans by Wage/Income Gap
In terms of wage/income gap, the demographic groups most similar to Dominicans are Immigrants from Dominican Republic (20.6%, a difference of 0.17%), Immigrants from Liberia (20.6%, a difference of 0.19%), Senegalese (20.7%, a difference of 0.30%), Pueblo (20.7%, a difference of 0.41%), and Immigrants from Armenia (20.7%, a difference of 0.62%).
| Demographics | Rating | Rank | Wage/Income Gap |
| Haitians | 100.0 /100 | #17 | Exceptional 19.7% |
| Hopi | 100.0 /100 | #18 | Exceptional 20.0% |
| Immigrants | Dominica | 100.0 /100 | #19 | Exceptional 20.0% |
| Bahamians | 100.0 /100 | #20 | Exceptional 20.2% |
| Immigrants | Caribbean | 100.0 /100 | #21 | Exceptional 20.4% |
| Immigrants | Liberia | 100.0 /100 | #22 | Exceptional 20.6% |
| Immigrants | Dominican Republic | 100.0 /100 | #23 | Exceptional 20.6% |
| Dominicans | 100.0 /100 | #24 | Exceptional 20.6% |
| Senegalese | 100.0 /100 | #25 | Exceptional 20.7% |
| Pueblo | 100.0 /100 | #26 | Exceptional 20.7% |
| Immigrants | Armenia | 100.0 /100 | #27 | Exceptional 20.7% |
| Inupiat | 100.0 /100 | #28 | Exceptional 20.8% |
| Immigrants | Senegal | 100.0 /100 | #29 | Exceptional 20.9% |
| Immigrants | Bangladesh | 100.0 /100 | #30 | Exceptional 20.9% |
| Vietnamese | 100.0 /100 | #31 | Exceptional 21.0% |
Demographics Similar to Immigrants from Chile by Wage/Income Gap
In terms of wage/income gap, the demographic groups most similar to Immigrants from Chile are Immigrants from Belarus (25.7%, a difference of 0.020%), Alaskan Athabascan (25.8%, a difference of 0.21%), Immigrants from Greece (25.7%, a difference of 0.22%), Immigrants from Oceania (25.6%, a difference of 0.28%), and Sri Lankan (25.8%, a difference of 0.41%).
| Demographics | Rating | Rank | Wage/Income Gap |
| Immigrants | Hong Kong | 64.0 /100 | #165 | Good 25.5% |
| Immigrants | Ukraine | 63.8 /100 | #166 | Good 25.5% |
| Paiute | 62.9 /100 | #167 | Good 25.5% |
| Seminole | 62.6 /100 | #168 | Good 25.6% |
| Peruvians | 60.1 /100 | #169 | Good 25.6% |
| Immigrants | Oceania | 57.5 /100 | #170 | Average 25.6% |
| Immigrants | Greece | 56.6 /100 | #171 | Average 25.7% |
| Immigrants | Chile | 53.2 /100 | #172 | Average 25.7% |
| Immigrants | Belarus | 52.9 /100 | #173 | Average 25.7% |
| Alaskan Athabascans | 50.0 /100 | #174 | Average 25.8% |
| Sri Lankans | 47.0 /100 | #175 | Average 25.8% |
| Paraguayans | 46.7 /100 | #176 | Average 25.8% |
| Cambodians | 45.1 /100 | #177 | Average 25.8% |
| Chinese | 42.0 /100 | #178 | Average 25.9% |
| Samoans | 38.6 /100 | #179 | Fair 26.0% |