Cree vs Uruguayan Median Female Earnings
COMPARE
Cree
Uruguayan
Median Female Earnings
Median Female Earnings Comparison
Cree
Uruguayans
$37,018
MEDIAN FEMALE EARNINGS
0.4/ 100
METRIC RATING
268th/ 347
METRIC RANK
$39,228
MEDIAN FEMALE EARNINGS
27.3/ 100
METRIC RATING
195th/ 347
METRIC RANK
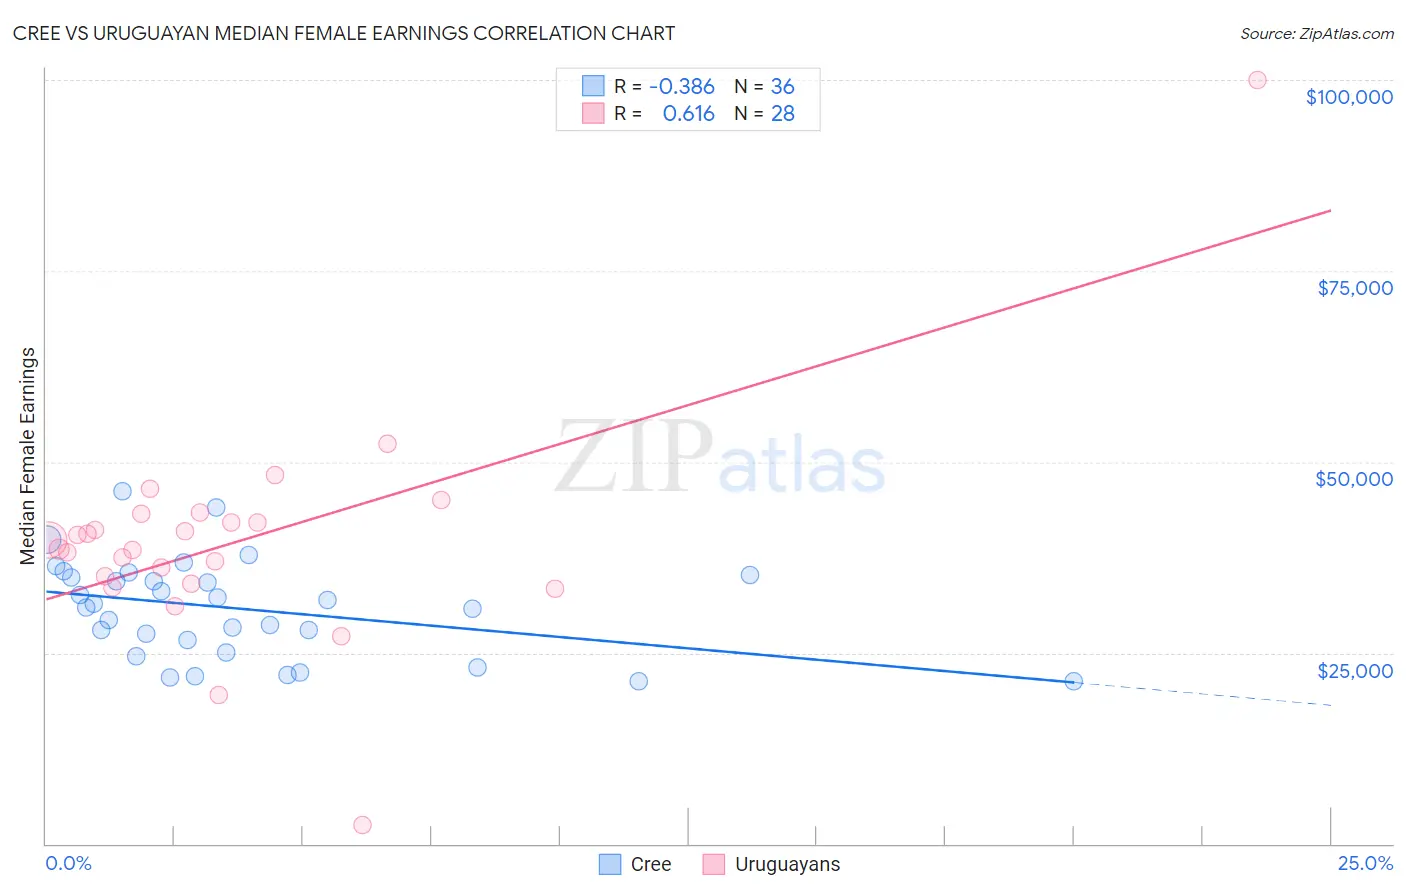
Cree vs Uruguayan Median Female Earnings Correlation Chart
The statistical analysis conducted on geographies consisting of 76,188,527 people shows a mild negative correlation between the proportion of Cree and median female earnings in the United States with a correlation coefficient (R) of -0.386 and weighted average of $37,018. Similarly, the statistical analysis conducted on geographies consisting of 144,779,017 people shows a significant positive correlation between the proportion of Uruguayans and median female earnings in the United States with a correlation coefficient (R) of 0.616 and weighted average of $39,228, a difference of 6.0%.
Median Female Earnings Correlation Summary
| Measurement | Cree | Uruguayan |
| Minimum | $21,250 | $2,499 |
| Maximum | $46,168 | $100,000 |
| Range | $24,918 | $97,501 |
| Mean | $30,765 | $39,566 |
| Median | $31,124 | $39,168 |
| Interquartile 25% (IQ1) | $25,810 | $34,578 |
| Interquartile 75% (IQ3) | $35,030 | $42,658 |
| Interquartile Range (IQR) | $9,221 | $8,081 |
| Standard Deviation (Sample) | $6,370 | $15,119 |
| Standard Deviation (Population) | $6,281 | $14,847 |
Similar Demographics by Median Female Earnings
Demographics Similar to Cree by Median Female Earnings
In terms of median female earnings, the demographic groups most similar to Cree are Nonimmigrants ($37,024, a difference of 0.010%), Immigrants from Venezuela ($37,003, a difference of 0.040%), Dominican ($37,046, a difference of 0.070%), Immigrants from Belize ($37,056, a difference of 0.10%), and Salvadoran ($37,083, a difference of 0.18%).
| Demographics | Rating | Rank | Median Female Earnings |
| Malaysians | 0.7 /100 | #261 | Tragic $37,298 |
| Venezuelans | 0.7 /100 | #262 | Tragic $37,282 |
| German Russians | 0.5 /100 | #263 | Tragic $37,105 |
| Salvadorans | 0.4 /100 | #264 | Tragic $37,083 |
| Immigrants | Belize | 0.4 /100 | #265 | Tragic $37,056 |
| Dominicans | 0.4 /100 | #266 | Tragic $37,046 |
| Immigrants | Nonimmigrants | 0.4 /100 | #267 | Tragic $37,024 |
| Cree | 0.4 /100 | #268 | Tragic $37,018 |
| Immigrants | Venezuela | 0.4 /100 | #269 | Tragic $37,003 |
| French American Indians | 0.3 /100 | #270 | Tragic $36,920 |
| Nicaraguans | 0.3 /100 | #271 | Tragic $36,904 |
| Immigrants | Dominican Republic | 0.3 /100 | #272 | Tragic $36,857 |
| Immigrants | Laos | 0.3 /100 | #273 | Tragic $36,841 |
| Immigrants | El Salvador | 0.2 /100 | #274 | Tragic $36,673 |
| Africans | 0.1 /100 | #275 | Tragic $36,530 |
Demographics Similar to Uruguayans by Median Female Earnings
In terms of median female earnings, the demographic groups most similar to Uruguayans are Immigrants from Costa Rica ($39,186, a difference of 0.11%), Irish ($39,291, a difference of 0.16%), Immigrants from Nigeria ($39,294, a difference of 0.17%), Assyrian/Chaldean/Syriac ($39,159, a difference of 0.17%), and Immigrants ($39,328, a difference of 0.26%).
| Demographics | Rating | Rank | Median Female Earnings |
| Bermudans | 35.9 /100 | #188 | Fair $39,418 |
| Senegalese | 34.2 /100 | #189 | Fair $39,384 |
| Puget Sound Salish | 33.9 /100 | #190 | Fair $39,376 |
| Immigrants | Western Africa | 32.7 /100 | #191 | Fair $39,351 |
| Immigrants | Immigrants | 31.7 /100 | #192 | Fair $39,328 |
| Immigrants | Nigeria | 30.2 /100 | #193 | Fair $39,294 |
| Irish | 30.0 /100 | #194 | Fair $39,291 |
| Uruguayans | 27.3 /100 | #195 | Fair $39,228 |
| Immigrants | Costa Rica | 25.6 /100 | #196 | Fair $39,186 |
| Assyrians/Chaldeans/Syriacs | 24.6 /100 | #197 | Fair $39,159 |
| Ecuadorians | 23.0 /100 | #198 | Fair $39,117 |
| Icelanders | 22.7 /100 | #199 | Fair $39,109 |
| Immigrants | Panama | 20.6 /100 | #200 | Fair $39,049 |
| Panamanians | 20.6 /100 | #201 | Fair $39,049 |
| Slovaks | 19.9 /100 | #202 | Poor $39,029 |