Cree vs Immigrants from Kazakhstan Median Female Earnings
COMPARE
Cree
Immigrants from Kazakhstan
Median Female Earnings
Median Female Earnings Comparison
Cree
Immigrants from Kazakhstan
$37,018
MEDIAN FEMALE EARNINGS
0.4/ 100
METRIC RATING
268th/ 347
METRIC RANK
$42,386
MEDIAN FEMALE EARNINGS
99.6/ 100
METRIC RATING
78th/ 347
METRIC RANK
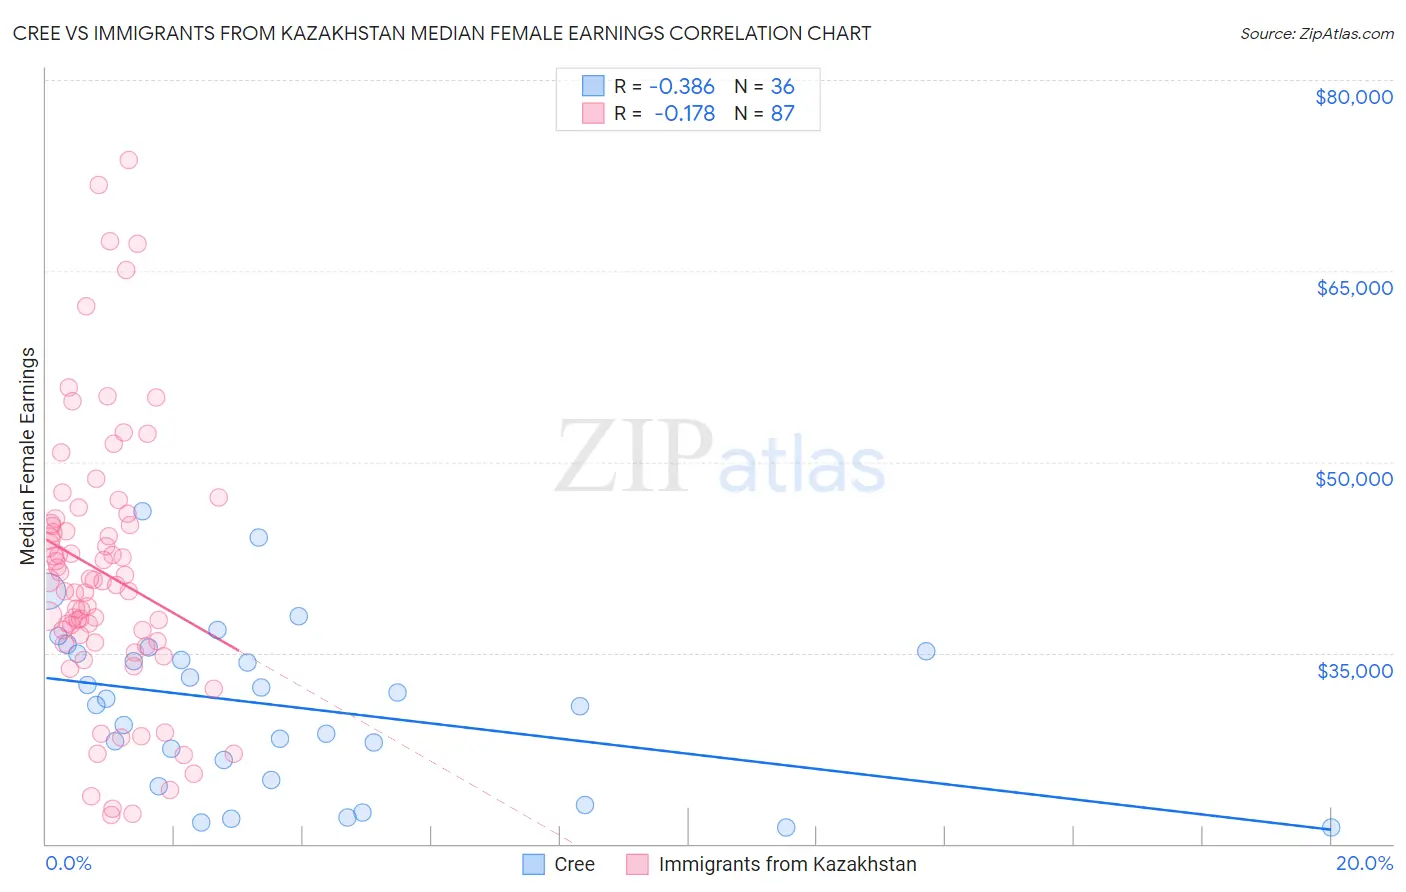
Cree vs Immigrants from Kazakhstan Median Female Earnings Correlation Chart
The statistical analysis conducted on geographies consisting of 76,188,527 people shows a mild negative correlation between the proportion of Cree and median female earnings in the United States with a correlation coefficient (R) of -0.386 and weighted average of $37,018. Similarly, the statistical analysis conducted on geographies consisting of 124,420,092 people shows a poor negative correlation between the proportion of Immigrants from Kazakhstan and median female earnings in the United States with a correlation coefficient (R) of -0.178 and weighted average of $42,386, a difference of 14.5%.
Median Female Earnings Correlation Summary
| Measurement | Cree | Immigrants from Kazakhstan |
| Minimum | $21,250 | $22,250 |
| Maximum | $46,168 | $73,684 |
| Range | $24,918 | $51,434 |
| Mean | $30,765 | $41,300 |
| Median | $31,124 | $40,614 |
| Interquartile 25% (IQ1) | $25,810 | $35,762 |
| Interquartile 75% (IQ3) | $35,030 | $45,166 |
| Interquartile Range (IQR) | $9,221 | $9,404 |
| Standard Deviation (Sample) | $6,370 | $10,623 |
| Standard Deviation (Population) | $6,281 | $10,562 |
Similar Demographics by Median Female Earnings
Demographics Similar to Cree by Median Female Earnings
In terms of median female earnings, the demographic groups most similar to Cree are Nonimmigrants ($37,024, a difference of 0.010%), Immigrants from Venezuela ($37,003, a difference of 0.040%), Dominican ($37,046, a difference of 0.070%), Immigrants from Belize ($37,056, a difference of 0.10%), and Salvadoran ($37,083, a difference of 0.18%).
| Demographics | Rating | Rank | Median Female Earnings |
| Malaysians | 0.7 /100 | #261 | Tragic $37,298 |
| Venezuelans | 0.7 /100 | #262 | Tragic $37,282 |
| German Russians | 0.5 /100 | #263 | Tragic $37,105 |
| Salvadorans | 0.4 /100 | #264 | Tragic $37,083 |
| Immigrants | Belize | 0.4 /100 | #265 | Tragic $37,056 |
| Dominicans | 0.4 /100 | #266 | Tragic $37,046 |
| Immigrants | Nonimmigrants | 0.4 /100 | #267 | Tragic $37,024 |
| Cree | 0.4 /100 | #268 | Tragic $37,018 |
| Immigrants | Venezuela | 0.4 /100 | #269 | Tragic $37,003 |
| French American Indians | 0.3 /100 | #270 | Tragic $36,920 |
| Nicaraguans | 0.3 /100 | #271 | Tragic $36,904 |
| Immigrants | Dominican Republic | 0.3 /100 | #272 | Tragic $36,857 |
| Immigrants | Laos | 0.3 /100 | #273 | Tragic $36,841 |
| Immigrants | El Salvador | 0.2 /100 | #274 | Tragic $36,673 |
| Africans | 0.1 /100 | #275 | Tragic $36,530 |
Demographics Similar to Immigrants from Kazakhstan by Median Female Earnings
In terms of median female earnings, the demographic groups most similar to Immigrants from Kazakhstan are Immigrants from Albania ($42,388, a difference of 0.0%), Greek ($42,336, a difference of 0.12%), New Zealander ($42,446, a difference of 0.14%), Immigrants from Italy ($42,446, a difference of 0.14%), and Immigrants from Moldova ($42,304, a difference of 0.19%).
| Demographics | Rating | Rank | Median Female Earnings |
| Immigrants | Romania | 99.8 /100 | #71 | Exceptional $42,718 |
| Albanians | 99.8 /100 | #72 | Exceptional $42,584 |
| Mongolians | 99.7 /100 | #73 | Exceptional $42,542 |
| Immigrants | South Africa | 99.7 /100 | #74 | Exceptional $42,508 |
| New Zealanders | 99.7 /100 | #75 | Exceptional $42,446 |
| Immigrants | Italy | 99.7 /100 | #76 | Exceptional $42,446 |
| Immigrants | Albania | 99.6 /100 | #77 | Exceptional $42,388 |
| Immigrants | Kazakhstan | 99.6 /100 | #78 | Exceptional $42,386 |
| Greeks | 99.6 /100 | #79 | Exceptional $42,336 |
| Immigrants | Moldova | 99.6 /100 | #80 | Exceptional $42,304 |
| Immigrants | Southern Europe | 99.5 /100 | #81 | Exceptional $42,275 |
| Immigrants | Morocco | 99.5 /100 | #82 | Exceptional $42,229 |
| Immigrants | Sierra Leone | 99.5 /100 | #83 | Exceptional $42,214 |
| Armenians | 99.5 /100 | #84 | Exceptional $42,212 |
| Laotians | 99.4 /100 | #85 | Exceptional $42,133 |