Chinese vs Nepalese Median Family Income
COMPARE
Chinese
Nepalese
Median Family Income
Median Family Income Comparison
Chinese
Nepalese
$116,188
MEDIAN FAMILY INCOME
99.9/ 100
METRIC RATING
49th/ 347
METRIC RANK
$94,153
MEDIAN FAMILY INCOME
1.3/ 100
METRIC RATING
238th/ 347
METRIC RANK
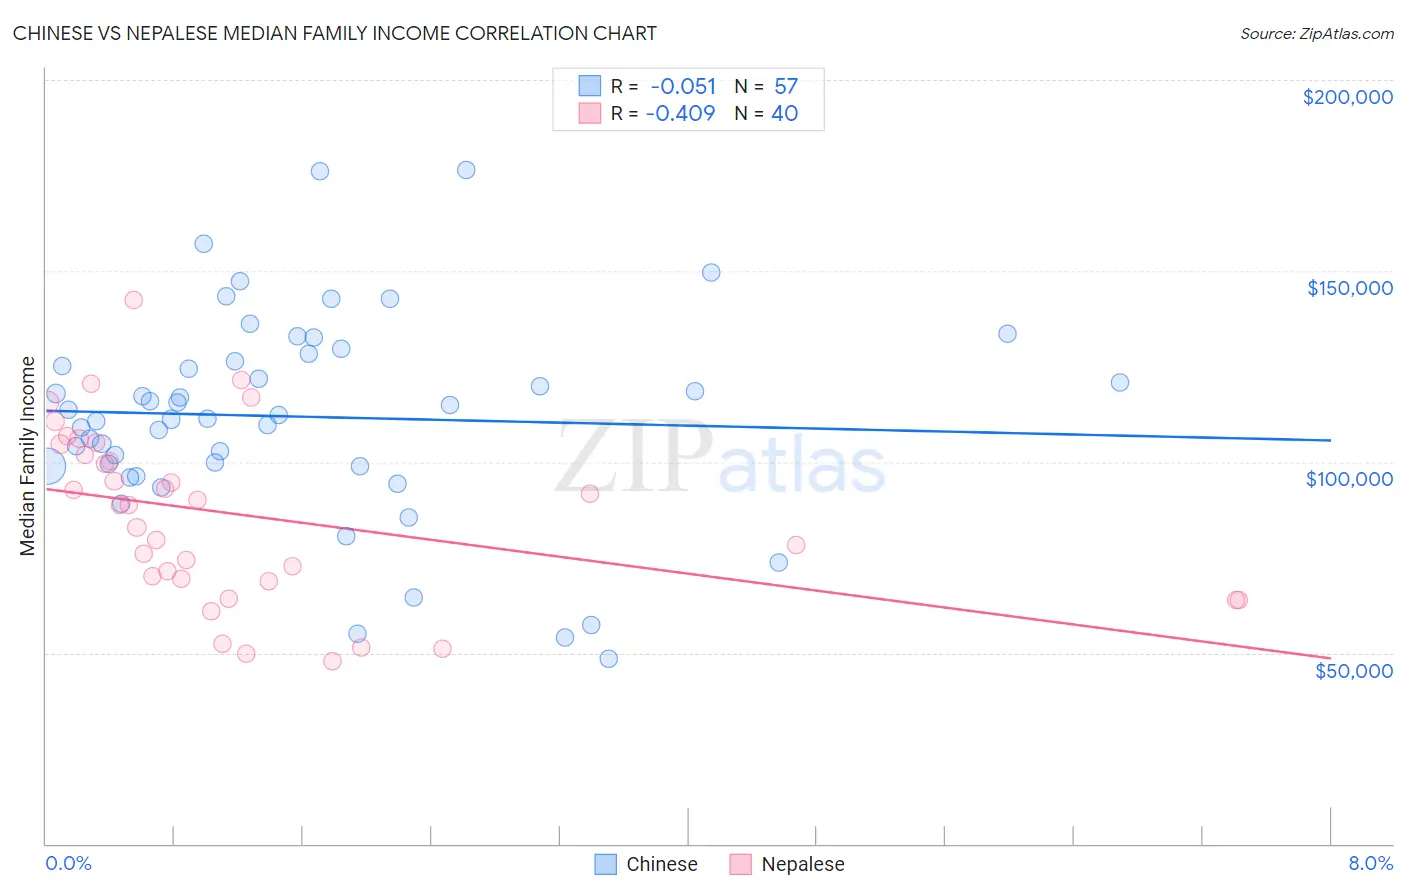
Chinese vs Nepalese Median Family Income Correlation Chart
The statistical analysis conducted on geographies consisting of 64,799,903 people shows a slight negative correlation between the proportion of Chinese and median family income in the United States with a correlation coefficient (R) of -0.051 and weighted average of $116,188. Similarly, the statistical analysis conducted on geographies consisting of 24,521,755 people shows a moderate negative correlation between the proportion of Nepalese and median family income in the United States with a correlation coefficient (R) of -0.409 and weighted average of $94,153, a difference of 23.4%.
Median Family Income Correlation Summary
| Measurement | Chinese | Nepalese |
| Minimum | $48,295 | $47,952 |
| Maximum | $176,564 | $142,416 |
| Range | $128,269 | $94,464 |
| Mean | $111,811 | $85,857 |
| Median | $112,252 | $88,639 |
| Interquartile 25% (IQ1) | $98,862 | $68,953 |
| Interquartile 75% (IQ3) | $127,363 | $103,204 |
| Interquartile Range (IQR) | $28,501 | $34,251 |
| Standard Deviation (Sample) | $27,086 | $22,971 |
| Standard Deviation (Population) | $26,847 | $22,682 |
Similar Demographics by Median Family Income
Demographics Similar to Chinese by Median Family Income
In terms of median family income, the demographic groups most similar to Chinese are Immigrants from Czechoslovakia ($116,165, a difference of 0.020%), Immigrants from South Africa ($116,286, a difference of 0.080%), Immigrants from Malaysia ($115,880, a difference of 0.27%), Maltese ($115,862, a difference of 0.28%), and Immigrants from Norway ($115,847, a difference of 0.29%).
| Demographics | Rating | Rank | Median Family Income |
| Immigrants | Bolivia | 100.0 /100 | #42 | Exceptional $117,912 |
| Bulgarians | 100.0 /100 | #43 | Exceptional $117,818 |
| Cambodians | 100.0 /100 | #44 | Exceptional $117,780 |
| Immigrants | Greece | 99.9 /100 | #45 | Exceptional $117,344 |
| Immigrants | Russia | 99.9 /100 | #46 | Exceptional $116,942 |
| Immigrants | Austria | 99.9 /100 | #47 | Exceptional $116,830 |
| Immigrants | South Africa | 99.9 /100 | #48 | Exceptional $116,286 |
| Chinese | 99.9 /100 | #49 | Exceptional $116,188 |
| Immigrants | Czechoslovakia | 99.9 /100 | #50 | Exceptional $116,165 |
| Immigrants | Malaysia | 99.9 /100 | #51 | Exceptional $115,880 |
| Maltese | 99.9 /100 | #52 | Exceptional $115,862 |
| Immigrants | Norway | 99.9 /100 | #53 | Exceptional $115,847 |
| Immigrants | Europe | 99.9 /100 | #54 | Exceptional $115,523 |
| Lithuanians | 99.8 /100 | #55 | Exceptional $115,395 |
| New Zealanders | 99.8 /100 | #56 | Exceptional $115,230 |
Demographics Similar to Nepalese by Median Family Income
In terms of median family income, the demographic groups most similar to Nepalese are Salvadoran ($94,109, a difference of 0.050%), Somali ($94,085, a difference of 0.070%), Immigrants from Trinidad and Tobago ($93,988, a difference of 0.17%), Barbadian ($93,919, a difference of 0.25%), and Alaskan Athabascan ($94,429, a difference of 0.29%).
| Demographics | Rating | Rank | Median Family Income |
| Ecuadorians | 2.1 /100 | #231 | Tragic $95,114 |
| Immigrants | Venezuela | 1.9 /100 | #232 | Tragic $94,904 |
| Immigrants | Bangladesh | 1.6 /100 | #233 | Tragic $94,665 |
| Immigrants | Western Africa | 1.6 /100 | #234 | Tragic $94,638 |
| Immigrants | Burma/Myanmar | 1.5 /100 | #235 | Tragic $94,472 |
| Trinidadians and Tobagonians | 1.5 /100 | #236 | Tragic $94,466 |
| Alaskan Athabascans | 1.5 /100 | #237 | Tragic $94,429 |
| Nepalese | 1.3 /100 | #238 | Tragic $94,153 |
| Salvadorans | 1.2 /100 | #239 | Tragic $94,109 |
| Somalis | 1.2 /100 | #240 | Tragic $94,085 |
| Immigrants | Trinidad and Tobago | 1.2 /100 | #241 | Tragic $93,988 |
| Barbadians | 1.1 /100 | #242 | Tragic $93,919 |
| German Russians | 1.1 /100 | #243 | Tragic $93,858 |
| Sub-Saharan Africans | 1.0 /100 | #244 | Tragic $93,748 |
| Immigrants | Middle Africa | 1.0 /100 | #245 | Tragic $93,593 |