Carpatho Rusyn vs Immigrants from Northern Africa Per Capita Income
COMPARE
Carpatho Rusyn
Immigrants from Northern Africa
Per Capita Income
Per Capita Income Comparison
Carpatho Rusyns
Immigrants from Northern Africa
$47,248
PER CAPITA INCOME
98.2/ 100
METRIC RATING
97th/ 347
METRIC RANK
$46,531
PER CAPITA INCOME
96.2/ 100
METRIC RATING
109th/ 347
METRIC RANK
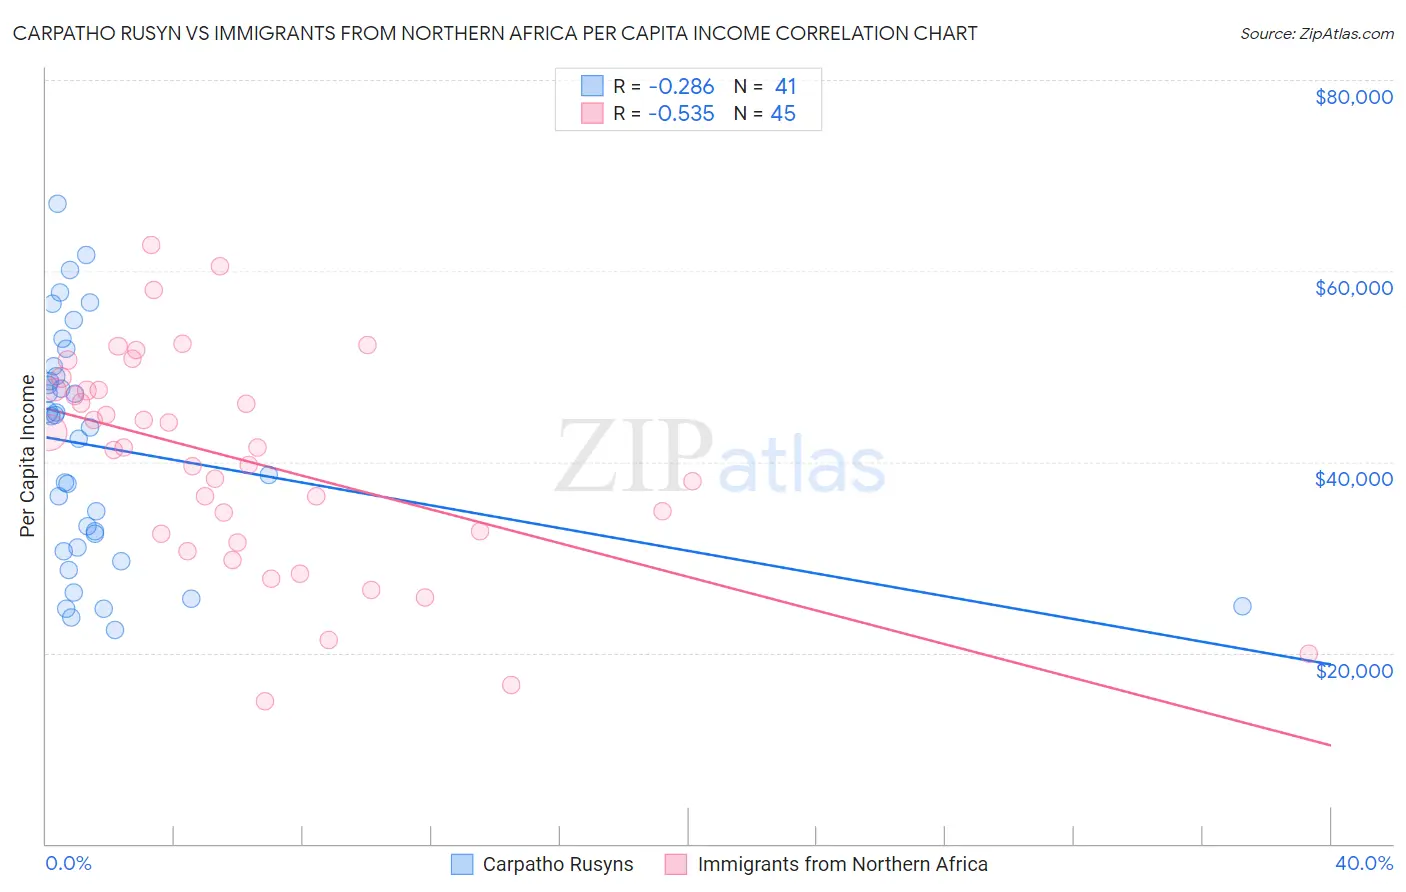
Carpatho Rusyn vs Immigrants from Northern Africa Per Capita Income Correlation Chart
The statistical analysis conducted on geographies consisting of 58,866,831 people shows a weak negative correlation between the proportion of Carpatho Rusyns and per capita income in the United States with a correlation coefficient (R) of -0.286 and weighted average of $47,248. Similarly, the statistical analysis conducted on geographies consisting of 321,207,992 people shows a substantial negative correlation between the proportion of Immigrants from Northern Africa and per capita income in the United States with a correlation coefficient (R) of -0.535 and weighted average of $46,531, a difference of 1.5%.
Per Capita Income Correlation Summary
| Measurement | Carpatho Rusyn | Immigrants from Northern Africa |
| Minimum | $22,343 | $14,939 |
| Maximum | $67,093 | $62,708 |
| Range | $44,750 | $47,769 |
| Mean | $41,437 | $40,067 |
| Median | $43,602 | $41,480 |
| Interquartile 25% (IQ1) | $30,789 | $32,060 |
| Interquartile 75% (IQ3) | $49,474 | $47,546 |
| Interquartile Range (IQR) | $18,684 | $15,486 |
| Standard Deviation (Sample) | $12,046 | $11,278 |
| Standard Deviation (Population) | $11,898 | $11,152 |
Demographics Similar to Carpatho Rusyns and Immigrants from Northern Africa by Per Capita Income
In terms of per capita income, the demographic groups most similar to Carpatho Rusyns are Alsatian ($47,284, a difference of 0.080%), Immigrants from Egypt ($47,361, a difference of 0.24%), Albanian ($47,379, a difference of 0.28%), Immigrants from Zimbabwe ($47,394, a difference of 0.31%), and Immigrants from Pakistan ($47,084, a difference of 0.35%). Similarly, the demographic groups most similar to Immigrants from Northern Africa are Immigrants from Kuwait ($46,543, a difference of 0.030%), Serbian ($46,551, a difference of 0.040%), Ethiopian ($46,569, a difference of 0.080%), British ($46,571, a difference of 0.090%), and Chilean ($46,459, a difference of 0.15%).
| Demographics | Rating | Rank | Per Capita Income |
| Immigrants | Zimbabwe | 98.5 /100 | #93 | Exceptional $47,394 |
| Albanians | 98.5 /100 | #94 | Exceptional $47,379 |
| Immigrants | Egypt | 98.5 /100 | #95 | Exceptional $47,361 |
| Alsatians | 98.3 /100 | #96 | Exceptional $47,284 |
| Carpatho Rusyns | 98.2 /100 | #97 | Exceptional $47,248 |
| Immigrants | Pakistan | 97.9 /100 | #98 | Exceptional $47,084 |
| Laotians | 97.8 /100 | #99 | Exceptional $47,041 |
| Immigrants | Lebanon | 97.5 /100 | #100 | Exceptional $46,938 |
| Immigrants | Uzbekistan | 97.5 /100 | #101 | Exceptional $46,929 |
| Immigrants | Western Asia | 97.4 /100 | #102 | Exceptional $46,876 |
| Syrians | 97.2 /100 | #103 | Exceptional $46,837 |
| Brazilians | 96.8 /100 | #104 | Exceptional $46,700 |
| British | 96.3 /100 | #105 | Exceptional $46,571 |
| Ethiopians | 96.3 /100 | #106 | Exceptional $46,569 |
| Serbians | 96.2 /100 | #107 | Exceptional $46,551 |
| Immigrants | Kuwait | 96.2 /100 | #108 | Exceptional $46,543 |
| Immigrants | Northern Africa | 96.2 /100 | #109 | Exceptional $46,531 |
| Chileans | 95.9 /100 | #110 | Exceptional $46,459 |
| Taiwanese | 95.8 /100 | #111 | Exceptional $46,455 |
| Immigrants | Morocco | 95.7 /100 | #112 | Exceptional $46,430 |
| Immigrants | Albania | 95.5 /100 | #113 | Exceptional $46,387 |