Canadian vs White/Caucasian Median Family Income
COMPARE
Canadian
White/Caucasian
Median Family Income
Median Family Income Comparison
Canadians
Whites/Caucasians
$106,597
MEDIAN FAMILY INCOME
88.1/ 100
METRIC RATING
131st/ 347
METRIC RANK
$99,800
MEDIAN FAMILY INCOME
18.7/ 100
METRIC RATING
202nd/ 347
METRIC RANK
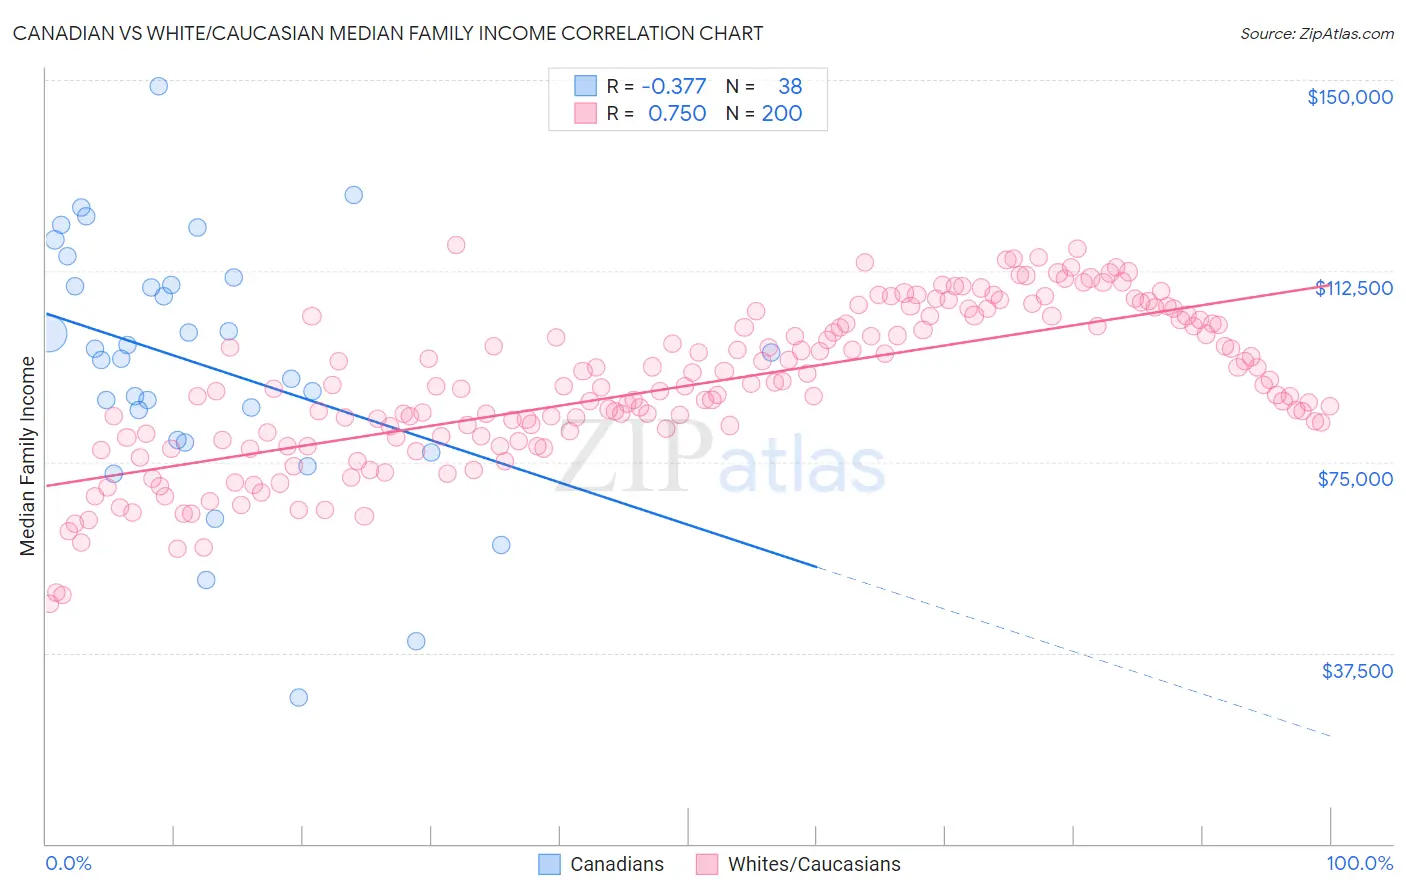
Canadian vs White/Caucasian Median Family Income Correlation Chart
The statistical analysis conducted on geographies consisting of 437,117,064 people shows a mild negative correlation between the proportion of Canadians and median family income in the United States with a correlation coefficient (R) of -0.377 and weighted average of $106,597. Similarly, the statistical analysis conducted on geographies consisting of 582,814,142 people shows a strong positive correlation between the proportion of Whites/Caucasians and median family income in the United States with a correlation coefficient (R) of 0.750 and weighted average of $99,800, a difference of 6.8%.
Median Family Income Correlation Summary
| Measurement | Canadian | White/Caucasian |
| Minimum | $28,715 | $47,087 |
| Maximum | $148,748 | $117,539 |
| Range | $120,033 | $70,452 |
| Mean | $93,902 | $89,997 |
| Median | $95,805 | $89,813 |
| Interquartile 25% (IQ1) | $79,333 | $80,036 |
| Interquartile 75% (IQ3) | $109,797 | $102,904 |
| Interquartile Range (IQR) | $30,464 | $22,868 |
| Standard Deviation (Sample) | $24,866 | $15,237 |
| Standard Deviation (Population) | $24,537 | $15,199 |
Similar Demographics by Median Family Income
Demographics Similar to Canadians by Median Family Income
In terms of median family income, the demographic groups most similar to Canadians are Immigrants from Fiji ($106,544, a difference of 0.050%), Ugandan ($106,541, a difference of 0.050%), Immigrants from Oceania ($106,453, a difference of 0.14%), Portuguese ($106,286, a difference of 0.29%), and Brazilian ($106,942, a difference of 0.32%).
| Demographics | Rating | Rank | Median Family Income |
| Pakistanis | 91.7 /100 | #124 | Exceptional $107,390 |
| Taiwanese | 91.4 /100 | #125 | Exceptional $107,295 |
| Serbians | 90.8 /100 | #126 | Exceptional $107,157 |
| Lebanese | 90.5 /100 | #127 | Exceptional $107,086 |
| Immigrants | Ethiopia | 90.0 /100 | #128 | Excellent $106,969 |
| Arabs | 89.9 /100 | #129 | Excellent $106,952 |
| Brazilians | 89.8 /100 | #130 | Excellent $106,942 |
| Canadians | 88.1 /100 | #131 | Excellent $106,597 |
| Immigrants | Fiji | 87.8 /100 | #132 | Excellent $106,544 |
| Ugandans | 87.8 /100 | #133 | Excellent $106,541 |
| Immigrants | Oceania | 87.3 /100 | #134 | Excellent $106,453 |
| Portuguese | 86.3 /100 | #135 | Excellent $106,286 |
| Immigrants | South Eastern Asia | 86.1 /100 | #136 | Excellent $106,252 |
| Immigrants | Uganda | 85.7 /100 | #137 | Excellent $106,188 |
| Immigrants | Vietnam | 85.7 /100 | #138 | Excellent $106,186 |
Demographics Similar to Whites/Caucasians by Median Family Income
In terms of median family income, the demographic groups most similar to Whites/Caucasians are Immigrants from Thailand ($99,840, a difference of 0.040%), Spanish ($99,977, a difference of 0.18%), Scotch-Irish ($99,591, a difference of 0.21%), Yugoslavian ($100,119, a difference of 0.32%), and Immigrants from Africa ($100,256, a difference of 0.46%).
| Demographics | Rating | Rank | Median Family Income |
| Immigrants | South America | 23.9 /100 | #195 | Fair $100,414 |
| Samoans | 23.3 /100 | #196 | Fair $100,344 |
| Immigrants | Cameroon | 22.8 /100 | #197 | Fair $100,289 |
| Immigrants | Africa | 22.5 /100 | #198 | Fair $100,256 |
| Yugoslavians | 21.3 /100 | #199 | Fair $100,119 |
| Spanish | 20.1 /100 | #200 | Fair $99,977 |
| Immigrants | Thailand | 19.0 /100 | #201 | Poor $99,840 |
| Whites/Caucasians | 18.7 /100 | #202 | Poor $99,800 |
| Scotch-Irish | 17.1 /100 | #203 | Poor $99,591 |
| Ghanaians | 12.6 /100 | #204 | Poor $98,877 |
| Hawaiians | 12.5 /100 | #205 | Poor $98,869 |
| Immigrants | Iraq | 12.1 /100 | #206 | Poor $98,786 |
| Aleuts | 11.6 /100 | #207 | Poor $98,702 |
| Immigrants | Uruguay | 9.2 /100 | #208 | Tragic $98,205 |
| Immigrants | Colombia | 8.7 /100 | #209 | Tragic $98,067 |