Canadian vs Estonian Median Family Income
COMPARE
Canadian
Estonian
Median Family Income
Median Family Income Comparison
Canadians
Estonians
$106,597
MEDIAN FAMILY INCOME
88.1/ 100
METRIC RATING
131st/ 347
METRIC RANK
$118,013
MEDIAN FAMILY INCOME
100.0/ 100
METRIC RATING
41st/ 347
METRIC RANK
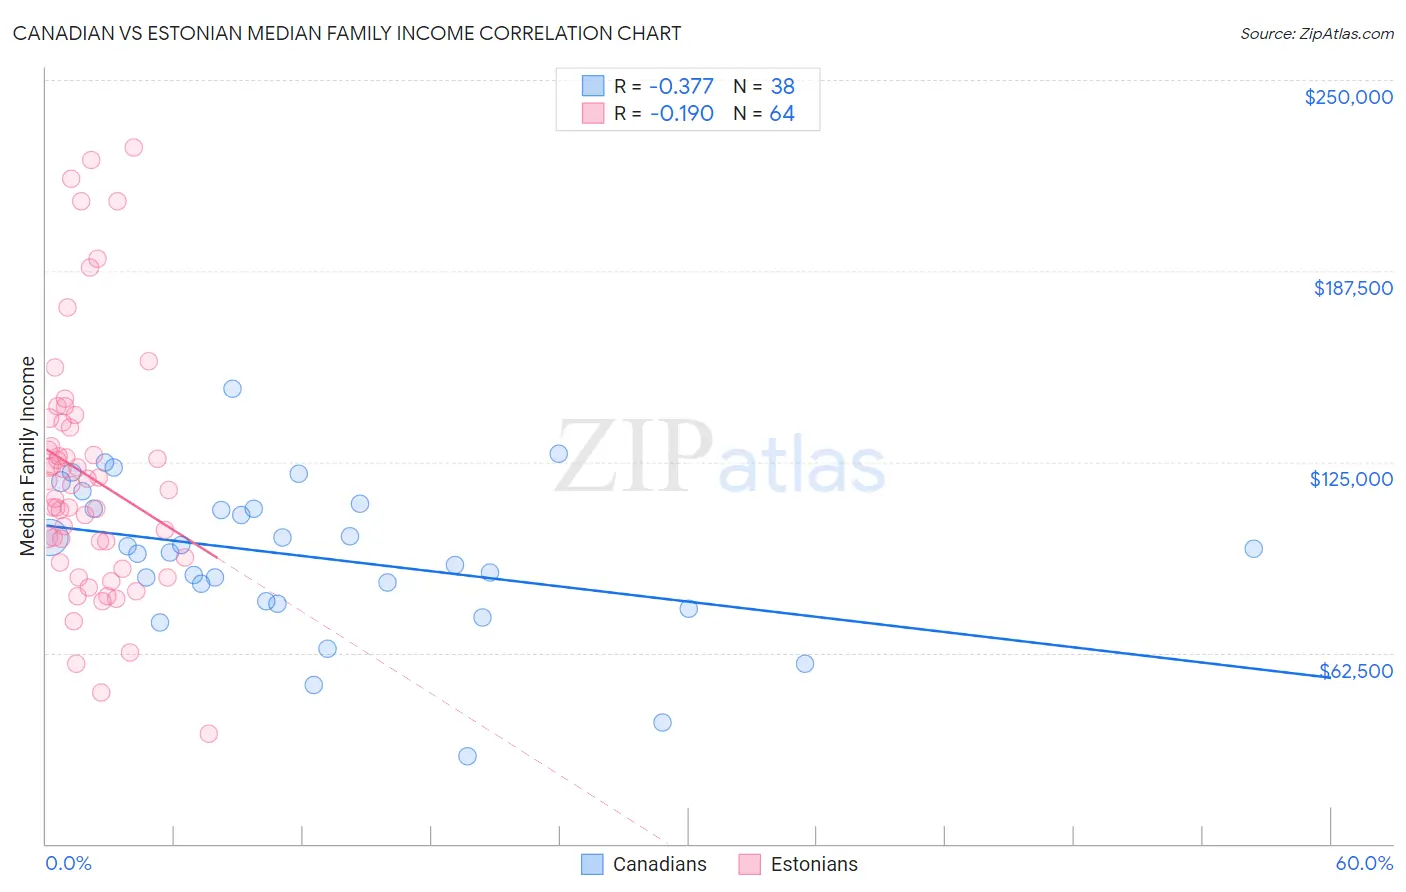
Canadian vs Estonian Median Family Income Correlation Chart
The statistical analysis conducted on geographies consisting of 437,117,064 people shows a mild negative correlation between the proportion of Canadians and median family income in the United States with a correlation coefficient (R) of -0.377 and weighted average of $106,597. Similarly, the statistical analysis conducted on geographies consisting of 123,476,939 people shows a poor negative correlation between the proportion of Estonians and median family income in the United States with a correlation coefficient (R) of -0.190 and weighted average of $118,013, a difference of 10.7%.
Median Family Income Correlation Summary
| Measurement | Canadian | Estonian |
| Minimum | $28,715 | $35,938 |
| Maximum | $148,748 | $228,043 |
| Range | $120,033 | $192,105 |
| Mean | $93,902 | $120,304 |
| Median | $95,805 | $116,733 |
| Interquartile 25% (IQ1) | $79,333 | $92,790 |
| Interquartile 75% (IQ3) | $109,797 | $137,031 |
| Interquartile Range (IQR) | $30,464 | $44,241 |
| Standard Deviation (Sample) | $24,866 | $41,178 |
| Standard Deviation (Population) | $24,537 | $40,855 |
Similar Demographics by Median Family Income
Demographics Similar to Canadians by Median Family Income
In terms of median family income, the demographic groups most similar to Canadians are Immigrants from Fiji ($106,544, a difference of 0.050%), Ugandan ($106,541, a difference of 0.050%), Immigrants from Oceania ($106,453, a difference of 0.14%), Portuguese ($106,286, a difference of 0.29%), and Brazilian ($106,942, a difference of 0.32%).
| Demographics | Rating | Rank | Median Family Income |
| Pakistanis | 91.7 /100 | #124 | Exceptional $107,390 |
| Taiwanese | 91.4 /100 | #125 | Exceptional $107,295 |
| Serbians | 90.8 /100 | #126 | Exceptional $107,157 |
| Lebanese | 90.5 /100 | #127 | Exceptional $107,086 |
| Immigrants | Ethiopia | 90.0 /100 | #128 | Excellent $106,969 |
| Arabs | 89.9 /100 | #129 | Excellent $106,952 |
| Brazilians | 89.8 /100 | #130 | Excellent $106,942 |
| Canadians | 88.1 /100 | #131 | Excellent $106,597 |
| Immigrants | Fiji | 87.8 /100 | #132 | Excellent $106,544 |
| Ugandans | 87.8 /100 | #133 | Excellent $106,541 |
| Immigrants | Oceania | 87.3 /100 | #134 | Excellent $106,453 |
| Portuguese | 86.3 /100 | #135 | Excellent $106,286 |
| Immigrants | South Eastern Asia | 86.1 /100 | #136 | Excellent $106,252 |
| Immigrants | Uganda | 85.7 /100 | #137 | Excellent $106,188 |
| Immigrants | Vietnam | 85.7 /100 | #138 | Excellent $106,186 |
Demographics Similar to Estonians by Median Family Income
In terms of median family income, the demographic groups most similar to Estonians are Immigrants from Lithuania ($118,053, a difference of 0.030%), Immigrants from Bolivia ($117,912, a difference of 0.090%), Bulgarian ($117,818, a difference of 0.17%), Cambodian ($117,780, a difference of 0.20%), and Immigrants from Asia ($118,291, a difference of 0.24%).
| Demographics | Rating | Rank | Median Family Income |
| Bolivians | 100.0 /100 | #34 | Exceptional $119,479 |
| Soviet Union | 100.0 /100 | #35 | Exceptional $119,262 |
| Israelis | 100.0 /100 | #36 | Exceptional $118,577 |
| Australians | 100.0 /100 | #37 | Exceptional $118,440 |
| Immigrants | Turkey | 100.0 /100 | #38 | Exceptional $118,325 |
| Immigrants | Asia | 100.0 /100 | #39 | Exceptional $118,291 |
| Immigrants | Lithuania | 100.0 /100 | #40 | Exceptional $118,053 |
| Estonians | 100.0 /100 | #41 | Exceptional $118,013 |
| Immigrants | Bolivia | 100.0 /100 | #42 | Exceptional $117,912 |
| Bulgarians | 100.0 /100 | #43 | Exceptional $117,818 |
| Cambodians | 100.0 /100 | #44 | Exceptional $117,780 |
| Immigrants | Greece | 99.9 /100 | #45 | Exceptional $117,344 |
| Immigrants | Russia | 99.9 /100 | #46 | Exceptional $116,942 |
| Immigrants | Austria | 99.9 /100 | #47 | Exceptional $116,830 |
| Immigrants | South Africa | 99.9 /100 | #48 | Exceptional $116,286 |