Canadian vs Laotian Householder Income Over 65 years

COMPARE

Canadian
Race
Ancestry
AfghanAfricanAlaska NativeAlaskan AthabascanAlbanianAleutAlsatianAmericanApacheArabArapahoArgentineanArmenianAssyrian/Chaldean/SyriacAustralianAustrianBahamianBangladeshiBarbadianBasqueBelgianBelizeanBermudanBhutaneseBlackfeetBolivianBrazilianBritishBritish West IndianBulgarianBurmeseCajunCambodianCanadianCape VerdeanCarpatho RusynCelticCentral AmericanCentral American IndianCherokeeCheyenneChickasawChileanChineseChippewaChoctawColombianColvilleComancheCosta RicanCreeCreekCroatianCrowCubanCypriotCzechCzechoslovakianDanishDelawareDominicanDutchDutch West IndianEastern EuropeanEcuadorianEgyptianEnglishEstonianEthiopianEuropeanFijianFilipinoFinnishFrenchFrench American IndianFrench CanadianGermanGerman RussianGhanaianGreekGuamanian/ChamorroGuatemalanGuyaneseHaitianHmongHonduranHopiHoumaHungarianIcelanderIndian (Asian)IndonesianInupiatIranianIraqiIrishIroquoisIsraeliItalianJamaicanJapaneseJordanianKenyanKiowaKoreanLatvianLebaneseLiberianLithuanianLumbeeLuxembourgerMacedonianMalaysianMalteseMarshalleseMenomineeMexicanMexican American IndianMongolianMoroccanNative HawaiianNavajoNepaleseNew ZealanderNicaraguanNigerianNorthern EuropeanNorwegianOkinawanOsageOttawaPaiutePakistaniPalestinianPanamanianParaguayanPennsylvania GermanPeruvianPimaPolishPortuguesePotawatomiPuebloPuerto RicanPuget Sound SalishRomanianRussianSalvadoranSamoanScandinavianScotch-IrishScottishSeminoleSenegaleseSerbianShoshoneSierra LeoneanSiouxSlavicSlovakSloveneSomaliSouth AfricanSouth AmericanSouth American IndianSoviet UnionSpaniardSpanishSpanish AmericanSpanish American IndianSri LankanSubsaharan AfricanSudaneseSwedishSwissSyrianTaiwaneseThaiTlingit-HaidaTohono O'OdhamTonganTrinidadian and TobagonianTsimshianTurkishU.S. Virgin IslanderUgandanUkrainianUruguayanUteVenezuelanVietnameseWelshWest IndianYakamaYaquiYugoslavianYumanYup'ikZimbabwean
Immigration
NonimmigrantsImmigrantsAfghanistanAfricaAlbaniaArgentinaArmeniaAsiaAustraliaAustriaBahamasBangladeshBarbadosBelarusBelgiumBelizeBoliviaBosnia and HerzegovinaBrazilBulgariaBurma/MyanmarCabo VerdeCambodiaCameroonCanadaCaribbeanCentral AmericaChileChinaColombiaCongoCosta RicaCroatiaCubaCzechoslovakiaDenmarkDominicaDominican RepublicEastern AfricaEastern AsiaEastern EuropeEcuadorEgyptEl SalvadorEnglandEritreaEthiopiaEuropeFijiFranceGermanyGhanaGreeceGrenadaGuatemalaGuyanaHaitiHondurasHong KongHungaryIndiaIndonesiaIranIraqIrelandIsraelItalyJamaicaJapanJordanKazakhstanKenyaKoreaKuwaitLaosLatin AmericaLatviaLebanonLiberiaLithuaniaMalaysiaMexicoMicronesiaMiddle AfricaMoldovaMoroccoNepalNetherlandsNicaraguaNigeriaNorth AmericaNorth MacedoniaNorthern AfricaNorthern EuropeNorwayOceaniaPakistanPanamaPeruPhilippinesPolandPortugalRomaniaRussiaSaudi ArabiaScotlandSenegalSerbiaSierra LeoneSingaporeSomaliaSouth AfricaSouth AmericaSouth Central AsiaSouth Eastern AsiaSouthern EuropeSpainSri LankaSt. Vincent and the GrenadinesSudanSwedenSwitzerlandSyriaTaiwanThailandTrinidad and TobagoTurkeyUgandaUkraineUruguayUzbekistanVenezuelaVietnamWest IndiesWestern AfricaWestern AsiaWestern EuropeYemenZaireZimbabweAzores
Laotian
Race
Ancestry
AfghanAfricanAlaska NativeAlaskan AthabascanAlbanianAleutAlsatianAmericanApacheArabArapahoArgentineanArmenianAssyrian/Chaldean/SyriacAustralianAustrianBahamianBangladeshiBarbadianBasqueBelgianBelizeanBermudanBhutaneseBlackfeetBolivianBrazilianBritishBritish West IndianBulgarianBurmeseCajunCambodianCape VerdeanCarpatho RusynCelticCentral AmericanCentral American IndianCherokeeCheyenneChickasawChileanChineseChippewaChoctawColombianColvilleComancheCosta RicanCreeCreekCroatianCrowCubanCypriotCzechCzechoslovakianDanishDelawareDominicanDutchDutch West IndianEastern EuropeanEcuadorianEgyptianEnglishEstonianEthiopianEuropeanFijianFilipinoFinnishFrenchFrench American IndianFrench CanadianGermanGerman RussianGhanaianGreekGuamanian/ChamorroGuatemalanGuyaneseHaitianHmongHonduranHopiHoumaHungarianIcelanderIndian (Asian)IndonesianInupiatIranianIraqiIrishIroquoisIsraeliItalianJamaicanJapaneseJordanianKenyanKiowaKoreanLaotianLatvianLebaneseLiberianLithuanianLumbeeLuxembourgerMacedonianMalaysianMalteseMarshalleseMenomineeMexicanMexican American IndianMongolianMoroccanNative HawaiianNavajoNepaleseNew ZealanderNicaraguanNigerianNorthern EuropeanNorwegianOkinawanOsageOttawaPaiutePakistaniPalestinianPanamanianParaguayanPennsylvania GermanPeruvianPimaPolishPortuguesePotawatomiPuebloPuerto RicanPuget Sound SalishRomanianRussianSalvadoranSamoanScandinavianScotch-IrishScottishSeminoleSenegaleseSerbianShoshoneSierra LeoneanSiouxSlavicSlovakSloveneSomaliSouth AfricanSouth AmericanSouth American IndianSoviet UnionSpaniardSpanishSpanish AmericanSpanish American IndianSri LankanSubsaharan AfricanSudaneseSwedishSwissSyrianTaiwaneseThaiTlingit-HaidaTohono O'OdhamTonganTrinidadian and TobagonianTsimshianTurkishU.S. Virgin IslanderUgandanUkrainianUruguayanUteVenezuelanVietnameseWelshWest IndianYakamaYaquiYugoslavianYumanYup'ikZimbabwean
Immigration
NonimmigrantsImmigrantsAfghanistanAfricaAlbaniaArgentinaArmeniaAsiaAustraliaAustriaBahamasBangladeshBarbadosBelarusBelgiumBelizeBoliviaBosnia and HerzegovinaBrazilBulgariaBurma/MyanmarCabo VerdeCambodiaCameroonCanadaCaribbeanCentral AmericaChileChinaColombiaCongoCosta RicaCroatiaCubaCzechoslovakiaDenmarkDominicaDominican RepublicEastern AfricaEastern AsiaEastern EuropeEcuadorEgyptEl SalvadorEnglandEritreaEthiopiaEuropeFijiFranceGermanyGhanaGreeceGrenadaGuatemalaGuyanaHaitiHondurasHong KongHungaryIndiaIndonesiaIranIraqIrelandIsraelItalyJamaicaJapanJordanKazakhstanKenyaKoreaKuwaitLaosLatin AmericaLatviaLebanonLiberiaLithuaniaMalaysiaMexicoMicronesiaMiddle AfricaMoldovaMoroccoNepalNetherlandsNicaraguaNigeriaNorth AmericaNorth MacedoniaNorthern AfricaNorthern EuropeNorwayOceaniaPakistanPanamaPeruPhilippinesPolandPortugalRomaniaRussiaSaudi ArabiaScotlandSenegalSerbiaSierra LeoneSingaporeSomaliaSouth AfricaSouth AmericaSouth Central AsiaSouth Eastern AsiaSouthern EuropeSpainSri LankaSt. Vincent and the GrenadinesSudanSwedenSwitzerlandSyriaTaiwanThailandTrinidad and TobagoTurkeyUgandaUkraineUruguayUzbekistanVenezuelaVietnamWest IndiesWestern AfricaWestern AsiaWestern EuropeYemenZaireZimbabweAzores
Householder Income Over 65 years
Income
Poverty
Unemployment
Labor Participation
Family Structure
Vehicle Availability
Education Level
Disability

Householder Income Over 65 years Comparison

Canadians

Laotians

Good
Exceptional
$62,230
HOUSEHOLDER INCOME OVER 65 YEARS
79.0/ 100
METRIC RATING
141st/ 347
METRIC RANK
$66,306
HOUSEHOLDER INCOME OVER 65 YEARS
99.6/ 100
METRIC RATING
56th/ 347
METRIC RANK

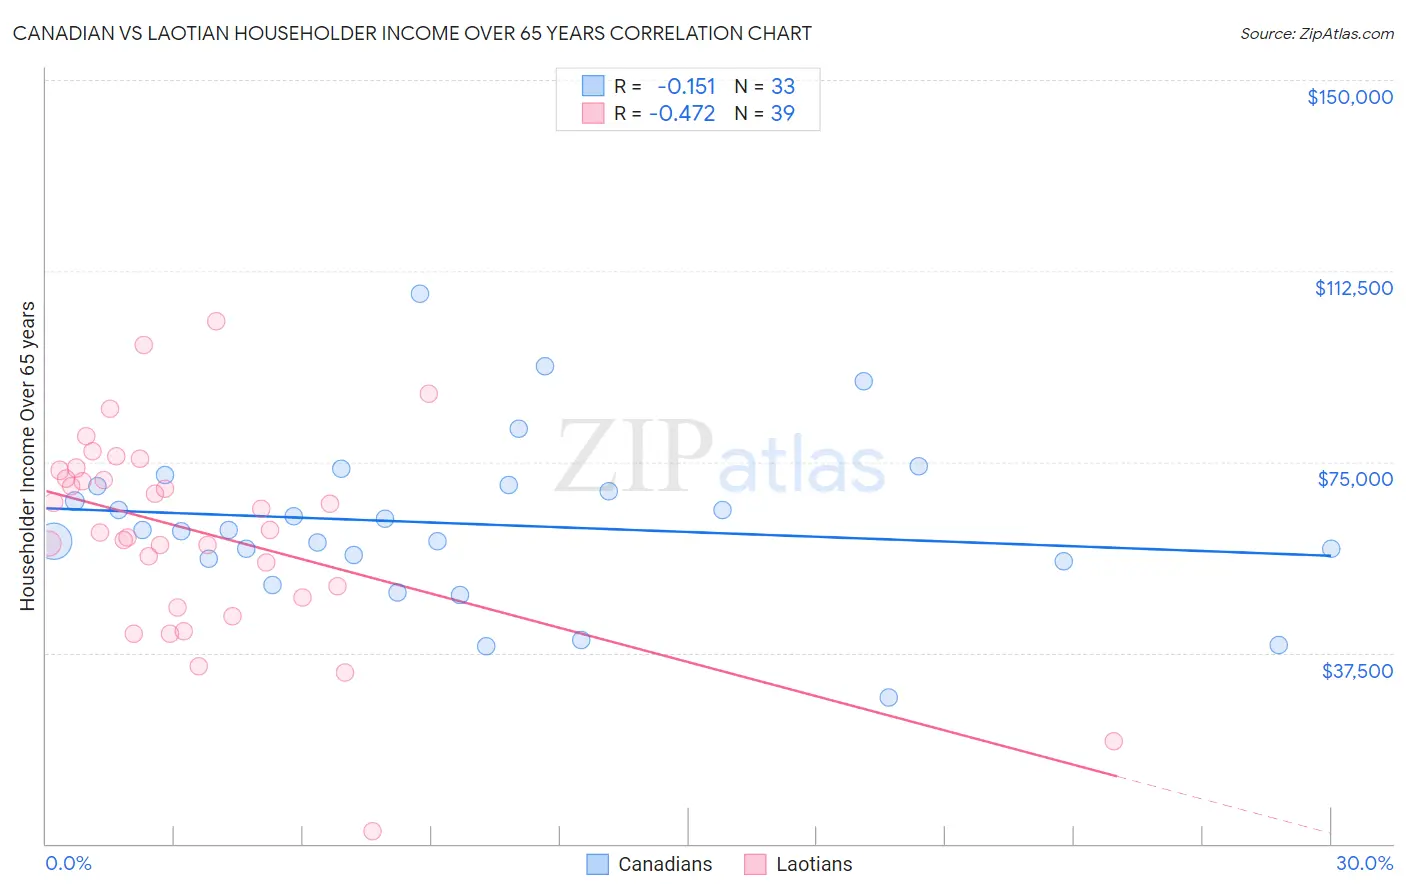
Canadian vs Laotian Householder Income Over 65 years Correlation Chart

The statistical analysis conducted on geographies consisting of 436,051,930 people shows a poor negative correlation between the proportion of Canadians and household income with householder over the age of 65 in the United States with a correlation coefficient (R) of -0.151 and weighted average of $62,230. Similarly, the statistical analysis conducted on geographies consisting of 224,427,715 people shows a moderate negative correlation between the proportion of Laotians and household income with householder over the age of 65 in the United States with a correlation coefficient (R) of -0.472 and weighted average of $66,306, a difference of 6.6%.
Canadian vs Laotian Householder Income Over 65 years

Householder Income Over 65 years Correlation Summary

MeasurementCanadianLaotian
Minimum$28,616$2,499
Maximum$108,103$102,679
Range$79,487$100,180
Mean$62,811$61,254
Median$61,617$61,648
Interquartile 25% (IQ1)$55,674$48,484
Interquartile 75% (IQ3)$70,369$73,311
Interquartile Range (IQR)$14,695$24,827
Standard Deviation (Sample)$16,050$19,839
Standard Deviation (Population)$15,805$19,583

Similar Demographics by Householder Income Over 65 years

Demographics Similar to Canadians by Householder Income Over 65 years

In terms of householder income over 65 years, the demographic groups most similar to Canadians are South American Indian ($62,215, a difference of 0.020%), Arab ($62,266, a difference of 0.060%), Lebanese ($62,287, a difference of 0.090%), Immigrants from Kazakhstan ($62,292, a difference of 0.10%), and Immigrants from Belarus ($62,162, a difference of 0.11%).
DemographicsRating | RankHouseholder Income Over 65 years
Immigrants | Brazil
81.2
/100
|
#134
Excellent
$62,364
Immigrants | Chile
81.0
/100
|
#135
Excellent
$62,354
Alaskan Athabascans
80.6
/100
|
#136
Excellent
$62,330
Immigrants | Syria
80.2
/100
|
#137
Excellent
$62,303
Immigrants | Kazakhstan
80.0
/100
|
#138
Excellent
$62,292
Lebanese
79.9
/100
|
#139
Good
$62,287
Arabs
79.6
/100
|
#140
Good
$62,266
Canadians
79.0
/100
|
#141
Good
$62,230
South American Indians
78.7
/100
|
#142
Good
$62,215
Immigrants | Belarus
77.8
/100
|
#143
Good
$62,162
Immigrants | Peru
74.4
/100
|
#144
Good
$61,988
Immigrants | Uganda
74.2
/100
|
#145
Good
$61,976
Immigrants | Southern Europe
72.7
/100
|
#146
Good
$61,902
Immigrants | Nepal
71.4
/100
|
#147
Good
$61,843
Alsatians
70.5
/100
|
#148
Good
$61,797

Demographics Similar to Laotians by Householder Income Over 65 years

In terms of householder income over 65 years, the demographic groups most similar to Laotians are Immigrants from Czechoslovakia ($66,376, a difference of 0.11%), Bulgarian ($66,236, a difference of 0.11%), Immigrants from Philippines ($66,161, a difference of 0.22%), Immigrants from Netherlands ($66,463, a difference of 0.24%), and Immigrants from Norway ($66,118, a difference of 0.28%).
DemographicsRating | RankHouseholder Income Over 65 years
Immigrants | Indonesia
99.8
/100
|
#49
Exceptional
$66,694
Immigrants | Turkey
99.7
/100
|
#50
Exceptional
$66,672
Israelis
99.7
/100
|
#51
Exceptional
$66,636
Immigrants | Scotland
99.7
/100
|
#52
Exceptional
$66,620
Immigrants | Pakistan
99.7
/100
|
#53
Exceptional
$66,617
Immigrants | Netherlands
99.7
/100
|
#54
Exceptional
$66,463
Immigrants | Czechoslovakia
99.7
/100
|
#55
Exceptional
$66,376
Laotians
99.6
/100
|
#56
Exceptional
$66,306
Bulgarians
99.6
/100
|
#57
Exceptional
$66,236
Immigrants | Philippines
99.6
/100
|
#58
Exceptional
$66,161
Immigrants | Norway
99.5
/100
|
#59
Exceptional
$66,118
Immigrants | Lithuania
99.5
/100
|
#60
Exceptional
$66,087
Maltese
99.5
/100
|
#61
Exceptional
$66,027
Immigrants | Sierra Leone
99.5
/100
|
#62
Exceptional
$66,009
Marshallese
99.4
/100
|
#63
Exceptional
$65,874