Bulgarian vs Immigrants from Portugal Wage/Income Gap
COMPARE
Bulgarian
Immigrants from Portugal
Wage/Income Gap
Wage/Income Gap Comparison
Bulgarians
Immigrants from Portugal
27.8%
WAGE/INCOME GAP
0.7/ 100
METRIC RATING
273rd/ 347
METRIC RANK
26.7%
WAGE/INCOME GAP
9.5/ 100
METRIC RATING
216th/ 347
METRIC RANK
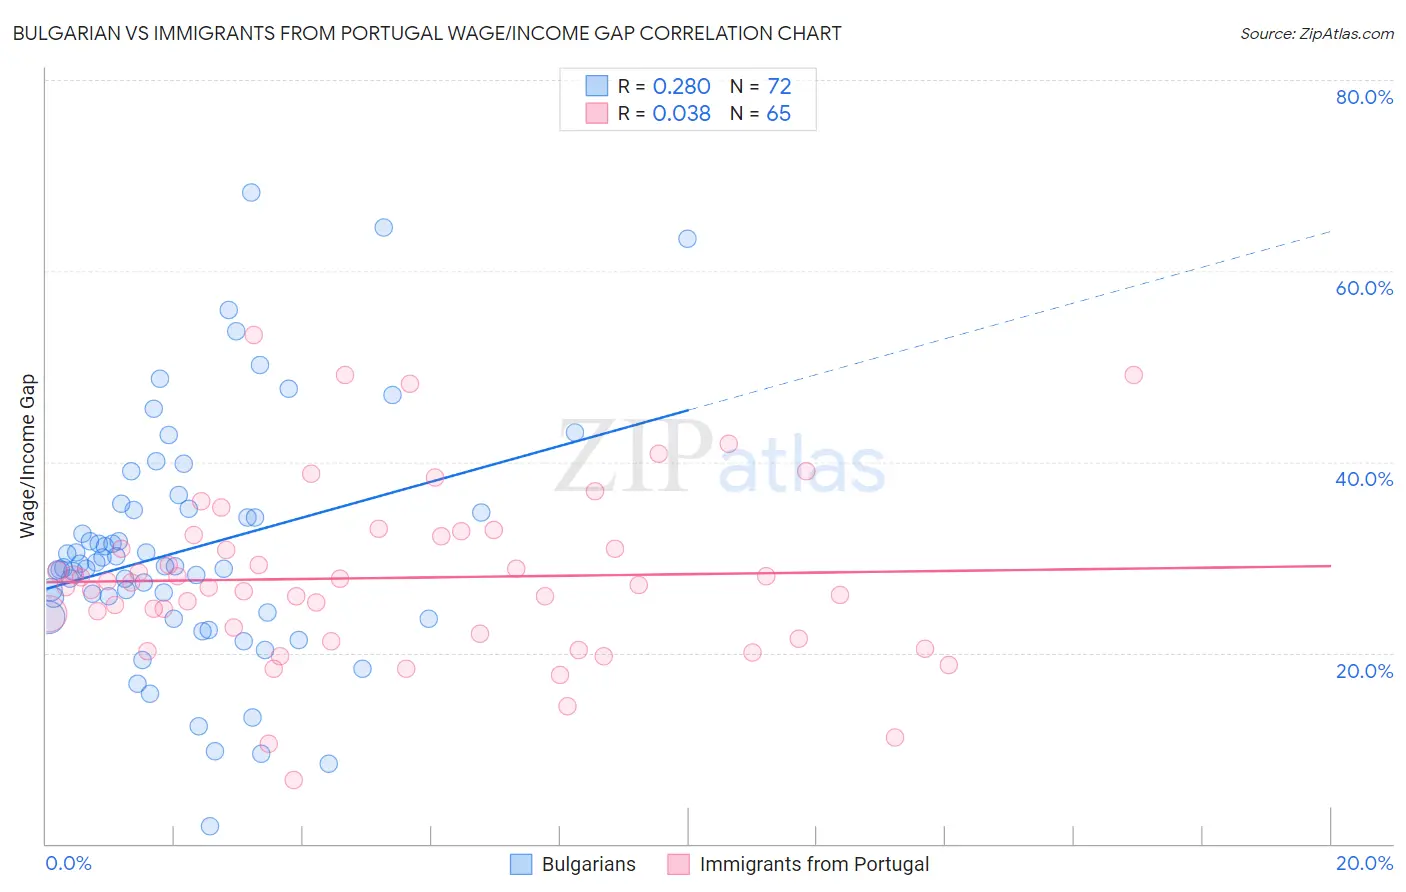
Bulgarian vs Immigrants from Portugal Wage/Income Gap Correlation Chart
The statistical analysis conducted on geographies consisting of 205,588,270 people shows a weak positive correlation between the proportion of Bulgarians and wage/income gap percentage in the United States with a correlation coefficient (R) of 0.280 and weighted average of 27.8%. Similarly, the statistical analysis conducted on geographies consisting of 174,735,300 people shows no correlation between the proportion of Immigrants from Portugal and wage/income gap percentage in the United States with a correlation coefficient (R) of 0.038 and weighted average of 26.7%, a difference of 4.2%.
Wage/Income Gap Correlation Summary
| Measurement | Bulgarian | Immigrants from Portugal |
| Minimum | 1.9% | 6.7% |
| Maximum | 68.2% | 53.3% |
| Range | 66.3% | 46.6% |
| Mean | 30.9% | 27.8% |
| Median | 29.1% | 27.1% |
| Interquartile 25% (IQ1) | 23.9% | 21.7% |
| Interquartile 75% (IQ3) | 35.1% | 32.3% |
| Interquartile Range (IQR) | 11.1% | 10.6% |
| Standard Deviation (Sample) | 12.6% | 9.0% |
| Standard Deviation (Population) | 12.5% | 9.0% |
Similar Demographics by Wage/Income Gap
Demographics Similar to Bulgarians by Wage/Income Gap
In terms of wage/income gap, the demographic groups most similar to Bulgarians are American (27.8%, a difference of 0.040%), Immigrants from Korea (27.8%, a difference of 0.11%), Immigrants from Japan (27.9%, a difference of 0.12%), Lebanese (27.9%, a difference of 0.15%), and Latvian (27.9%, a difference of 0.15%).
| Demographics | Rating | Rank | Wage/Income Gap |
| Hmong | 1.0 /100 | #266 | Tragic 27.7% |
| Turks | 1.0 /100 | #267 | Tragic 27.7% |
| New Zealanders | 1.0 /100 | #268 | Tragic 27.7% |
| Potawatomi | 0.9 /100 | #269 | Tragic 27.7% |
| Immigrants | Western Europe | 0.9 /100 | #270 | Tragic 27.8% |
| Ute | 0.8 /100 | #271 | Tragic 27.8% |
| Immigrants | Korea | 0.8 /100 | #272 | Tragic 27.8% |
| Bulgarians | 0.7 /100 | #273 | Tragic 27.8% |
| Americans | 0.7 /100 | #274 | Tragic 27.8% |
| Immigrants | Japan | 0.7 /100 | #275 | Tragic 27.9% |
| Lebanese | 0.7 /100 | #276 | Tragic 27.9% |
| Latvians | 0.7 /100 | #277 | Tragic 27.9% |
| Immigrants | England | 0.6 /100 | #278 | Tragic 27.9% |
| Romanians | 0.5 /100 | #279 | Tragic 28.0% |
| Russians | 0.5 /100 | #280 | Tragic 28.0% |
Demographics Similar to Immigrants from Portugal by Wage/Income Gap
In terms of wage/income gap, the demographic groups most similar to Immigrants from Portugal are Yugoslavian (26.7%, a difference of 0.040%), Brazilian (26.7%, a difference of 0.050%), Immigrants from Saudi Arabia (26.7%, a difference of 0.080%), Immigrants from Poland (26.7%, a difference of 0.11%), and Immigrants from Latvia (26.7%, a difference of 0.12%).
| Demographics | Rating | Rank | Wage/Income Gap |
| Immigrants | Kuwait | 12.6 /100 | #209 | Poor 26.6% |
| Arabs | 12.3 /100 | #210 | Poor 26.6% |
| Mongolians | 11.4 /100 | #211 | Poor 26.6% |
| Iraqis | 11.2 /100 | #212 | Poor 26.6% |
| Immigrants | Iraq | 10.3 /100 | #213 | Poor 26.7% |
| Immigrants | China | 10.3 /100 | #214 | Poor 26.7% |
| Yugoslavians | 9.7 /100 | #215 | Tragic 26.7% |
| Immigrants | Portugal | 9.5 /100 | #216 | Tragic 26.7% |
| Brazilians | 9.2 /100 | #217 | Tragic 26.7% |
| Immigrants | Saudi Arabia | 9.1 /100 | #218 | Tragic 26.7% |
| Immigrants | Poland | 8.9 /100 | #219 | Tragic 26.7% |
| Immigrants | Latvia | 8.9 /100 | #220 | Tragic 26.7% |
| Immigrants | Spain | 8.5 /100 | #221 | Tragic 26.8% |
| Bolivians | 8.3 /100 | #222 | Tragic 26.8% |
| Jordanians | 8.0 /100 | #223 | Tragic 26.8% |