Black/African American vs Senegalese Householder Income Under 25 years
COMPARE
Black/African American
Senegalese
Householder Income Under 25 years
Householder Income Under 25 years Comparison
Blacks/African Americans
Senegalese
$44,381
HOUSEHOLDER INCOME UNDER 25 YEARS
0.0/ 100
METRIC RATING
340th/ 347
METRIC RANK
$48,953
HOUSEHOLDER INCOME UNDER 25 YEARS
0.0/ 100
METRIC RATING
287th/ 347
METRIC RANK
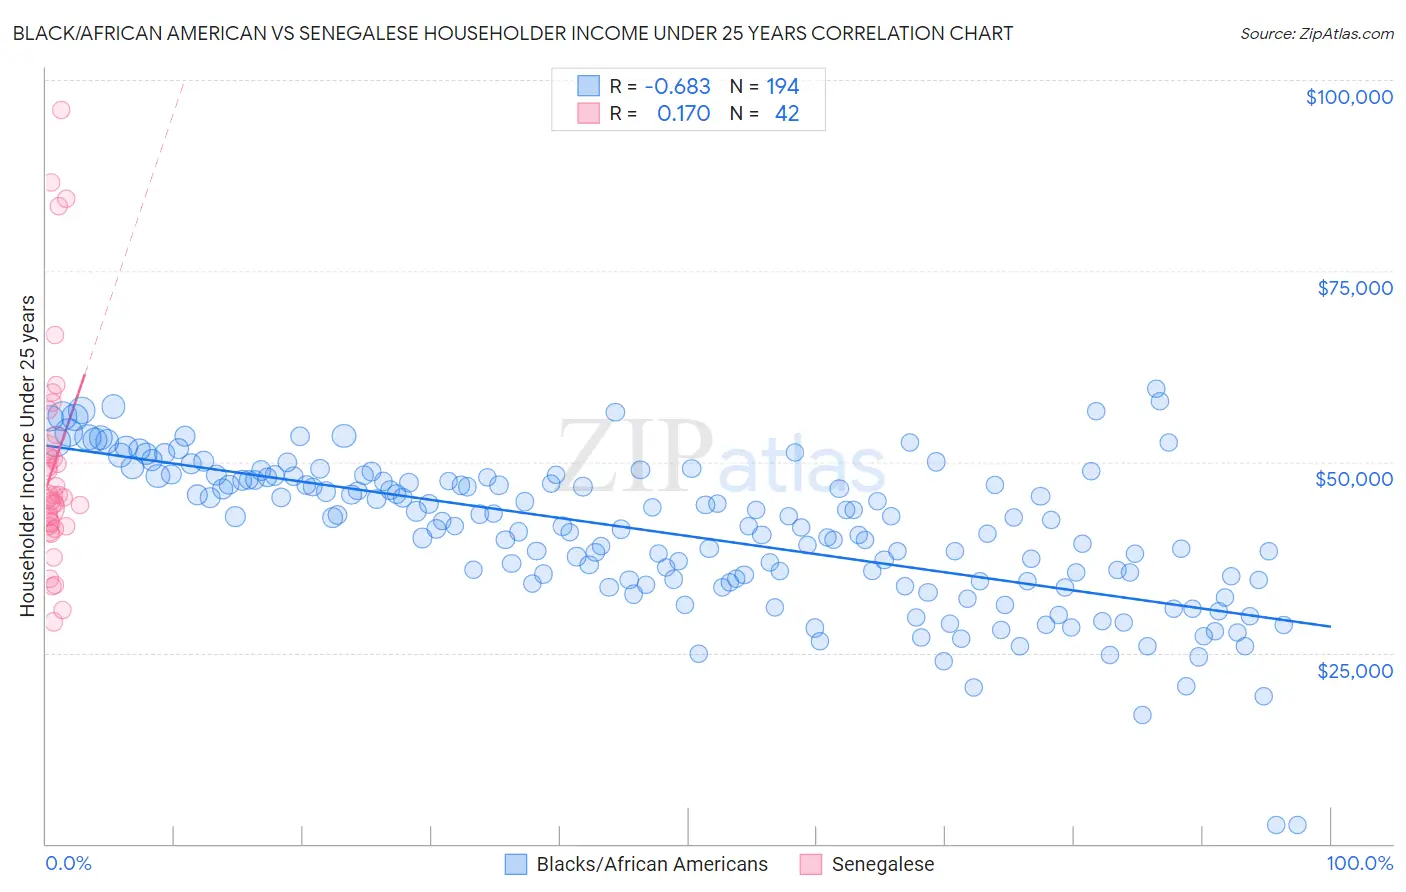
Black/African American vs Senegalese Householder Income Under 25 years Correlation Chart
The statistical analysis conducted on geographies consisting of 438,583,318 people shows a significant negative correlation between the proportion of Blacks/African Americans and household income with householder under the age of 25 in the United States with a correlation coefficient (R) of -0.683 and weighted average of $44,381. Similarly, the statistical analysis conducted on geographies consisting of 74,236,071 people shows a poor positive correlation between the proportion of Senegalese and household income with householder under the age of 25 in the United States with a correlation coefficient (R) of 0.170 and weighted average of $48,953, a difference of 10.3%.
Householder Income Under 25 years Correlation Summary
| Measurement | Black/African American | Senegalese |
| Minimum | $2,499 | $29,051 |
| Maximum | $59,638 | $96,121 |
| Range | $57,139 | $67,070 |
| Mean | $40,625 | $49,594 |
| Median | $41,554 | $45,365 |
| Interquartile 25% (IQ1) | $34,429 | $41,620 |
| Interquartile 75% (IQ3) | $47,684 | $51,815 |
| Interquartile Range (IQR) | $13,255 | $10,195 |
| Standard Deviation (Sample) | $9,747 | $14,774 |
| Standard Deviation (Population) | $9,722 | $14,597 |
Similar Demographics by Householder Income Under 25 years
Demographics Similar to Blacks/African Americans by Householder Income Under 25 years
In terms of householder income under 25 years, the demographic groups most similar to Blacks/African Americans are Houma ($44,356, a difference of 0.060%), Kiowa ($44,733, a difference of 0.79%), Chickasaw ($44,763, a difference of 0.86%), Arapaho ($44,003, a difference of 0.86%), and Pueblo ($45,018, a difference of 1.4%).
| Demographics | Rating | Rank | Householder Income Under 25 years |
| Creek | 0.0 /100 | #333 | Tragic $45,371 |
| Cajuns | 0.0 /100 | #334 | Tragic $45,338 |
| Cheyenne | 0.0 /100 | #335 | Tragic $45,275 |
| Tohono O'odham | 0.0 /100 | #336 | Tragic $45,248 |
| Pueblo | 0.0 /100 | #337 | Tragic $45,018 |
| Chickasaw | 0.0 /100 | #338 | Tragic $44,763 |
| Kiowa | 0.0 /100 | #339 | Tragic $44,733 |
| Blacks/African Americans | 0.0 /100 | #340 | Tragic $44,381 |
| Houma | 0.0 /100 | #341 | Tragic $44,356 |
| Arapaho | 0.0 /100 | #342 | Tragic $44,003 |
| Immigrants | Yemen | 0.0 /100 | #343 | Tragic $43,591 |
| Immigrants | Congo | 0.0 /100 | #344 | Tragic $43,266 |
| Navajo | 0.0 /100 | #345 | Tragic $42,380 |
| Puerto Ricans | 0.0 /100 | #346 | Tragic $39,726 |
| Lumbee | 0.0 /100 | #347 | Tragic $34,584 |
Demographics Similar to Senegalese by Householder Income Under 25 years
In terms of householder income under 25 years, the demographic groups most similar to Senegalese are French American Indian ($48,977, a difference of 0.050%), Liberian ($48,917, a difference of 0.070%), Honduran ($48,885, a difference of 0.14%), Scotch-Irish ($49,039, a difference of 0.18%), and American ($48,860, a difference of 0.19%).
| Demographics | Rating | Rank | Householder Income Under 25 years |
| Hmong | 0.1 /100 | #280 | Tragic $49,364 |
| Immigrants | Nonimmigrants | 0.1 /100 | #281 | Tragic $49,348 |
| Alsatians | 0.1 /100 | #282 | Tragic $49,267 |
| Immigrants | Nigeria | 0.1 /100 | #283 | Tragic $49,174 |
| Carpatho Rusyns | 0.1 /100 | #284 | Tragic $49,113 |
| Scotch-Irish | 0.0 /100 | #285 | Tragic $49,039 |
| French American Indians | 0.0 /100 | #286 | Tragic $48,977 |
| Senegalese | 0.0 /100 | #287 | Tragic $48,953 |
| Liberians | 0.0 /100 | #288 | Tragic $48,917 |
| Hondurans | 0.0 /100 | #289 | Tragic $48,885 |
| Americans | 0.0 /100 | #290 | Tragic $48,860 |
| Immigrants | Burma/Myanmar | 0.0 /100 | #291 | Tragic $48,749 |
| Shoshone | 0.0 /100 | #292 | Tragic $48,720 |
| Sub-Saharan Africans | 0.0 /100 | #293 | Tragic $48,691 |
| Somalis | 0.0 /100 | #294 | Tragic $48,657 |