Black/African American vs Bhutanese Householder Income Under 25 years
COMPARE
Black/African American
Bhutanese
Householder Income Under 25 years
Householder Income Under 25 years Comparison
Blacks/African Americans
Bhutanese
$44,381
HOUSEHOLDER INCOME UNDER 25 YEARS
0.0/ 100
METRIC RATING
340th/ 347
METRIC RANK
$57,078
HOUSEHOLDER INCOME UNDER 25 YEARS
100.0/ 100
METRIC RATING
19th/ 347
METRIC RANK
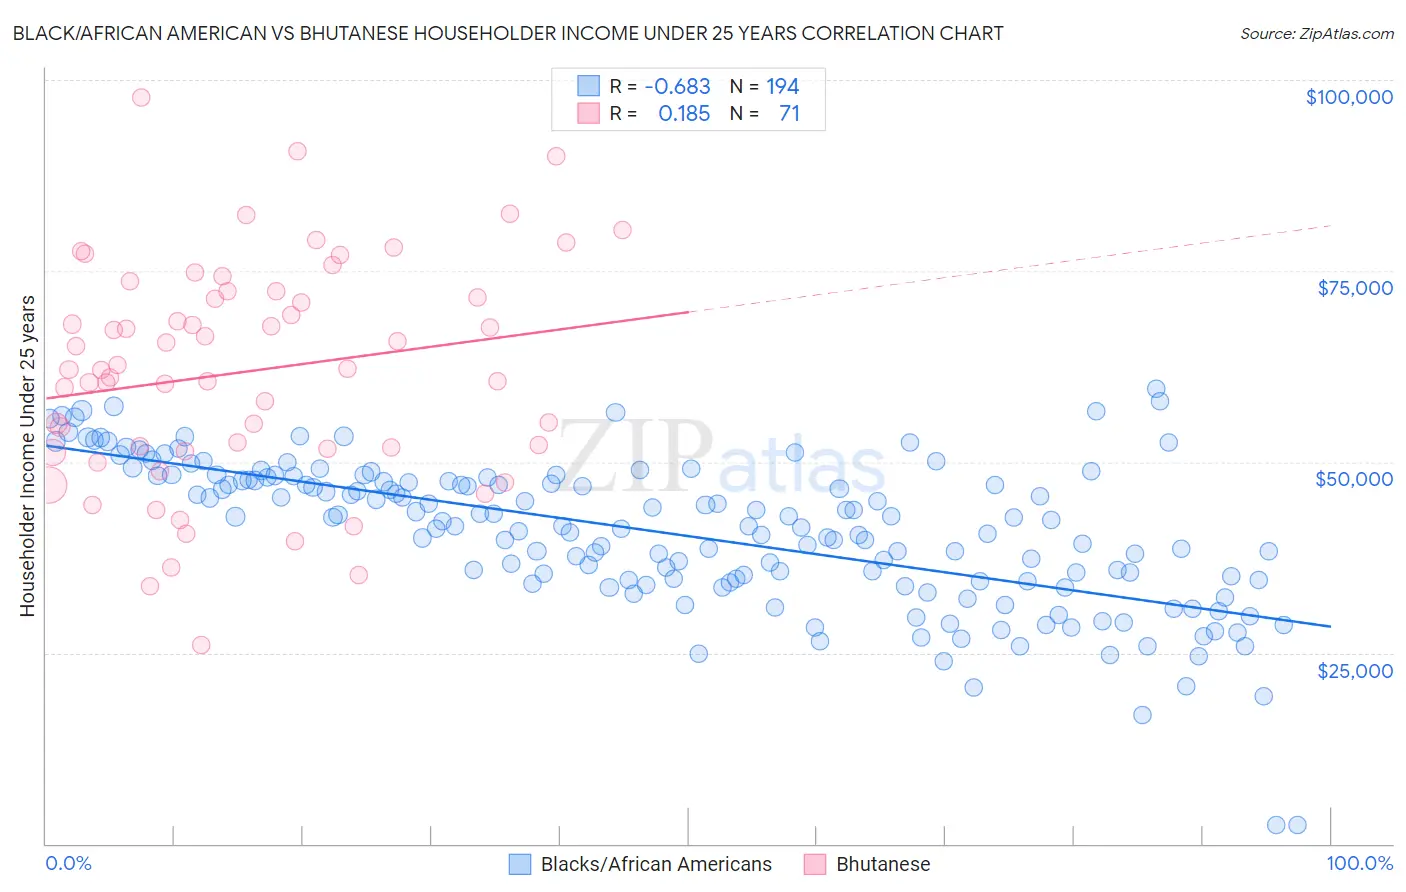
Black/African American vs Bhutanese Householder Income Under 25 years Correlation Chart
The statistical analysis conducted on geographies consisting of 438,583,318 people shows a significant negative correlation between the proportion of Blacks/African Americans and household income with householder under the age of 25 in the United States with a correlation coefficient (R) of -0.683 and weighted average of $44,381. Similarly, the statistical analysis conducted on geographies consisting of 378,977,160 people shows a poor positive correlation between the proportion of Bhutanese and household income with householder under the age of 25 in the United States with a correlation coefficient (R) of 0.185 and weighted average of $57,078, a difference of 28.6%.
Householder Income Under 25 years Correlation Summary
| Measurement | Black/African American | Bhutanese |
| Minimum | $2,499 | $26,023 |
| Maximum | $59,638 | $97,652 |
| Range | $57,139 | $71,629 |
| Mean | $40,625 | $61,820 |
| Median | $41,554 | $62,088 |
| Interquartile 25% (IQ1) | $34,429 | $51,736 |
| Interquartile 75% (IQ3) | $47,684 | $72,371 |
| Interquartile Range (IQR) | $13,255 | $20,635 |
| Standard Deviation (Sample) | $9,747 | $14,588 |
| Standard Deviation (Population) | $9,722 | $14,485 |
Similar Demographics by Householder Income Under 25 years
Demographics Similar to Blacks/African Americans by Householder Income Under 25 years
In terms of householder income under 25 years, the demographic groups most similar to Blacks/African Americans are Houma ($44,356, a difference of 0.060%), Kiowa ($44,733, a difference of 0.79%), Chickasaw ($44,763, a difference of 0.86%), Arapaho ($44,003, a difference of 0.86%), and Pueblo ($45,018, a difference of 1.4%).
| Demographics | Rating | Rank | Householder Income Under 25 years |
| Creek | 0.0 /100 | #333 | Tragic $45,371 |
| Cajuns | 0.0 /100 | #334 | Tragic $45,338 |
| Cheyenne | 0.0 /100 | #335 | Tragic $45,275 |
| Tohono O'odham | 0.0 /100 | #336 | Tragic $45,248 |
| Pueblo | 0.0 /100 | #337 | Tragic $45,018 |
| Chickasaw | 0.0 /100 | #338 | Tragic $44,763 |
| Kiowa | 0.0 /100 | #339 | Tragic $44,733 |
| Blacks/African Americans | 0.0 /100 | #340 | Tragic $44,381 |
| Houma | 0.0 /100 | #341 | Tragic $44,356 |
| Arapaho | 0.0 /100 | #342 | Tragic $44,003 |
| Immigrants | Yemen | 0.0 /100 | #343 | Tragic $43,591 |
| Immigrants | Congo | 0.0 /100 | #344 | Tragic $43,266 |
| Navajo | 0.0 /100 | #345 | Tragic $42,380 |
| Puerto Ricans | 0.0 /100 | #346 | Tragic $39,726 |
| Lumbee | 0.0 /100 | #347 | Tragic $34,584 |
Demographics Similar to Bhutanese by Householder Income Under 25 years
In terms of householder income under 25 years, the demographic groups most similar to Bhutanese are Immigrants from Ireland ($57,075, a difference of 0.010%), Immigrants from Fiji ($57,074, a difference of 0.010%), Immigrants from Eastern Asia ($57,123, a difference of 0.080%), Asian ($57,003, a difference of 0.13%), and Tongan ($56,972, a difference of 0.18%).
| Demographics | Rating | Rank | Householder Income Under 25 years |
| Immigrants | Philippines | 100.0 /100 | #12 | Exceptional $57,930 |
| Immigrants | South Central Asia | 100.0 /100 | #13 | Exceptional $57,818 |
| Filipinos | 100.0 /100 | #14 | Exceptional $57,740 |
| Koreans | 100.0 /100 | #15 | Exceptional $57,730 |
| Immigrants | Afghanistan | 100.0 /100 | #16 | Exceptional $57,478 |
| Sierra Leoneans | 100.0 /100 | #17 | Exceptional $57,272 |
| Immigrants | Eastern Asia | 100.0 /100 | #18 | Exceptional $57,123 |
| Bhutanese | 100.0 /100 | #19 | Exceptional $57,078 |
| Immigrants | Ireland | 100.0 /100 | #20 | Exceptional $57,075 |
| Immigrants | Fiji | 100.0 /100 | #21 | Exceptional $57,074 |
| Asians | 100.0 /100 | #22 | Exceptional $57,003 |
| Tongans | 100.0 /100 | #23 | Exceptional $56,972 |
| Immigrants | Singapore | 100.0 /100 | #24 | Exceptional $56,835 |
| Immigrants | Pakistan | 100.0 /100 | #25 | Exceptional $56,789 |
| Immigrants | Australia | 100.0 /100 | #26 | Exceptional $56,660 |