Black/African American vs Lithuanian Householder Income Over 65 years
COMPARE
Black/African American
Lithuanian
Householder Income Over 65 years
Householder Income Over 65 years Comparison
Blacks/African Americans
Lithuanians
$50,779
HOUSEHOLDER INCOME OVER 65 YEARS
0.0/ 100
METRIC RATING
329th/ 347
METRIC RANK
$65,209
HOUSEHOLDER INCOME OVER 65 YEARS
98.8/ 100
METRIC RATING
74th/ 347
METRIC RANK
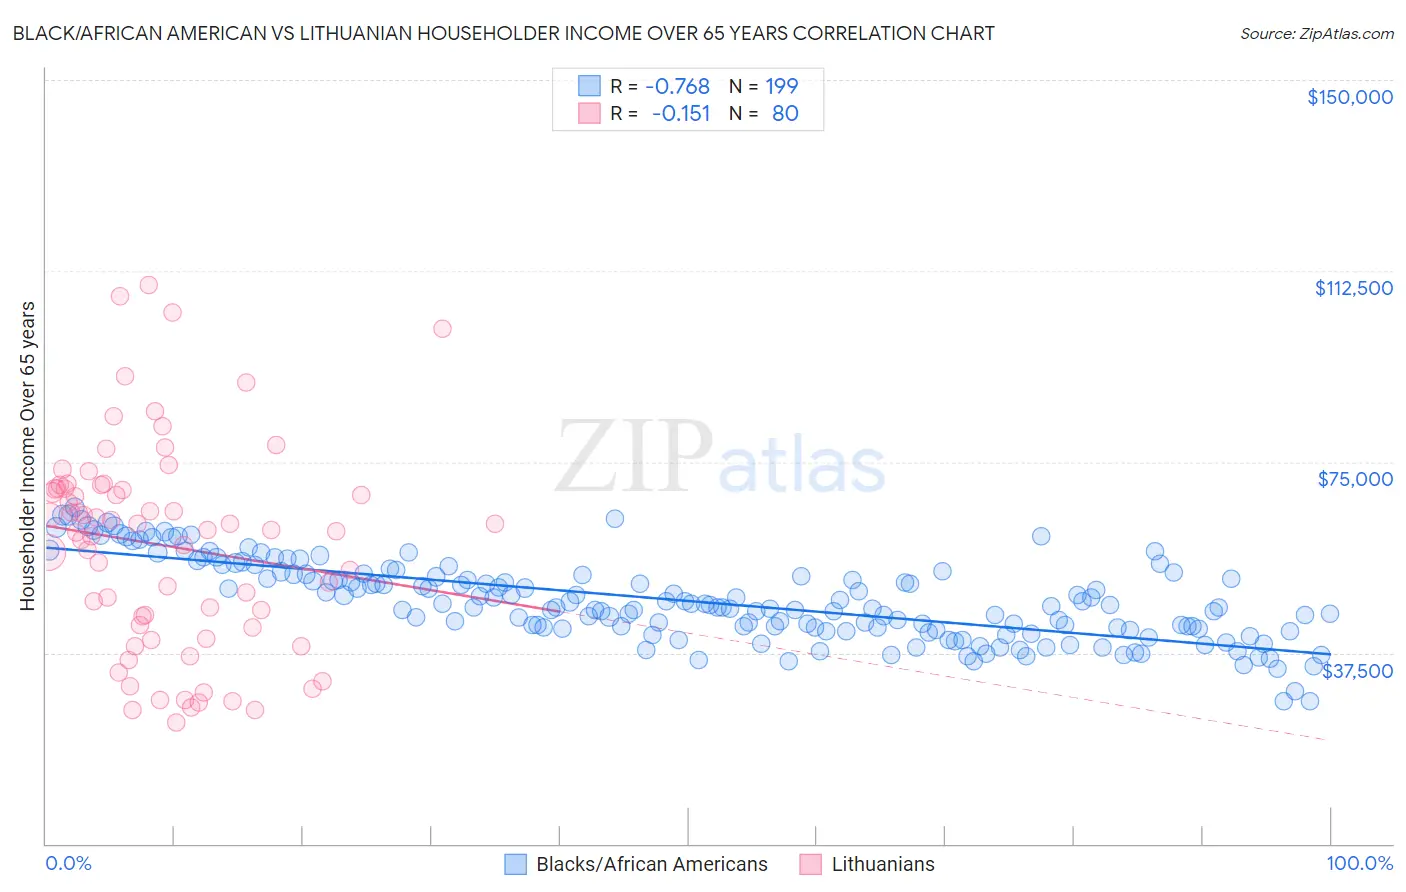
Black/African American vs Lithuanian Householder Income Over 65 years Correlation Chart
The statistical analysis conducted on geographies consisting of 560,756,533 people shows a strong negative correlation between the proportion of Blacks/African Americans and household income with householder over the age of 65 in the United States with a correlation coefficient (R) of -0.768 and weighted average of $50,779. Similarly, the statistical analysis conducted on geographies consisting of 420,649,673 people shows a poor negative correlation between the proportion of Lithuanians and household income with householder over the age of 65 in the United States with a correlation coefficient (R) of -0.151 and weighted average of $65,209, a difference of 28.4%.
Householder Income Over 65 years Correlation Summary
| Measurement | Black/African American | Lithuanian |
| Minimum | $27,967 | $23,920 |
| Maximum | $66,084 | $109,815 |
| Range | $38,117 | $85,895 |
| Mean | $47,714 | $58,554 |
| Median | $46,741 | $61,584 |
| Interquartile 25% (IQ1) | $42,258 | $42,717 |
| Interquartile 75% (IQ3) | $52,943 | $69,714 |
| Interquartile Range (IQR) | $10,685 | $26,997 |
| Standard Deviation (Sample) | $7,891 | $20,286 |
| Standard Deviation (Population) | $7,872 | $20,159 |
Similar Demographics by Householder Income Over 65 years
Demographics Similar to Blacks/African Americans by Householder Income Over 65 years
In terms of householder income over 65 years, the demographic groups most similar to Blacks/African Americans are Immigrants from Grenada ($50,747, a difference of 0.060%), Hopi ($50,925, a difference of 0.29%), Bahamian ($51,000, a difference of 0.44%), Pima ($50,539, a difference of 0.47%), and Dutch West Indian ($50,475, a difference of 0.60%).
| Demographics | Rating | Rank | Householder Income Over 65 years |
| British West Indians | 0.0 /100 | #322 | Tragic $51,463 |
| Cajuns | 0.0 /100 | #323 | Tragic $51,397 |
| Immigrants | Congo | 0.0 /100 | #324 | Tragic $51,393 |
| Immigrants | Haiti | 0.0 /100 | #325 | Tragic $51,219 |
| Kiowa | 0.0 /100 | #326 | Tragic $51,140 |
| Bahamians | 0.0 /100 | #327 | Tragic $51,000 |
| Hopi | 0.0 /100 | #328 | Tragic $50,925 |
| Blacks/African Americans | 0.0 /100 | #329 | Tragic $50,779 |
| Immigrants | Grenada | 0.0 /100 | #330 | Tragic $50,747 |
| Pima | 0.0 /100 | #331 | Tragic $50,539 |
| Dutch West Indians | 0.0 /100 | #332 | Tragic $50,475 |
| Cape Verdeans | 0.0 /100 | #333 | Tragic $50,077 |
| Immigrants | Dominica | 0.0 /100 | #334 | Tragic $50,071 |
| Crow | 0.0 /100 | #335 | Tragic $49,234 |
| Cubans | 0.0 /100 | #336 | Tragic $49,152 |
Demographics Similar to Lithuanians by Householder Income Over 65 years
In terms of householder income over 65 years, the demographic groups most similar to Lithuanians are Immigrants from Ethiopia ($65,238, a difference of 0.040%), Argentinean ($65,246, a difference of 0.060%), Greek ($65,306, a difference of 0.15%), Mongolian ($65,326, a difference of 0.18%), and Sierra Leonean ($65,038, a difference of 0.26%).
| Demographics | Rating | Rank | Householder Income Over 65 years |
| Immigrants | Malaysia | 99.1 /100 | #67 | Exceptional $65,497 |
| Egyptians | 99.1 /100 | #68 | Exceptional $65,441 |
| Samoans | 99.1 /100 | #69 | Exceptional $65,427 |
| Mongolians | 99.0 /100 | #70 | Exceptional $65,326 |
| Greeks | 98.9 /100 | #71 | Exceptional $65,306 |
| Argentineans | 98.9 /100 | #72 | Exceptional $65,246 |
| Immigrants | Ethiopia | 98.9 /100 | #73 | Exceptional $65,238 |
| Lithuanians | 98.8 /100 | #74 | Exceptional $65,209 |
| Sierra Leoneans | 98.6 /100 | #75 | Exceptional $65,038 |
| Ethiopians | 98.5 /100 | #76 | Exceptional $64,989 |
| Immigrants | Canada | 98.5 /100 | #77 | Exceptional $64,952 |
| Immigrants | Western Europe | 98.5 /100 | #78 | Exceptional $64,933 |
| Hawaiians | 98.4 /100 | #79 | Exceptional $64,920 |
| Immigrants | North America | 98.3 /100 | #80 | Exceptional $64,856 |
| Immigrants | Europe | 98.3 /100 | #81 | Exceptional $64,828 |