Black/African American vs Creek Householder Income Over 65 years
COMPARE
Black/African American
Creek
Householder Income Over 65 years
Householder Income Over 65 years Comparison
Blacks/African Americans
Creek
$50,779
HOUSEHOLDER INCOME OVER 65 YEARS
0.0/ 100
METRIC RATING
329th/ 347
METRIC RANK
$51,949
HOUSEHOLDER INCOME OVER 65 YEARS
0.0/ 100
METRIC RATING
316th/ 347
METRIC RANK
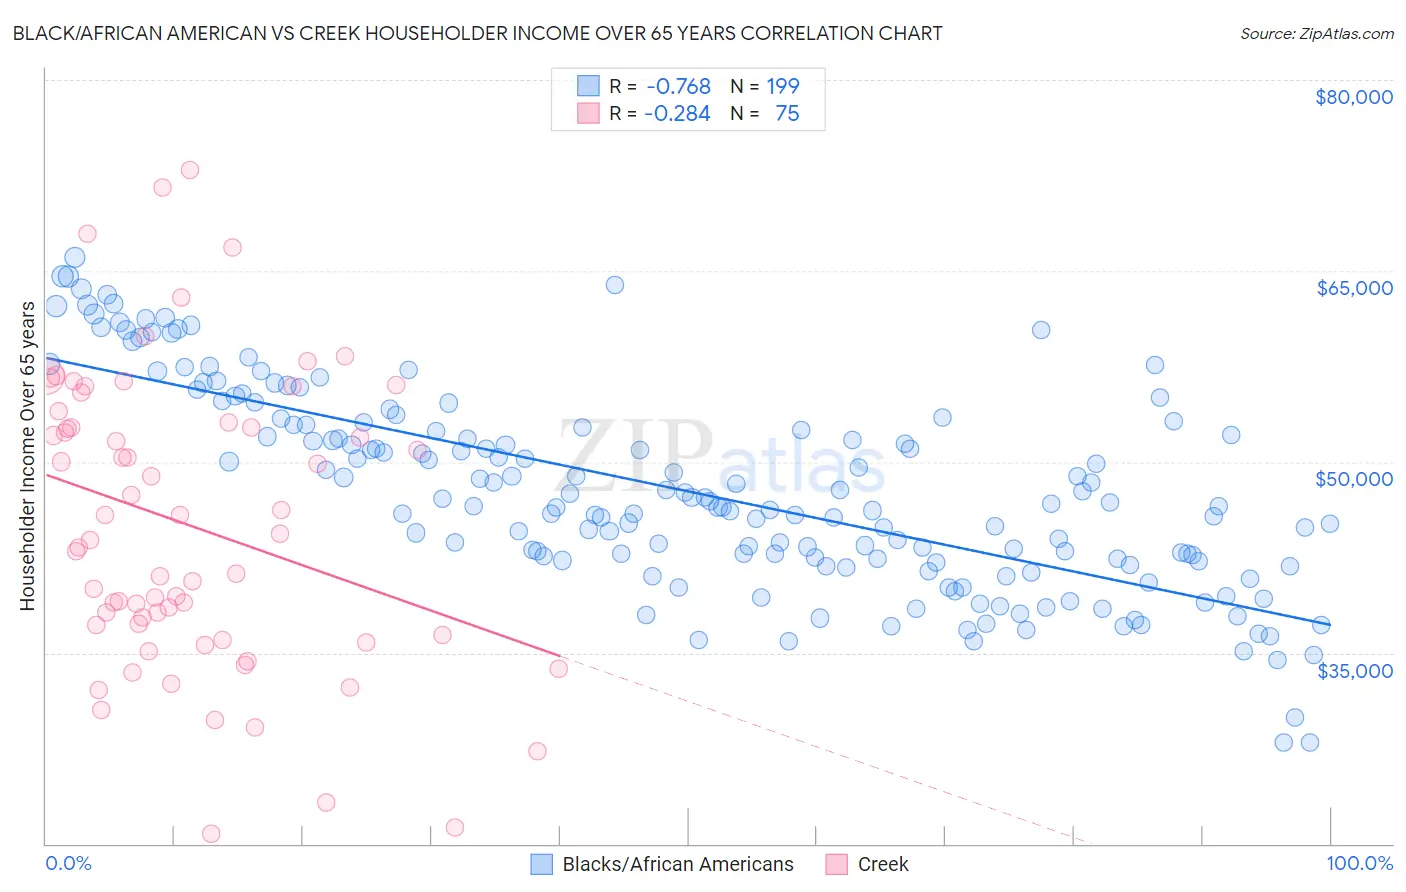
Black/African American vs Creek Householder Income Over 65 years Correlation Chart
The statistical analysis conducted on geographies consisting of 560,756,533 people shows a strong negative correlation between the proportion of Blacks/African Americans and household income with householder over the age of 65 in the United States with a correlation coefficient (R) of -0.768 and weighted average of $50,779. Similarly, the statistical analysis conducted on geographies consisting of 178,125,248 people shows a weak negative correlation between the proportion of Creek and household income with householder over the age of 65 in the United States with a correlation coefficient (R) of -0.284 and weighted average of $51,949, a difference of 2.3%.
Householder Income Over 65 years Correlation Summary
| Measurement | Black/African American | Creek |
| Minimum | $27,967 | $20,781 |
| Maximum | $66,084 | $72,903 |
| Range | $38,117 | $52,122 |
| Mean | $47,714 | $45,013 |
| Median | $46,741 | $43,886 |
| Interquartile 25% (IQ1) | $42,258 | $36,375 |
| Interquartile 75% (IQ3) | $52,943 | $53,125 |
| Interquartile Range (IQR) | $10,685 | $16,750 |
| Standard Deviation (Sample) | $7,891 | $11,525 |
| Standard Deviation (Population) | $7,872 | $11,448 |
Demographics Similar to Blacks/African Americans and Creek by Householder Income Over 65 years
In terms of householder income over 65 years, the demographic groups most similar to Blacks/African Americans are Immigrants from Grenada ($50,747, a difference of 0.060%), Hopi ($50,925, a difference of 0.29%), Bahamian ($51,000, a difference of 0.44%), Pima ($50,539, a difference of 0.47%), and Dutch West Indian ($50,475, a difference of 0.60%). Similarly, the demographic groups most similar to Creek are Immigrants from St. Vincent and the Grenadines ($51,922, a difference of 0.050%), Haitian ($51,912, a difference of 0.070%), Immigrants from Honduras ($51,888, a difference of 0.12%), U.S. Virgin Islander ($52,072, a difference of 0.24%), and Native/Alaskan ($52,081, a difference of 0.25%).
| Demographics | Rating | Rank | Householder Income Over 65 years |
| Immigrants | Azores | 0.0 /100 | #312 | Tragic $52,121 |
| Immigrants | Nicaragua | 0.0 /100 | #313 | Tragic $52,085 |
| Natives/Alaskans | 0.0 /100 | #314 | Tragic $52,081 |
| U.S. Virgin Islanders | 0.0 /100 | #315 | Tragic $52,072 |
| Creek | 0.0 /100 | #316 | Tragic $51,949 |
| Immigrants | St. Vincent and the Grenadines | 0.0 /100 | #317 | Tragic $51,922 |
| Haitians | 0.0 /100 | #318 | Tragic $51,912 |
| Immigrants | Honduras | 0.0 /100 | #319 | Tragic $51,888 |
| Colville | 0.0 /100 | #320 | Tragic $51,739 |
| Menominee | 0.0 /100 | #321 | Tragic $51,719 |
| British West Indians | 0.0 /100 | #322 | Tragic $51,463 |
| Cajuns | 0.0 /100 | #323 | Tragic $51,397 |
| Immigrants | Congo | 0.0 /100 | #324 | Tragic $51,393 |
| Immigrants | Haiti | 0.0 /100 | #325 | Tragic $51,219 |
| Kiowa | 0.0 /100 | #326 | Tragic $51,140 |
| Bahamians | 0.0 /100 | #327 | Tragic $51,000 |
| Hopi | 0.0 /100 | #328 | Tragic $50,925 |
| Blacks/African Americans | 0.0 /100 | #329 | Tragic $50,779 |
| Immigrants | Grenada | 0.0 /100 | #330 | Tragic $50,747 |
| Pima | 0.0 /100 | #331 | Tragic $50,539 |
| Dutch West Indians | 0.0 /100 | #332 | Tragic $50,475 |