Blackfeet vs French Canadian Wage/Income Gap
COMPARE
Blackfeet
French Canadian
Wage/Income Gap
Wage/Income Gap Comparison
Blackfeet
French Canadians
25.2%
WAGE/INCOME GAP
78.1/ 100
METRIC RATING
153rd/ 347
METRIC RANK
28.1%
WAGE/INCOME GAP
0.4/ 100
METRIC RATING
283rd/ 347
METRIC RANK
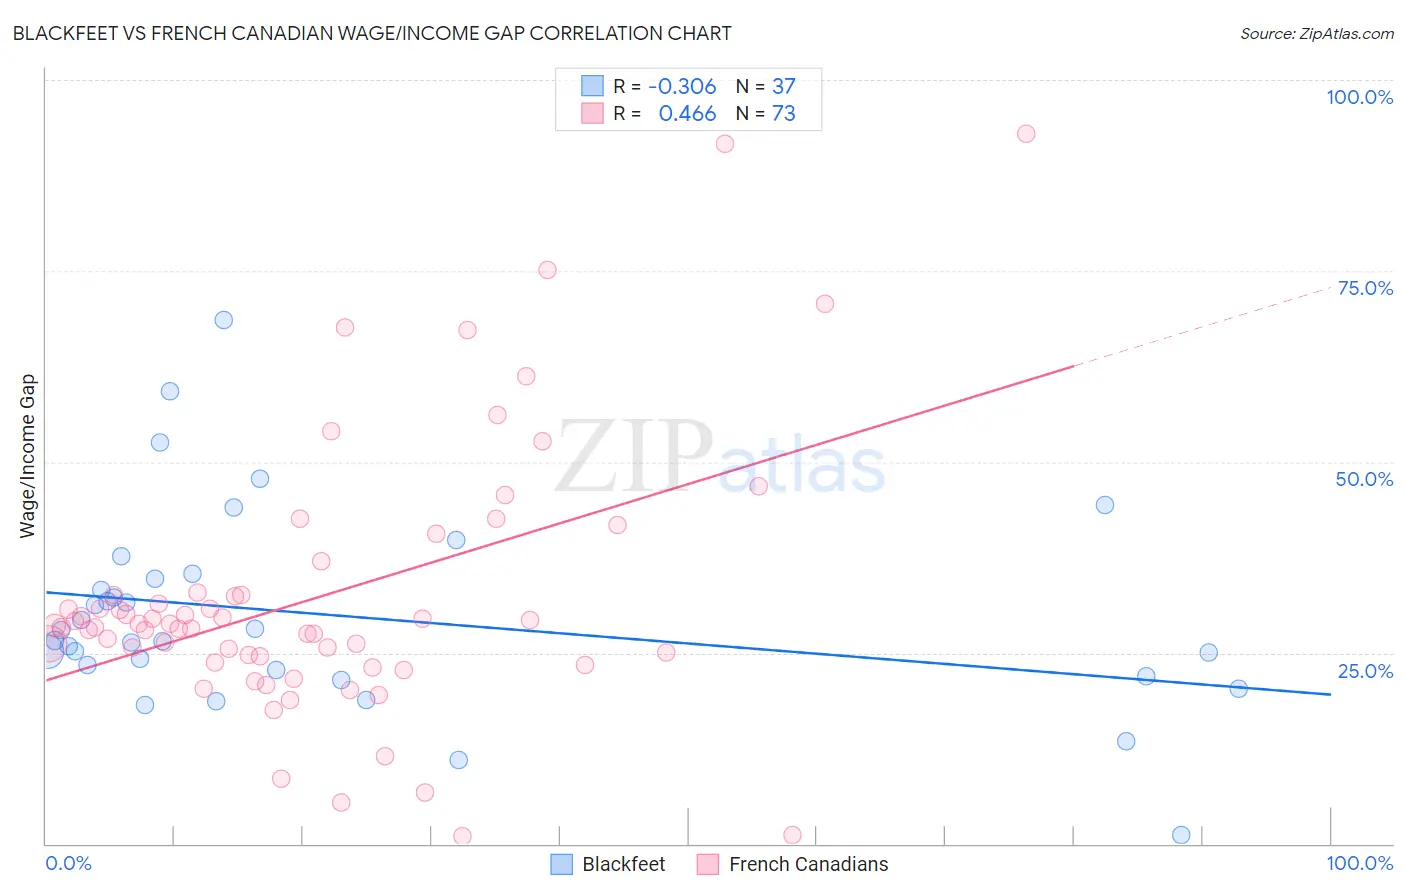
Blackfeet vs French Canadian Wage/Income Gap Correlation Chart
The statistical analysis conducted on geographies consisting of 309,305,291 people shows a mild negative correlation between the proportion of Blackfeet and wage/income gap percentage in the United States with a correlation coefficient (R) of -0.306 and weighted average of 25.2%. Similarly, the statistical analysis conducted on geographies consisting of 501,595,404 people shows a moderate positive correlation between the proportion of French Canadians and wage/income gap percentage in the United States with a correlation coefficient (R) of 0.466 and weighted average of 28.1%, a difference of 11.3%.
Wage/Income Gap Correlation Summary
| Measurement | Blackfeet | French Canadian |
| Minimum | 1.1% | 0.99% |
| Maximum | 68.6% | 92.9% |
| Range | 67.5% | 91.9% |
| Mean | 29.9% | 32.4% |
| Median | 26.6% | 28.6% |
| Interquartile 25% (IQ1) | 22.3% | 24.1% |
| Interquartile 75% (IQ3) | 35.0% | 32.8% |
| Interquartile Range (IQR) | 12.7% | 8.6% |
| Standard Deviation (Sample) | 13.1% | 17.7% |
| Standard Deviation (Population) | 12.9% | 17.6% |
Similar Demographics by Wage/Income Gap
Demographics Similar to Blackfeet by Wage/Income Gap
In terms of wage/income gap, the demographic groups most similar to Blackfeet are Immigrants from Northern Africa (25.2%, a difference of 0.010%), Immigrants from Vietnam (25.2%, a difference of 0.040%), Immigrants from Mexico (25.3%, a difference of 0.16%), Costa Rican (25.3%, a difference of 0.22%), and Uruguayan (25.2%, a difference of 0.32%).
| Demographics | Rating | Rank | Wage/Income Gap |
| South Americans | 85.2 /100 | #146 | Excellent 25.0% |
| Malaysians | 84.9 /100 | #147 | Excellent 25.0% |
| Iroquois | 83.9 /100 | #148 | Excellent 25.1% |
| Immigrants | Peru | 82.6 /100 | #149 | Excellent 25.1% |
| Immigrants | Immigrants | 82.3 /100 | #150 | Excellent 25.1% |
| Taiwanese | 81.6 /100 | #151 | Excellent 25.1% |
| Uruguayans | 81.3 /100 | #152 | Excellent 25.2% |
| Blackfeet | 78.1 /100 | #153 | Good 25.2% |
| Immigrants | Northern Africa | 78.1 /100 | #154 | Good 25.2% |
| Immigrants | Vietnam | 77.7 /100 | #155 | Good 25.2% |
| Immigrants | Mexico | 76.4 /100 | #156 | Good 25.3% |
| Costa Ricans | 75.8 /100 | #157 | Good 25.3% |
| Immigrants | Zimbabwe | 73.7 /100 | #158 | Good 25.3% |
| Puget Sound Salish | 73.0 /100 | #159 | Good 25.3% |
| French American Indians | 72.5 /100 | #160 | Good 25.4% |
Demographics Similar to French Canadians by Wage/Income Gap
In terms of wage/income gap, the demographic groups most similar to French Canadians are Immigrants from Sweden (28.1%, a difference of 0.010%), Italian (28.1%, a difference of 0.14%), Immigrants from Austria (28.1%, a difference of 0.17%), South African (28.0%, a difference of 0.18%), and Okinawan (28.1%, a difference of 0.20%).
| Demographics | Rating | Rank | Wage/Income Gap |
| Lebanese | 0.7 /100 | #276 | Tragic 27.9% |
| Latvians | 0.7 /100 | #277 | Tragic 27.9% |
| Immigrants | England | 0.6 /100 | #278 | Tragic 27.9% |
| Romanians | 0.5 /100 | #279 | Tragic 28.0% |
| Russians | 0.5 /100 | #280 | Tragic 28.0% |
| Burmese | 0.5 /100 | #281 | Tragic 28.0% |
| South Africans | 0.5 /100 | #282 | Tragic 28.0% |
| French Canadians | 0.4 /100 | #283 | Tragic 28.1% |
| Immigrants | Sweden | 0.4 /100 | #284 | Tragic 28.1% |
| Italians | 0.4 /100 | #285 | Tragic 28.1% |
| Immigrants | Austria | 0.4 /100 | #286 | Tragic 28.1% |
| Okinawans | 0.4 /100 | #287 | Tragic 28.1% |
| Choctaw | 0.4 /100 | #288 | Tragic 28.1% |
| Canadians | 0.3 /100 | #289 | Tragic 28.1% |
| Australians | 0.3 /100 | #290 | Tragic 28.2% |