Basque vs Immigrants from Brazil Median Earnings
COMPARE
Basque
Immigrants from Brazil
Median Earnings
Median Earnings Comparison
Basques
Immigrants from Brazil
$46,399
MEDIAN EARNINGS
48.8/ 100
METRIC RATING
175th/ 347
METRIC RANK
$49,463
MEDIAN EARNINGS
98.6/ 100
METRIC RATING
104th/ 347
METRIC RANK
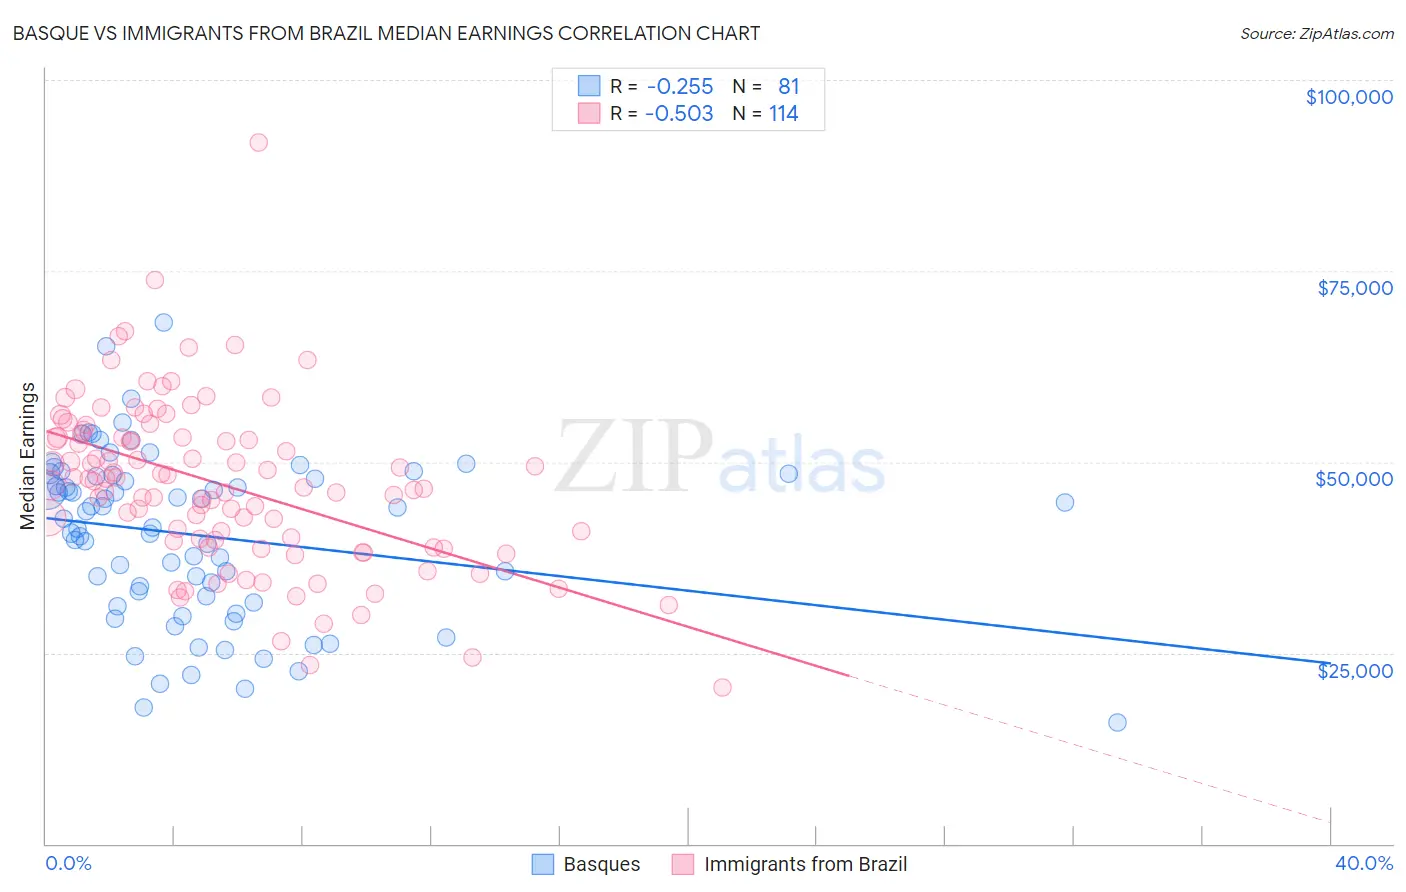
Basque vs Immigrants from Brazil Median Earnings Correlation Chart
The statistical analysis conducted on geographies consisting of 165,772,846 people shows a weak negative correlation between the proportion of Basques and median earnings in the United States with a correlation coefficient (R) of -0.255 and weighted average of $46,399. Similarly, the statistical analysis conducted on geographies consisting of 343,004,043 people shows a substantial negative correlation between the proportion of Immigrants from Brazil and median earnings in the United States with a correlation coefficient (R) of -0.503 and weighted average of $49,463, a difference of 6.6%.
Median Earnings Correlation Summary
| Measurement | Basque | Immigrants from Brazil |
| Minimum | $15,833 | $20,417 |
| Maximum | $68,304 | $91,768 |
| Range | $52,471 | $71,351 |
| Mean | $40,382 | $47,008 |
| Median | $42,566 | $47,178 |
| Interquartile 25% (IQ1) | $32,007 | $39,617 |
| Interquartile 75% (IQ3) | $48,221 | $53,219 |
| Interquartile Range (IQR) | $16,214 | $13,601 |
| Standard Deviation (Sample) | $10,903 | $10,976 |
| Standard Deviation (Population) | $10,835 | $10,928 |
Similar Demographics by Median Earnings
Demographics Similar to Basques by Median Earnings
In terms of median earnings, the demographic groups most similar to Basques are Danish ($46,392, a difference of 0.020%), Belgian ($46,375, a difference of 0.050%), Scandinavian ($46,433, a difference of 0.070%), Ghanaian ($46,440, a difference of 0.090%), and Colombian ($46,349, a difference of 0.11%).
| Demographics | Rating | Rank | Median Earnings |
| Immigrants | Africa | 54.6 /100 | #168 | Average $46,564 |
| Immigrants | South America | 54.0 /100 | #169 | Average $46,548 |
| Immigrants | Immigrants | 51.6 /100 | #170 | Average $46,478 |
| Scottish | 51.1 /100 | #171 | Average $46,463 |
| Kenyans | 51.0 /100 | #172 | Average $46,462 |
| Ghanaians | 50.3 /100 | #173 | Average $46,440 |
| Scandinavians | 50.0 /100 | #174 | Average $46,433 |
| Basques | 48.8 /100 | #175 | Average $46,399 |
| Danes | 48.6 /100 | #176 | Average $46,392 |
| Belgians | 48.0 /100 | #177 | Average $46,375 |
| Colombians | 47.1 /100 | #178 | Average $46,349 |
| English | 46.5 /100 | #179 | Average $46,334 |
| Puget Sound Salish | 46.5 /100 | #180 | Average $46,333 |
| Immigrants | Cameroon | 46.4 /100 | #181 | Average $46,329 |
| Swiss | 45.9 /100 | #182 | Average $46,315 |
Demographics Similar to Immigrants from Brazil by Median Earnings
In terms of median earnings, the demographic groups most similar to Immigrants from Brazil are Austrian ($49,501, a difference of 0.080%), Immigrants from Western Asia ($49,389, a difference of 0.15%), Immigrants from Albania ($49,377, a difference of 0.17%), Immigrants from Morocco ($49,368, a difference of 0.19%), and Ethiopian ($49,572, a difference of 0.22%).
| Demographics | Rating | Rank | Median Earnings |
| Immigrants | North Macedonia | 98.9 /100 | #97 | Exceptional $49,658 |
| Immigrants | Northern Africa | 98.9 /100 | #98 | Exceptional $49,648 |
| Immigrants | Afghanistan | 98.9 /100 | #99 | Exceptional $49,645 |
| Immigrants | Poland | 98.9 /100 | #100 | Exceptional $49,633 |
| Jordanians | 98.9 /100 | #101 | Exceptional $49,632 |
| Ethiopians | 98.8 /100 | #102 | Exceptional $49,572 |
| Austrians | 98.7 /100 | #103 | Exceptional $49,501 |
| Immigrants | Brazil | 98.6 /100 | #104 | Exceptional $49,463 |
| Immigrants | Western Asia | 98.4 /100 | #105 | Exceptional $49,389 |
| Immigrants | Albania | 98.4 /100 | #106 | Exceptional $49,377 |
| Immigrants | Morocco | 98.4 /100 | #107 | Exceptional $49,368 |
| Palestinians | 98.0 /100 | #108 | Exceptional $49,209 |
| Syrians | 97.1 /100 | #109 | Exceptional $48,934 |
| Immigrants | Ethiopia | 97.1 /100 | #110 | Exceptional $48,924 |
| Immigrants | Zimbabwe | 97.0 /100 | #111 | Exceptional $48,913 |