Basque vs Dutch West Indian Median Earnings
COMPARE
Basque
Dutch West Indian
Median Earnings
Median Earnings Comparison
Basques
Dutch West Indians
$46,399
MEDIAN EARNINGS
48.8/ 100
METRIC RATING
175th/ 347
METRIC RANK
$40,107
MEDIAN EARNINGS
0.0/ 100
METRIC RATING
318th/ 347
METRIC RANK
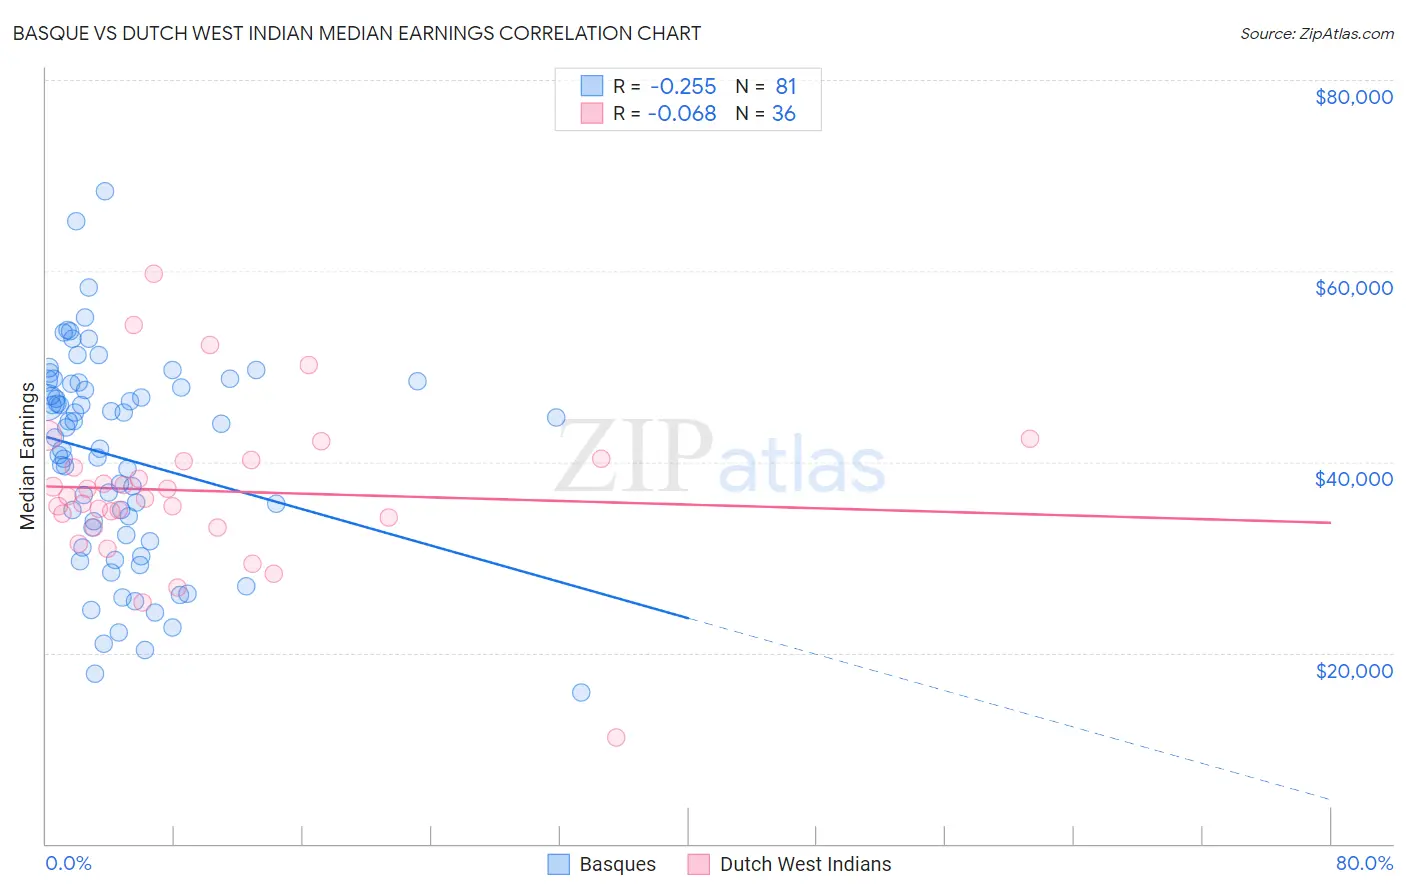
Basque vs Dutch West Indian Median Earnings Correlation Chart
The statistical analysis conducted on geographies consisting of 165,772,846 people shows a weak negative correlation between the proportion of Basques and median earnings in the United States with a correlation coefficient (R) of -0.255 and weighted average of $46,399. Similarly, the statistical analysis conducted on geographies consisting of 85,770,657 people shows a slight negative correlation between the proportion of Dutch West Indians and median earnings in the United States with a correlation coefficient (R) of -0.068 and weighted average of $40,107, a difference of 15.7%.
Median Earnings Correlation Summary
| Measurement | Basque | Dutch West Indian |
| Minimum | $15,833 | $11,071 |
| Maximum | $68,304 | $59,688 |
| Range | $52,471 | $48,617 |
| Mean | $40,382 | $36,968 |
| Median | $42,566 | $36,241 |
| Interquartile 25% (IQ1) | $32,007 | $33,646 |
| Interquartile 75% (IQ3) | $48,221 | $40,145 |
| Interquartile Range (IQR) | $16,214 | $6,499 |
| Standard Deviation (Sample) | $10,903 | $8,507 |
| Standard Deviation (Population) | $10,835 | $8,388 |
Similar Demographics by Median Earnings
Demographics Similar to Basques by Median Earnings
In terms of median earnings, the demographic groups most similar to Basques are Danish ($46,392, a difference of 0.020%), Belgian ($46,375, a difference of 0.050%), Scandinavian ($46,433, a difference of 0.070%), Ghanaian ($46,440, a difference of 0.090%), and Colombian ($46,349, a difference of 0.11%).
| Demographics | Rating | Rank | Median Earnings |
| Immigrants | Africa | 54.6 /100 | #168 | Average $46,564 |
| Immigrants | South America | 54.0 /100 | #169 | Average $46,548 |
| Immigrants | Immigrants | 51.6 /100 | #170 | Average $46,478 |
| Scottish | 51.1 /100 | #171 | Average $46,463 |
| Kenyans | 51.0 /100 | #172 | Average $46,462 |
| Ghanaians | 50.3 /100 | #173 | Average $46,440 |
| Scandinavians | 50.0 /100 | #174 | Average $46,433 |
| Basques | 48.8 /100 | #175 | Average $46,399 |
| Danes | 48.6 /100 | #176 | Average $46,392 |
| Belgians | 48.0 /100 | #177 | Average $46,375 |
| Colombians | 47.1 /100 | #178 | Average $46,349 |
| English | 46.5 /100 | #179 | Average $46,334 |
| Puget Sound Salish | 46.5 /100 | #180 | Average $46,333 |
| Immigrants | Cameroon | 46.4 /100 | #181 | Average $46,329 |
| Swiss | 45.9 /100 | #182 | Average $46,315 |
Demographics Similar to Dutch West Indians by Median Earnings
In terms of median earnings, the demographic groups most similar to Dutch West Indians are Black/African American ($40,085, a difference of 0.060%), Fijian ($40,193, a difference of 0.21%), Immigrants from Honduras ($40,195, a difference of 0.22%), Cheyenne ($40,233, a difference of 0.31%), and Seminole ($40,233, a difference of 0.31%).
| Demographics | Rating | Rank | Median Earnings |
| Hispanics or Latinos | 0.0 /100 | #311 | Tragic $40,288 |
| Chippewa | 0.0 /100 | #312 | Tragic $40,287 |
| Choctaw | 0.0 /100 | #313 | Tragic $40,270 |
| Cheyenne | 0.0 /100 | #314 | Tragic $40,233 |
| Seminole | 0.0 /100 | #315 | Tragic $40,233 |
| Immigrants | Honduras | 0.0 /100 | #316 | Tragic $40,195 |
| Fijians | 0.0 /100 | #317 | Tragic $40,193 |
| Dutch West Indians | 0.0 /100 | #318 | Tragic $40,107 |
| Blacks/African Americans | 0.0 /100 | #319 | Tragic $40,085 |
| Immigrants | Bahamas | 0.0 /100 | #320 | Tragic $39,861 |
| Mexicans | 0.0 /100 | #321 | Tragic $39,834 |
| Immigrants | Central America | 0.0 /100 | #322 | Tragic $39,762 |
| Bahamians | 0.0 /100 | #323 | Tragic $39,735 |
| Ottawa | 0.0 /100 | #324 | Tragic $39,721 |
| Creek | 0.0 /100 | #325 | Tragic $39,648 |