Alaskan Athabascan vs Spanish American Median Earnings
COMPARE
Alaskan Athabascan
Spanish American
Median Earnings
Median Earnings Comparison
Alaskan Athabascans
Spanish Americans
$43,393
MEDIAN EARNINGS
1.4/ 100
METRIC RATING
256th/ 347
METRIC RANK
$42,316
MEDIAN EARNINGS
0.3/ 100
METRIC RATING
276th/ 347
METRIC RANK
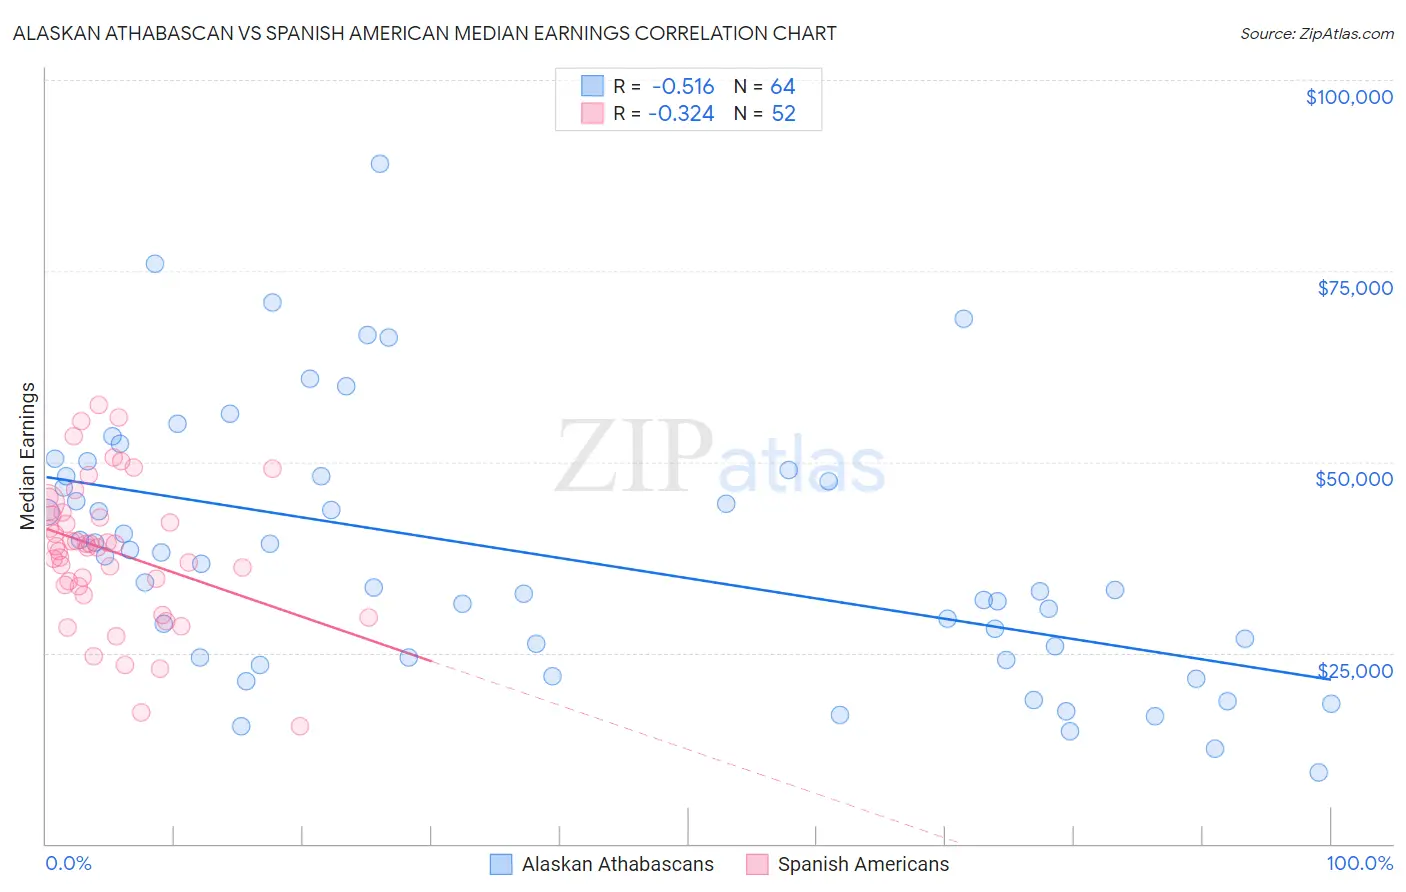
Alaskan Athabascan vs Spanish American Median Earnings Correlation Chart
The statistical analysis conducted on geographies consisting of 45,815,417 people shows a substantial negative correlation between the proportion of Alaskan Athabascans and median earnings in the United States with a correlation coefficient (R) of -0.516 and weighted average of $43,393. Similarly, the statistical analysis conducted on geographies consisting of 103,163,926 people shows a mild negative correlation between the proportion of Spanish Americans and median earnings in the United States with a correlation coefficient (R) of -0.324 and weighted average of $42,316, a difference of 2.5%.
Median Earnings Correlation Summary
| Measurement | Alaskan Athabascan | Spanish American |
| Minimum | $9,375 | $15,345 |
| Maximum | $89,063 | $57,404 |
| Range | $79,688 | $42,059 |
| Mean | $37,849 | $38,311 |
| Median | $35,412 | $38,863 |
| Interquartile 25% (IQ1) | $24,340 | $33,792 |
| Interquartile 75% (IQ3) | $48,159 | $43,155 |
| Interquartile Range (IQR) | $23,819 | $9,363 |
| Standard Deviation (Sample) | $17,033 | $9,272 |
| Standard Deviation (Population) | $16,899 | $9,182 |
Demographics Similar to Alaskan Athabascans and Spanish Americans by Median Earnings
In terms of median earnings, the demographic groups most similar to Alaskan Athabascans are Jamaican ($43,343, a difference of 0.12%), French American Indian ($43,333, a difference of 0.14%), German Russian ($43,200, a difference of 0.45%), Immigrants from Somalia ($43,100, a difference of 0.68%), and Immigrants from Jamaica ($43,026, a difference of 0.85%). Similarly, the demographic groups most similar to Spanish Americans are Immigrants from Belize ($42,339, a difference of 0.060%), Immigrants from El Salvador ($42,413, a difference of 0.23%), Immigrants from Dominica ($42,420, a difference of 0.25%), Iroquois ($42,430, a difference of 0.27%), and Pennsylvania German ($42,615, a difference of 0.71%).
| Demographics | Rating | Rank | Median Earnings |
| Alaskan Athabascans | 1.4 /100 | #256 | Tragic $43,393 |
| Jamaicans | 1.3 /100 | #257 | Tragic $43,343 |
| French American Indians | 1.3 /100 | #258 | Tragic $43,333 |
| German Russians | 1.1 /100 | #259 | Tragic $43,200 |
| Immigrants | Somalia | 0.9 /100 | #260 | Tragic $43,100 |
| Immigrants | Jamaica | 0.8 /100 | #261 | Tragic $43,026 |
| Nicaraguans | 0.8 /100 | #262 | Tragic $43,026 |
| Inupiat | 0.8 /100 | #263 | Tragic $43,000 |
| Immigrants | Liberia | 0.7 /100 | #264 | Tragic $42,923 |
| Salvadorans | 0.7 /100 | #265 | Tragic $42,912 |
| Immigrants | Laos | 0.7 /100 | #266 | Tragic $42,884 |
| Cree | 0.6 /100 | #267 | Tragic $42,777 |
| Americans | 0.6 /100 | #268 | Tragic $42,742 |
| Belizeans | 0.5 /100 | #269 | Tragic $42,702 |
| Osage | 0.5 /100 | #270 | Tragic $42,651 |
| Pennsylvania Germans | 0.5 /100 | #271 | Tragic $42,615 |
| Iroquois | 0.4 /100 | #272 | Tragic $42,430 |
| Immigrants | Dominica | 0.4 /100 | #273 | Tragic $42,420 |
| Immigrants | El Salvador | 0.4 /100 | #274 | Tragic $42,413 |
| Immigrants | Belize | 0.3 /100 | #275 | Tragic $42,339 |
| Spanish Americans | 0.3 /100 | #276 | Tragic $42,316 |