Alaskan Athabascan vs Immigrants from Uruguay Median Earnings
COMPARE
Alaskan Athabascan
Immigrants from Uruguay
Median Earnings
Median Earnings Comparison
Alaskan Athabascans
Immigrants from Uruguay
$43,393
MEDIAN EARNINGS
1.4/ 100
METRIC RATING
256th/ 347
METRIC RANK
$45,682
MEDIAN EARNINGS
25.9/ 100
METRIC RATING
204th/ 347
METRIC RANK
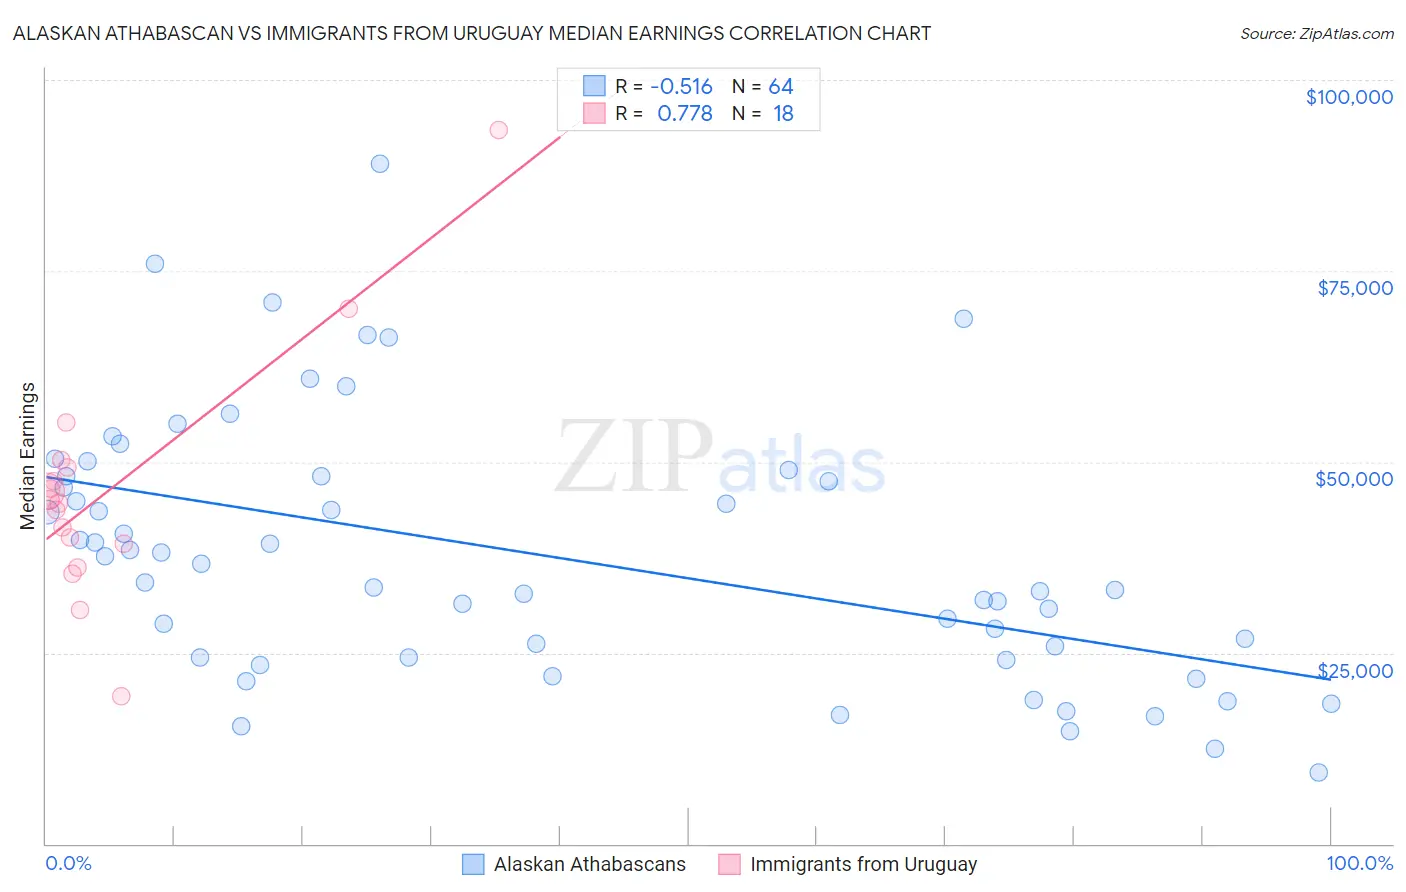
Alaskan Athabascan vs Immigrants from Uruguay Median Earnings Correlation Chart
The statistical analysis conducted on geographies consisting of 45,815,417 people shows a substantial negative correlation between the proportion of Alaskan Athabascans and median earnings in the United States with a correlation coefficient (R) of -0.516 and weighted average of $43,393. Similarly, the statistical analysis conducted on geographies consisting of 133,259,667 people shows a strong positive correlation between the proportion of Immigrants from Uruguay and median earnings in the United States with a correlation coefficient (R) of 0.778 and weighted average of $45,682, a difference of 5.3%.
Median Earnings Correlation Summary
| Measurement | Alaskan Athabascan | Immigrants from Uruguay |
| Minimum | $9,375 | $19,375 |
| Maximum | $89,063 | $93,387 |
| Range | $79,688 | $74,012 |
| Mean | $37,849 | $46,310 |
| Median | $35,412 | $44,791 |
| Interquartile 25% (IQ1) | $24,340 | $39,250 |
| Interquartile 75% (IQ3) | $48,159 | $49,312 |
| Interquartile Range (IQR) | $23,819 | $10,062 |
| Standard Deviation (Sample) | $17,033 | $15,725 |
| Standard Deviation (Population) | $16,899 | $15,282 |
Similar Demographics by Median Earnings
Demographics Similar to Alaskan Athabascans by Median Earnings
In terms of median earnings, the demographic groups most similar to Alaskan Athabascans are Immigrants from Middle Africa ($43,416, a difference of 0.050%), Jamaican ($43,343, a difference of 0.12%), French American Indian ($43,333, a difference of 0.14%), Liberian ($43,536, a difference of 0.33%), and Somali ($43,567, a difference of 0.40%).
| Demographics | Rating | Rank | Median Earnings |
| Malaysians | 2.6 /100 | #249 | Tragic $43,844 |
| Alaska Natives | 2.3 /100 | #250 | Tragic $43,750 |
| Tsimshian | 2.1 /100 | #251 | Tragic $43,695 |
| Hawaiians | 2.0 /100 | #252 | Tragic $43,673 |
| Somalis | 1.8 /100 | #253 | Tragic $43,567 |
| Liberians | 1.7 /100 | #254 | Tragic $43,536 |
| Immigrants | Middle Africa | 1.4 /100 | #255 | Tragic $43,416 |
| Alaskan Athabascans | 1.4 /100 | #256 | Tragic $43,393 |
| Jamaicans | 1.3 /100 | #257 | Tragic $43,343 |
| French American Indians | 1.3 /100 | #258 | Tragic $43,333 |
| German Russians | 1.1 /100 | #259 | Tragic $43,200 |
| Immigrants | Somalia | 0.9 /100 | #260 | Tragic $43,100 |
| Immigrants | Jamaica | 0.8 /100 | #261 | Tragic $43,026 |
| Nicaraguans | 0.8 /100 | #262 | Tragic $43,026 |
| Inupiat | 0.8 /100 | #263 | Tragic $43,000 |
Demographics Similar to Immigrants from Uruguay by Median Earnings
In terms of median earnings, the demographic groups most similar to Immigrants from Uruguay are Tongan ($45,665, a difference of 0.040%), Welsh ($45,710, a difference of 0.060%), Immigrants from Ghana ($45,641, a difference of 0.090%), Immigrants from Trinidad and Tobago ($45,729, a difference of 0.10%), and Celtic ($45,732, a difference of 0.11%).
| Demographics | Rating | Rank | Median Earnings |
| Barbadians | 30.5 /100 | #197 | Fair $45,846 |
| Trinidadians and Tobagonians | 29.7 /100 | #198 | Fair $45,820 |
| Immigrants | Barbados | 29.6 /100 | #199 | Fair $45,816 |
| Immigrants | Azores | 29.5 /100 | #200 | Fair $45,812 |
| Celtics | 27.2 /100 | #201 | Fair $45,732 |
| Immigrants | Trinidad and Tobago | 27.1 /100 | #202 | Fair $45,729 |
| Welsh | 26.6 /100 | #203 | Fair $45,710 |
| Immigrants | Uruguay | 25.9 /100 | #204 | Fair $45,682 |
| Tongans | 25.4 /100 | #205 | Fair $45,665 |
| Immigrants | Ghana | 24.8 /100 | #206 | Fair $45,641 |
| Immigrants | Senegal | 24.0 /100 | #207 | Fair $45,611 |
| Immigrants | Bosnia and Herzegovina | 23.7 /100 | #208 | Fair $45,600 |
| Immigrants | Thailand | 23.7 /100 | #209 | Fair $45,598 |
| Immigrants | Grenada | 23.6 /100 | #210 | Fair $45,596 |
| Panamanians | 23.5 /100 | #211 | Fair $45,593 |