Alaska Native vs Zimbabwean Wage/Income Gap
COMPARE
Alaska Native
Zimbabwean
Wage/Income Gap
Wage/Income Gap Comparison
Alaska Natives
Zimbabweans
24.4%
WAGE/INCOME GAP
96.0/ 100
METRIC RATING
116th/ 347
METRIC RANK
26.3%
WAGE/INCOME GAP
21.6/ 100
METRIC RATING
197th/ 347
METRIC RANK
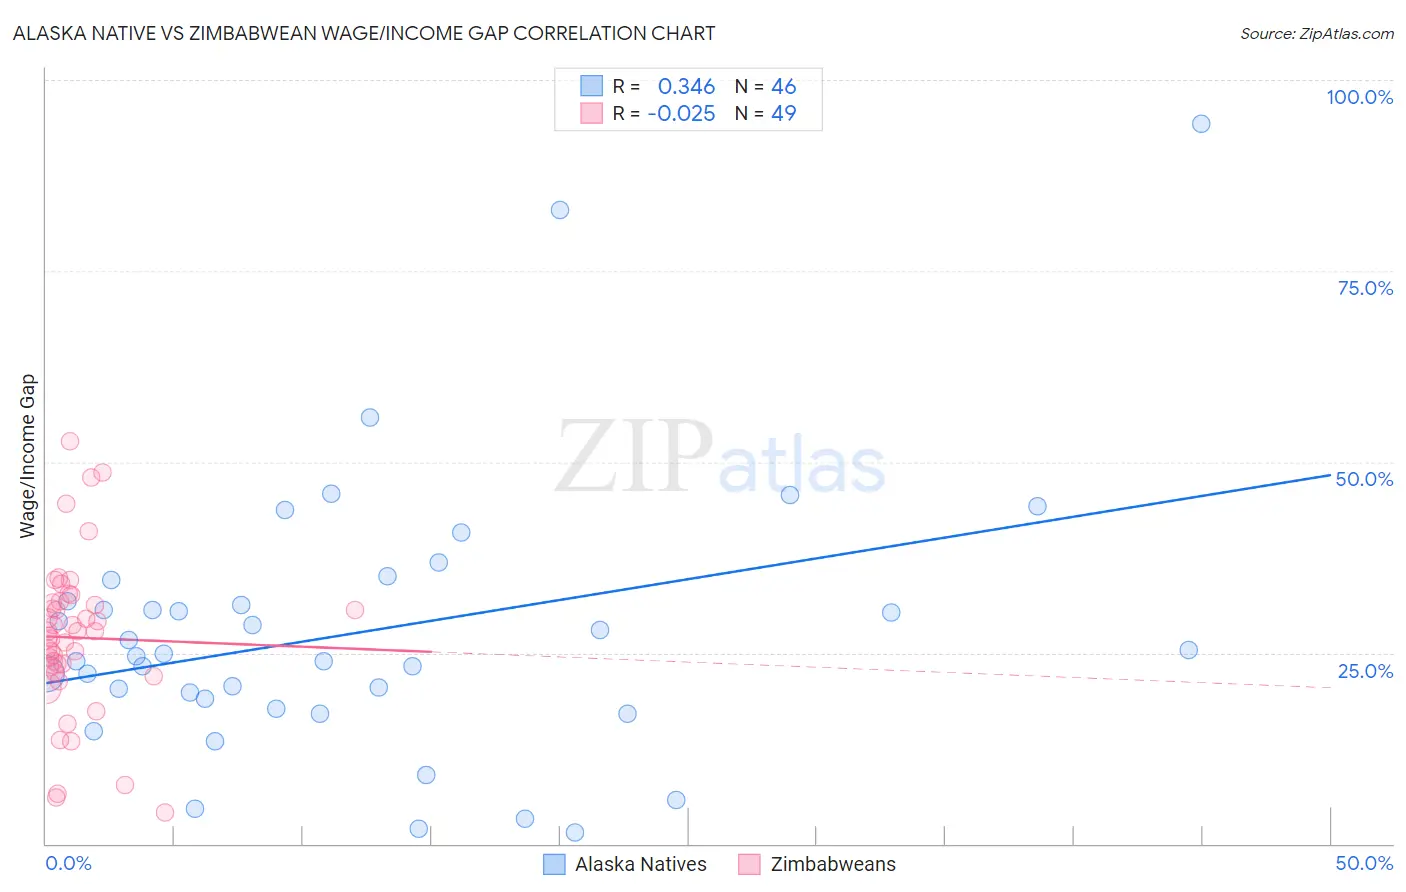
Alaska Native vs Zimbabwean Wage/Income Gap Correlation Chart
The statistical analysis conducted on geographies consisting of 76,725,822 people shows a mild positive correlation between the proportion of Alaska Natives and wage/income gap percentage in the United States with a correlation coefficient (R) of 0.346 and weighted average of 24.4%. Similarly, the statistical analysis conducted on geographies consisting of 69,207,398 people shows no correlation between the proportion of Zimbabweans and wage/income gap percentage in the United States with a correlation coefficient (R) of -0.025 and weighted average of 26.3%, a difference of 7.7%.
Wage/Income Gap Correlation Summary
| Measurement | Alaska Native | Zimbabwean |
| Minimum | 1.4% | 4.0% |
| Maximum | 94.2% | 52.7% |
| Range | 92.8% | 48.7% |
| Mean | 27.7% | 27.0% |
| Median | 24.7% | 27.8% |
| Interquartile 25% (IQ1) | 18.9% | 22.8% |
| Interquartile 75% (IQ3) | 31.7% | 31.6% |
| Interquartile Range (IQR) | 12.8% | 8.8% |
| Standard Deviation (Sample) | 17.8% | 10.2% |
| Standard Deviation (Population) | 17.6% | 10.1% |
Similar Demographics by Wage/Income Gap
Demographics Similar to Alaska Natives by Wage/Income Gap
In terms of wage/income gap, the demographic groups most similar to Alaska Natives are Immigrants from Afghanistan (24.4%, a difference of 0.060%), Immigrants from Micronesia (24.4%, a difference of 0.090%), Kenyan (24.5%, a difference of 0.11%), Immigrants from Kenya (24.4%, a difference of 0.17%), and Cree (24.5%, a difference of 0.19%).
| Demographics | Rating | Rank | Wage/Income Gap |
| Ugandans | 98.3 /100 | #109 | Exceptional 24.1% |
| Immigrants | Morocco | 98.1 /100 | #110 | Exceptional 24.1% |
| Soviet Union | 97.6 /100 | #111 | Exceptional 24.2% |
| Immigrants | Colombia | 97.0 /100 | #112 | Exceptional 24.3% |
| Sioux | 96.9 /100 | #113 | Exceptional 24.3% |
| Panamanians | 96.5 /100 | #114 | Exceptional 24.4% |
| Immigrants | Kenya | 96.4 /100 | #115 | Exceptional 24.4% |
| Alaska Natives | 96.0 /100 | #116 | Exceptional 24.4% |
| Immigrants | Afghanistan | 95.9 /100 | #117 | Exceptional 24.4% |
| Immigrants | Micronesia | 95.8 /100 | #118 | Exceptional 24.4% |
| Kenyans | 95.8 /100 | #119 | Exceptional 24.5% |
| Cree | 95.6 /100 | #120 | Exceptional 24.5% |
| Immigrants | Thailand | 94.9 /100 | #121 | Exceptional 24.5% |
| Apache | 94.8 /100 | #122 | Exceptional 24.5% |
| Natives/Alaskans | 94.6 /100 | #123 | Exceptional 24.6% |
Demographics Similar to Zimbabweans by Wage/Income Gap
In terms of wage/income gap, the demographic groups most similar to Zimbabweans are Immigrants from Western Asia (26.3%, a difference of 0.010%), Venezuelan (26.3%, a difference of 0.010%), Immigrants from Malaysia (26.3%, a difference of 0.060%), Dutch West Indian (26.3%, a difference of 0.060%), and Immigrants from Jordan (26.3%, a difference of 0.070%).
| Demographics | Rating | Rank | Wage/Income Gap |
| Immigrants | Croatia | 24.8 /100 | #190 | Fair 26.2% |
| Immigrants | Venezuela | 24.7 /100 | #191 | Fair 26.2% |
| Immigrants | Bulgaria | 22.5 /100 | #192 | Fair 26.3% |
| Immigrants | Jordan | 22.4 /100 | #193 | Fair 26.3% |
| Chileans | 22.3 /100 | #194 | Fair 26.3% |
| Immigrants | Malaysia | 22.2 /100 | #195 | Fair 26.3% |
| Immigrants | Western Asia | 21.7 /100 | #196 | Fair 26.3% |
| Zimbabweans | 21.6 /100 | #197 | Fair 26.3% |
| Venezuelans | 21.5 /100 | #198 | Fair 26.3% |
| Dutch West Indians | 21.0 /100 | #199 | Fair 26.3% |
| Delaware | 20.9 /100 | #200 | Fair 26.3% |
| Immigrants | Syria | 19.3 /100 | #201 | Poor 26.4% |
| Laotians | 19.2 /100 | #202 | Poor 26.4% |
| Immigrants | Eastern Europe | 19.2 /100 | #203 | Poor 26.4% |
| Immigrants | Russia | 19.0 /100 | #204 | Poor 26.4% |