Zip Codes with the Highest Percentage of Population Employed in Agriculture, Fishing & Hunting in Greenwood, IN
RELATED REPORTS & OPTIONS
Agriculture, Fishing & Hunting
Greenwood
Compare Zip Codes
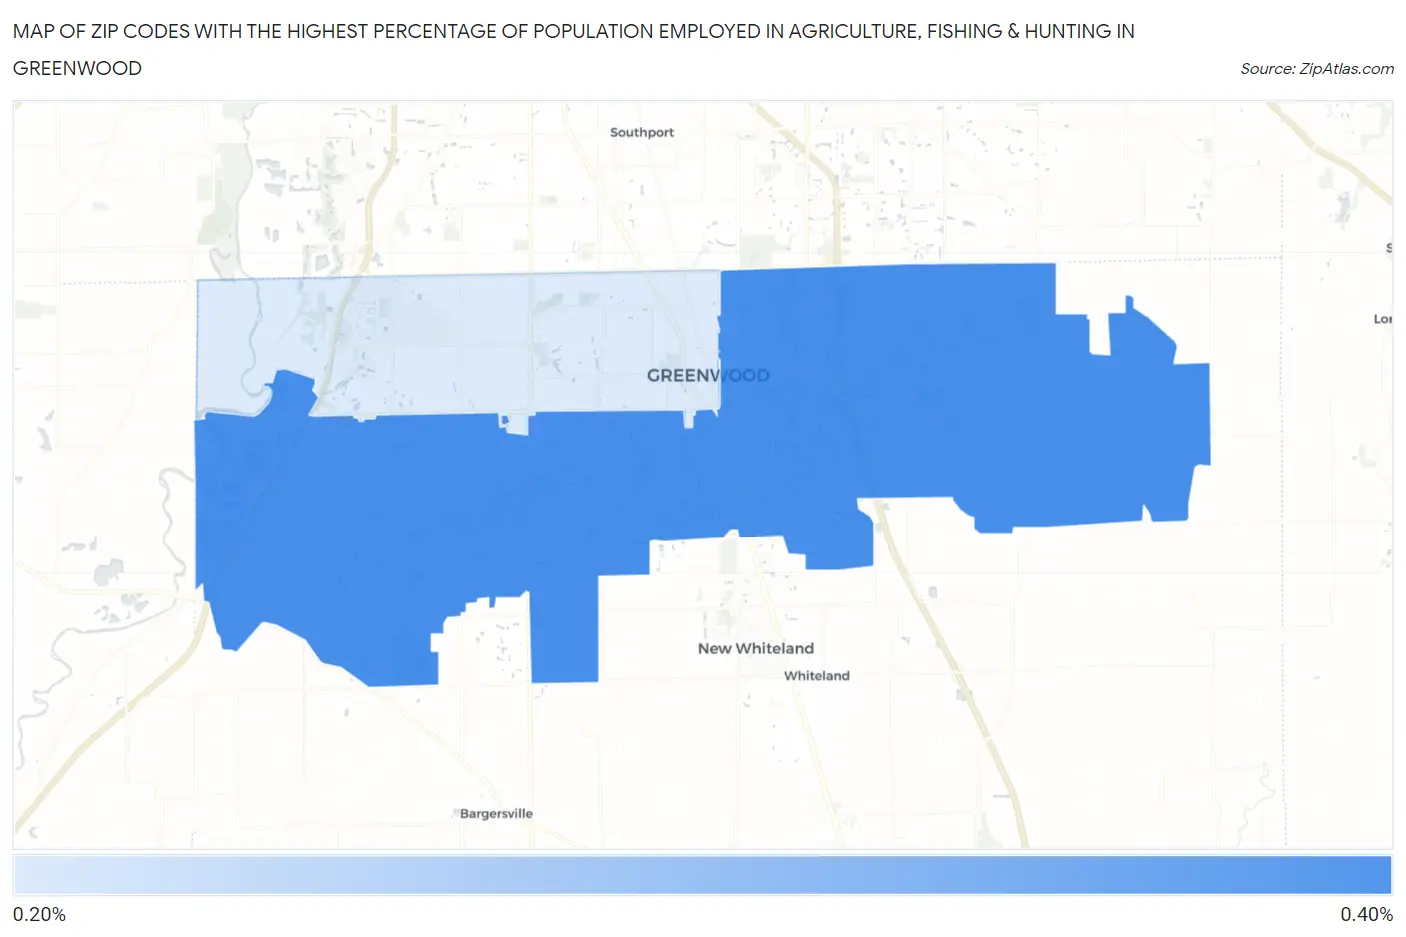
Map of Zip Codes with the Highest Percentage of Population Employed in Agriculture, Fishing & Hunting in Greenwood
0.0%
0.40%
Zip Codes with the Highest Percentage of Population Employed in Agriculture, Fishing & Hunting in Greenwood, IN
| Zip Code | % Employed | vs State | vs National | |
| 1. | 46143 | 0.34% | 1.1%(-0.715)#508 | 1.2%(-0.857)#20,722 |
| 2. | 46142 | 0.22% | 1.1%(-0.833)#543 | 1.2%(-0.976)#22,062 |
1
Common Questions
What are the Top Zip Codes with the Highest Percentage of Population Employed in Agriculture, Fishing & Hunting in Greenwood, IN?
Top Zip Codes with the Highest Percentage of Population Employed in Agriculture, Fishing & Hunting in Greenwood, IN are:
What zip code has the Highest Percentage of Population Employed in Agriculture, Fishing & Hunting in Greenwood, IN?
46143 has the Highest Percentage of Population Employed in Agriculture, Fishing & Hunting in Greenwood, IN with 0.34%.
What is the Percentage of Population Employed in Agriculture, Fishing & Hunting in Greenwood, IN?
Percentage of Population Employed in Agriculture, Fishing & Hunting in Greenwood is 0.34%.
What is the Percentage of Population Employed in Agriculture, Fishing & Hunting in Indiana?
Percentage of Population Employed in Agriculture, Fishing & Hunting in Indiana is 1.1%.
What is the Percentage of Population Employed in Agriculture, Fishing & Hunting in the United States?
Percentage of Population Employed in Agriculture, Fishing & Hunting in the United States is 1.2%.