Zip Codes with the Highest Percentage of Population Employed in Arts, Entertainment & Recreation in Evanston, IL
RELATED REPORTS & OPTIONS
Arts, Entertainment & Recreation
Evanston
Compare Zip Codes
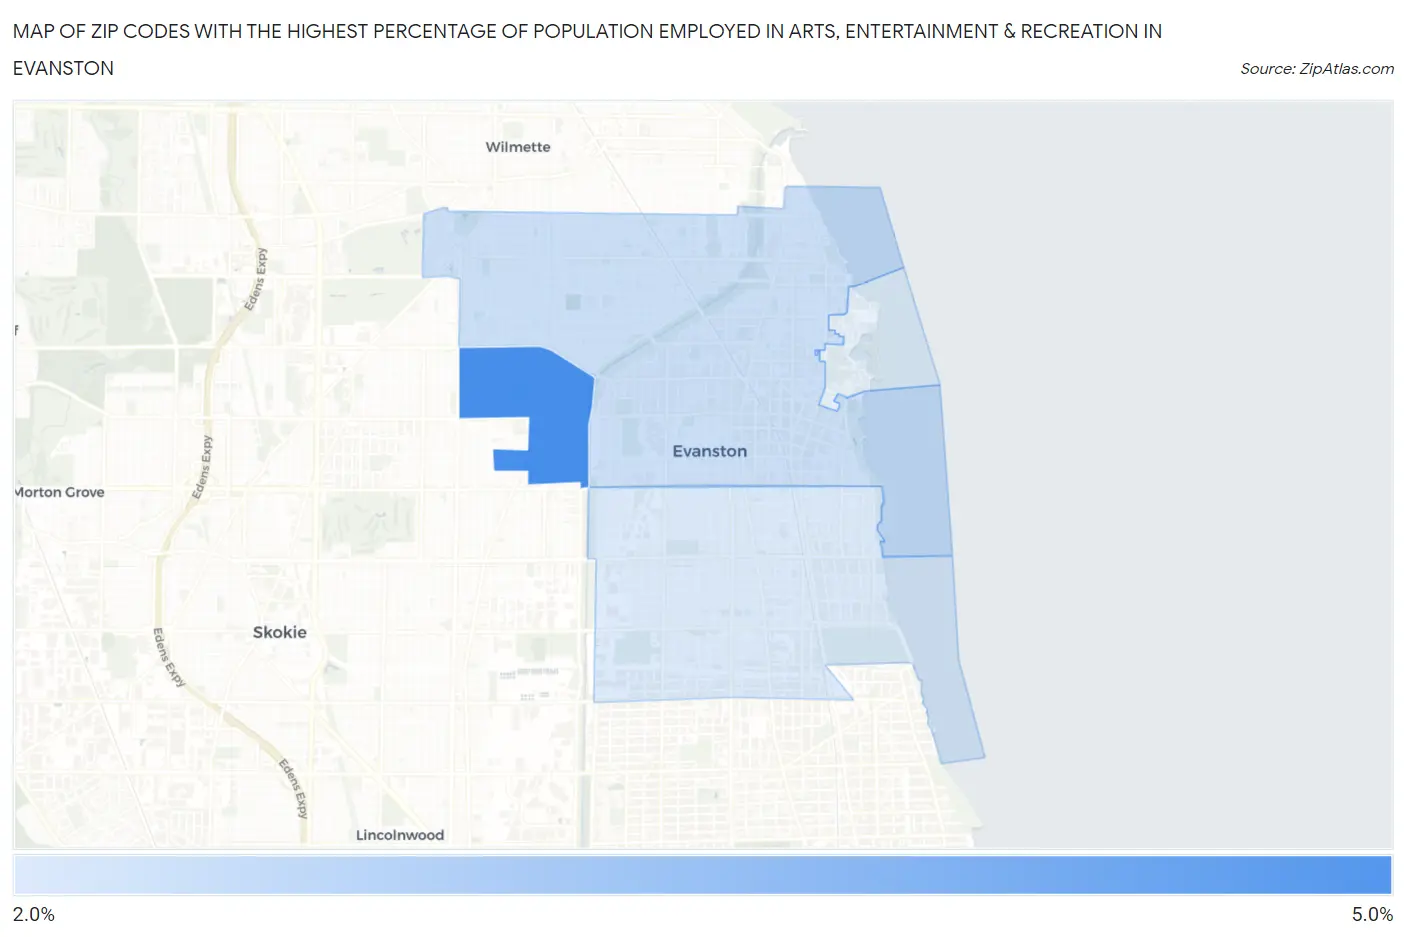
Map of Zip Codes with the Highest Percentage of Population Employed in Arts, Entertainment & Recreation in Evanston
0.0%
5.0%
Zip Codes with the Highest Percentage of Population Employed in Arts, Entertainment & Recreation in Evanston, IL
| Zip Code | % Employed | vs State | vs National | |
| 1. | 60203 | 4.9% | 1.9%(+2.92)#42 | 2.1%(+2.77)#2,394 |
| 2. | 60201 | 2.7% | 1.9%(+0.735)#188 | 2.1%(+0.587)#6,488 |
| 3. | 60202 | 2.4% | 1.9%(+0.456)#238 | 2.1%(+0.309)#7,680 |
1
Common Questions
What are the Top 3 Zip Codes with the Highest Percentage of Population Employed in Arts, Entertainment & Recreation in Evanston, IL?
Top 3 Zip Codes with the Highest Percentage of Population Employed in Arts, Entertainment & Recreation in Evanston, IL are:
What zip code has the Highest Percentage of Population Employed in Arts, Entertainment & Recreation in Evanston, IL?
60203 has the Highest Percentage of Population Employed in Arts, Entertainment & Recreation in Evanston, IL with 4.9%.
What is the Percentage of Population Employed in Arts, Entertainment & Recreation in Evanston, IL?
Percentage of Population Employed in Arts, Entertainment & Recreation in Evanston is 2.5%.
What is the Percentage of Population Employed in Arts, Entertainment & Recreation in Illinois?
Percentage of Population Employed in Arts, Entertainment & Recreation in Illinois is 1.9%.
What is the Percentage of Population Employed in Arts, Entertainment & Recreation in the United States?
Percentage of Population Employed in Arts, Entertainment & Recreation in the United States is 2.1%.