Zip Codes with the Highest Percentage of Population Employed in Arts, Entertainment & Recreation in Des Plaines, IL
RELATED REPORTS & OPTIONS
Arts, Entertainment & Recreation
Des Plaines
Compare Zip Codes
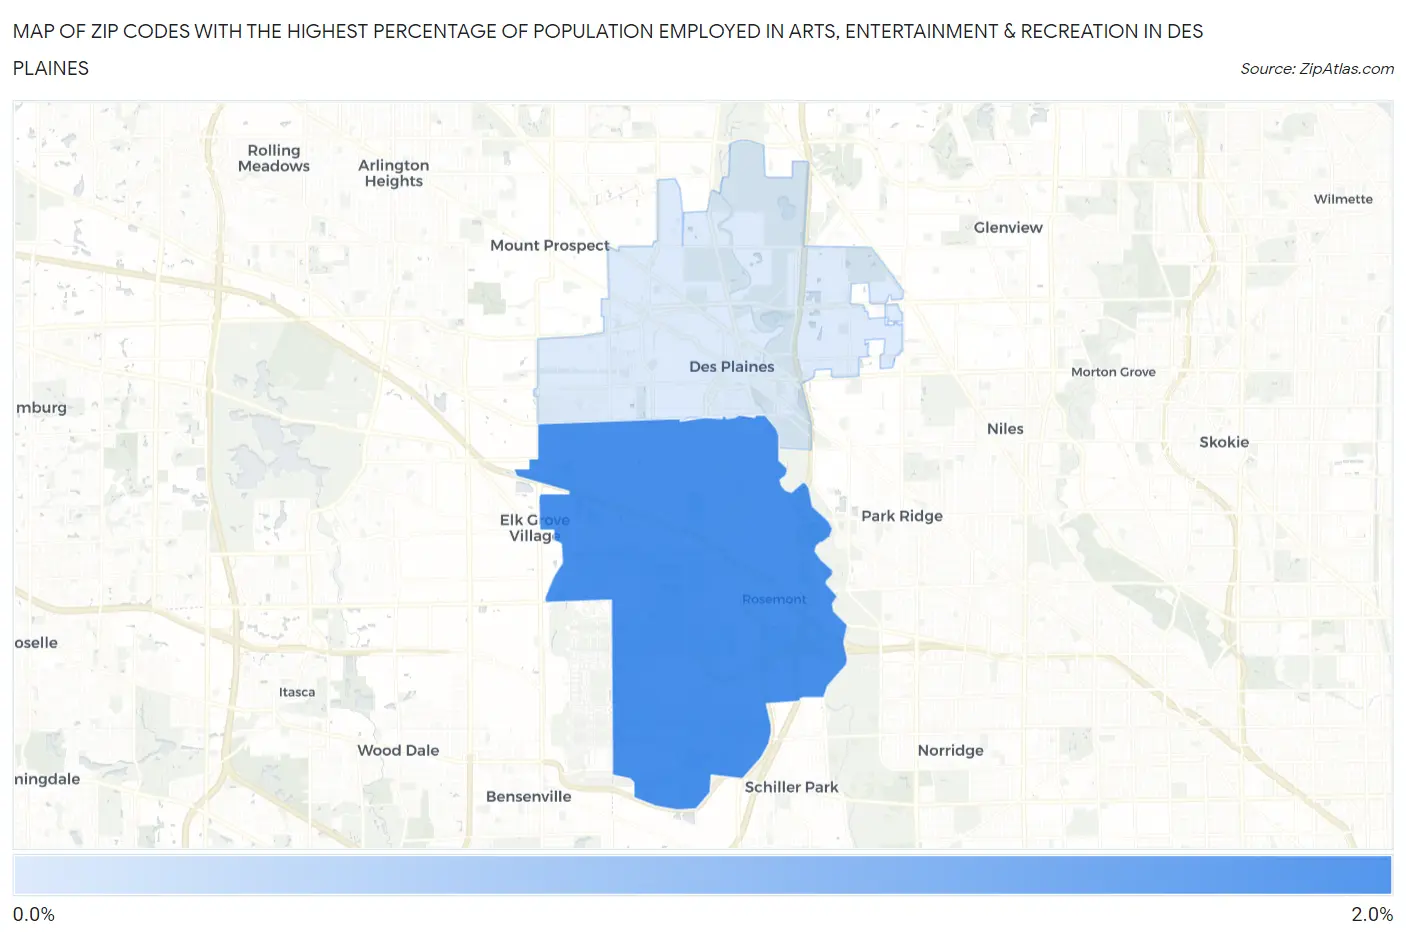
Map of Zip Codes with the Highest Percentage of Population Employed in Arts, Entertainment & Recreation in Des Plaines
0.0%
2.0%
Zip Codes with the Highest Percentage of Population Employed in Arts, Entertainment & Recreation in Des Plaines, IL
| Zip Code | % Employed | vs State | vs National | |
| 1. | 60018 | 2.0% | 1.9%(+0.053)#344 | 2.1%(-0.094)#9,851 |
| 2. | 60016 | 0.96% | 1.9%(-0.979)#668 | 2.1%(-1.13)#17,291 |
1
Common Questions
What are the Top Zip Codes with the Highest Percentage of Population Employed in Arts, Entertainment & Recreation in Des Plaines, IL?
Top Zip Codes with the Highest Percentage of Population Employed in Arts, Entertainment & Recreation in Des Plaines, IL are:
What zip code has the Highest Percentage of Population Employed in Arts, Entertainment & Recreation in Des Plaines, IL?
60018 has the Highest Percentage of Population Employed in Arts, Entertainment & Recreation in Des Plaines, IL with 2.0%.
What is the Percentage of Population Employed in Arts, Entertainment & Recreation in Des Plaines, IL?
Percentage of Population Employed in Arts, Entertainment & Recreation in Des Plaines is 1.4%.
What is the Percentage of Population Employed in Arts, Entertainment & Recreation in Illinois?
Percentage of Population Employed in Arts, Entertainment & Recreation in Illinois is 1.9%.
What is the Percentage of Population Employed in Arts, Entertainment & Recreation in the United States?
Percentage of Population Employed in Arts, Entertainment & Recreation in the United States is 2.1%.