Zip Codes with the Highest Percentage of Population Employed in Agriculture, Fishing & Hunting in Bolingbrook, IL
RELATED REPORTS & OPTIONS
Agriculture, Fishing & Hunting
Bolingbrook
Compare Zip Codes
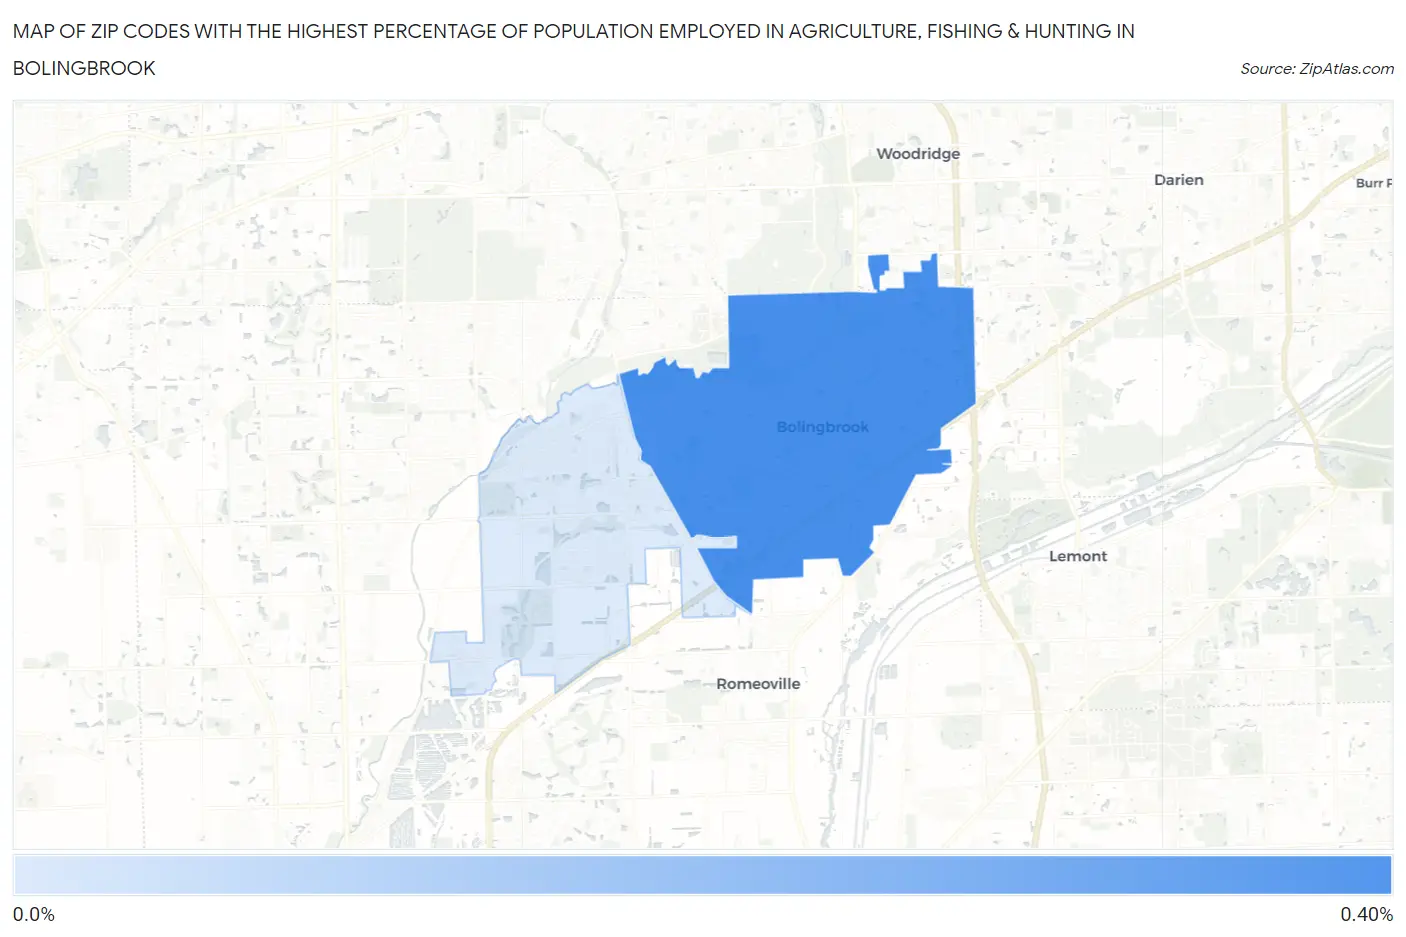
Map of Zip Codes with the Highest Percentage of Population Employed in Agriculture, Fishing & Hunting in Bolingbrook
0.0%
0.40%
Zip Codes with the Highest Percentage of Population Employed in Agriculture, Fishing & Hunting in Bolingbrook, IL
| Zip Code | % Employed | vs State | vs National | |
| 1. | 60440 | 0.32% | 0.88%(-0.562)#967 | 1.2%(-0.884)#20,999 |
| 2. | 60490 | 0.079% | 0.88%(-0.799)#1,104 | 1.2%(-1.12)#23,970 |
1
Common Questions
What are the Top Zip Codes with the Highest Percentage of Population Employed in Agriculture, Fishing & Hunting in Bolingbrook, IL?
Top Zip Codes with the Highest Percentage of Population Employed in Agriculture, Fishing & Hunting in Bolingbrook, IL are:
What zip code has the Highest Percentage of Population Employed in Agriculture, Fishing & Hunting in Bolingbrook, IL?
60440 has the Highest Percentage of Population Employed in Agriculture, Fishing & Hunting in Bolingbrook, IL with 0.32%.
What is the Percentage of Population Employed in Agriculture, Fishing & Hunting in Bolingbrook, IL?
Percentage of Population Employed in Agriculture, Fishing & Hunting in Bolingbrook is 0.24%.
What is the Percentage of Population Employed in Agriculture, Fishing & Hunting in Illinois?
Percentage of Population Employed in Agriculture, Fishing & Hunting in Illinois is 0.88%.
What is the Percentage of Population Employed in Agriculture, Fishing & Hunting in the United States?
Percentage of Population Employed in Agriculture, Fishing & Hunting in the United States is 1.2%.