Zip Codes with the Highest Percentage of Black / African American Population in Bolingbrook, IL
RELATED REPORTS & OPTIONS
Black / African American
Bolingbrook
Compare Zip Codes
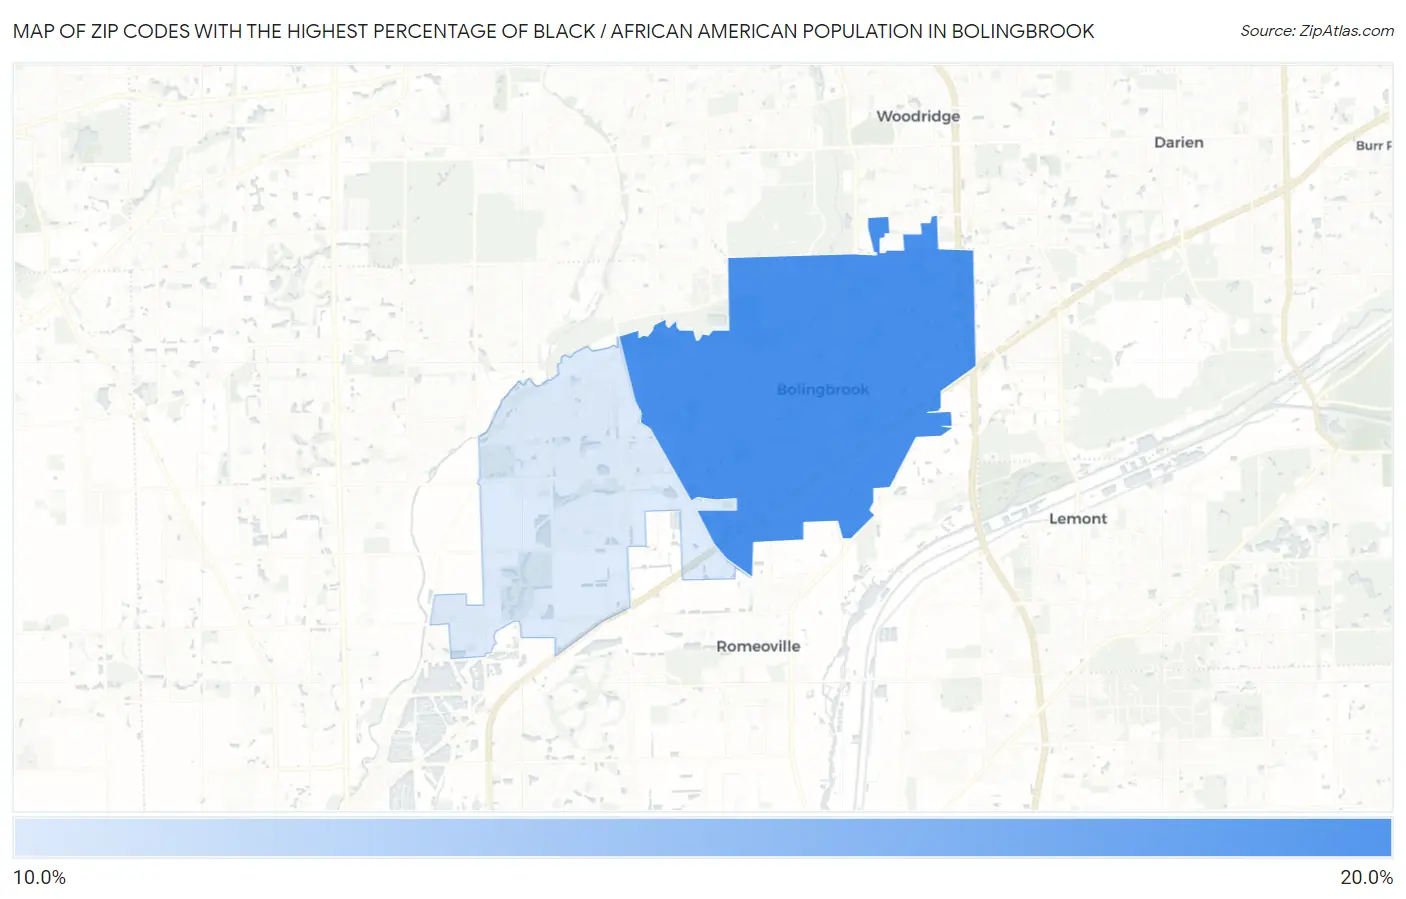
Map of Zip Codes with the Highest Percentage of Black / African American Population in Bolingbrook
15.1%
19.1%
Zip Codes with the Highest Percentage of Black / African American Population in Bolingbrook, IL
| Zip Code | Black / African American | vs State | vs National | |
| 1. | 60440 | 19.1% | 13.9%(+5.19)#114 | 12.5%(+6.63)#4,109 |
| 2. | 60490 | 15.1% | 13.9%(+1.17)#139 | 12.5%(+2.61)#4,934 |
1
Common Questions
What are the Top Zip Codes with the Highest Percentage of Black / African American Population in Bolingbrook, IL?
Top Zip Codes with the Highest Percentage of Black / African American Population in Bolingbrook, IL are:
What zip code has the Highest Percentage of Black / African American Population in Bolingbrook, IL?
60440 has the Highest Percentage of Black / African American Population in Bolingbrook, IL with 19.1%.
What is the Percentage of Black / African American Population in Bolingbrook, IL?
Percentage of Black / African American Population in Bolingbrook is 17.9%.
What is the Percentage of Black / African American Population in Illinois?
Percentage of Black / African American Population in Illinois is 13.9%.
What is the Percentage of Black / African American Population in the United States?
Percentage of Black / African American Population in the United States is 12.5%.