Zip Codes with the Highest Percentage of Black / African American Population in Glenview, IL
RELATED REPORTS & OPTIONS
Black / African American
Glenview
Compare Zip Codes
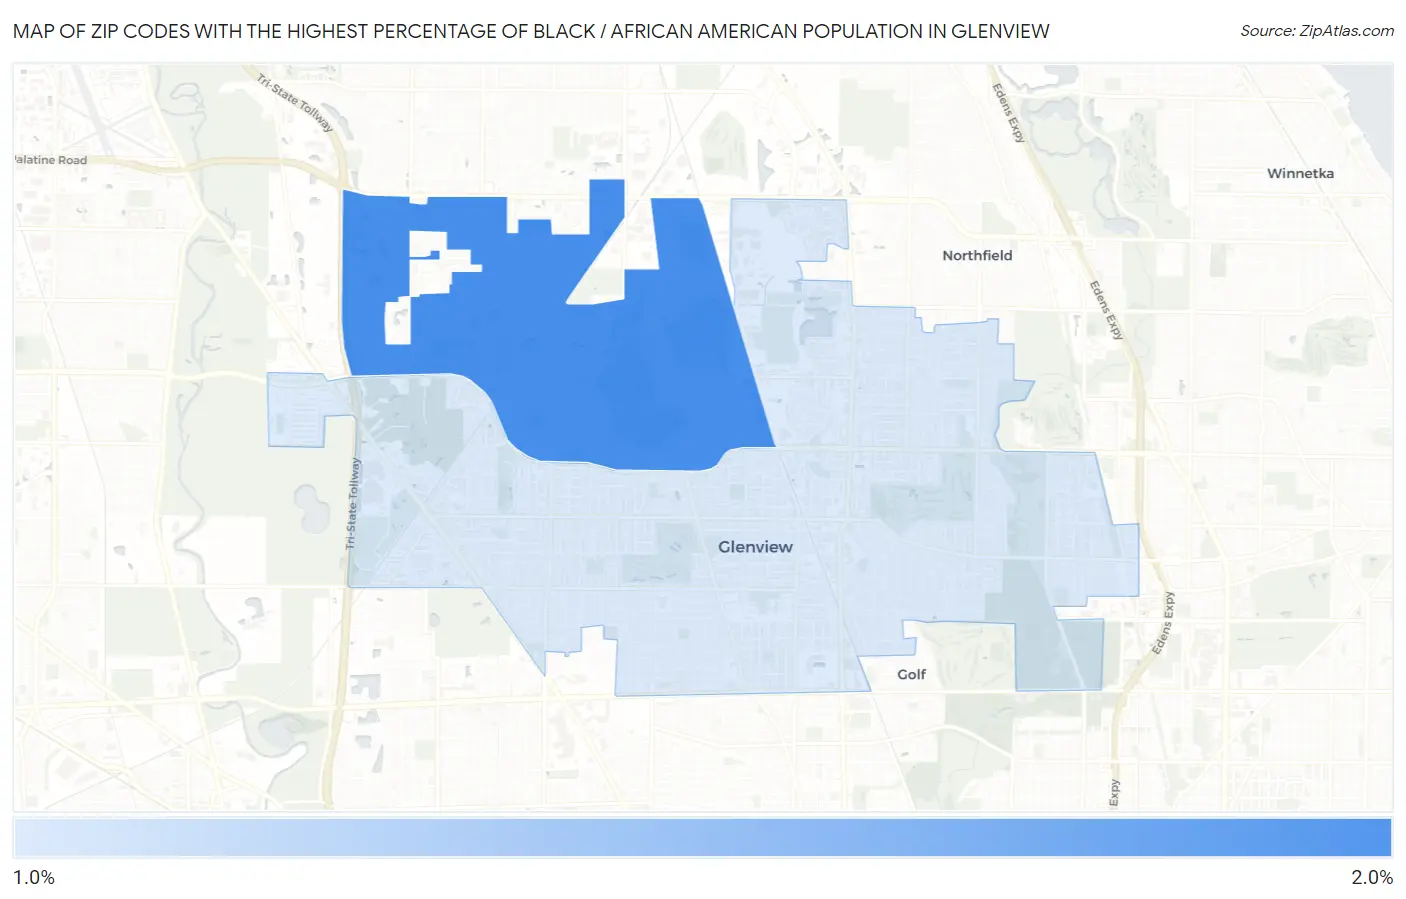
Map of Zip Codes with the Highest Percentage of Black / African American Population in Glenview
1.2%
2.0%
Zip Codes with the Highest Percentage of Black / African American Population in Glenview, IL
| Zip Code | Black / African American | vs State | vs National | |
| 1. | 60026 | 2.0% | 13.9%(-11.9)#472 | 12.5%(-10.5)#13,596 |
| 2. | 60025 | 1.2% | 13.9%(-12.7)#584 | 12.5%(-11.3)#15,752 |
1
Common Questions
What are the Top Zip Codes with the Highest Percentage of Black / African American Population in Glenview, IL?
Top Zip Codes with the Highest Percentage of Black / African American Population in Glenview, IL are:
What zip code has the Highest Percentage of Black / African American Population in Glenview, IL?
60026 has the Highest Percentage of Black / African American Population in Glenview, IL with 2.0%.
What is the Percentage of Black / African American Population in Glenview, IL?
Percentage of Black / African American Population in Glenview is 1.4%.
What is the Percentage of Black / African American Population in Illinois?
Percentage of Black / African American Population in Illinois is 13.9%.
What is the Percentage of Black / African American Population in the United States?
Percentage of Black / African American Population in the United States is 12.5%.