Zip Codes with the Highest Percentage of Population Employed in Arts, Entertainment & Recreation in Bloomington, IL
RELATED REPORTS & OPTIONS
Arts, Entertainment & Recreation
Bloomington
Compare Zip Codes
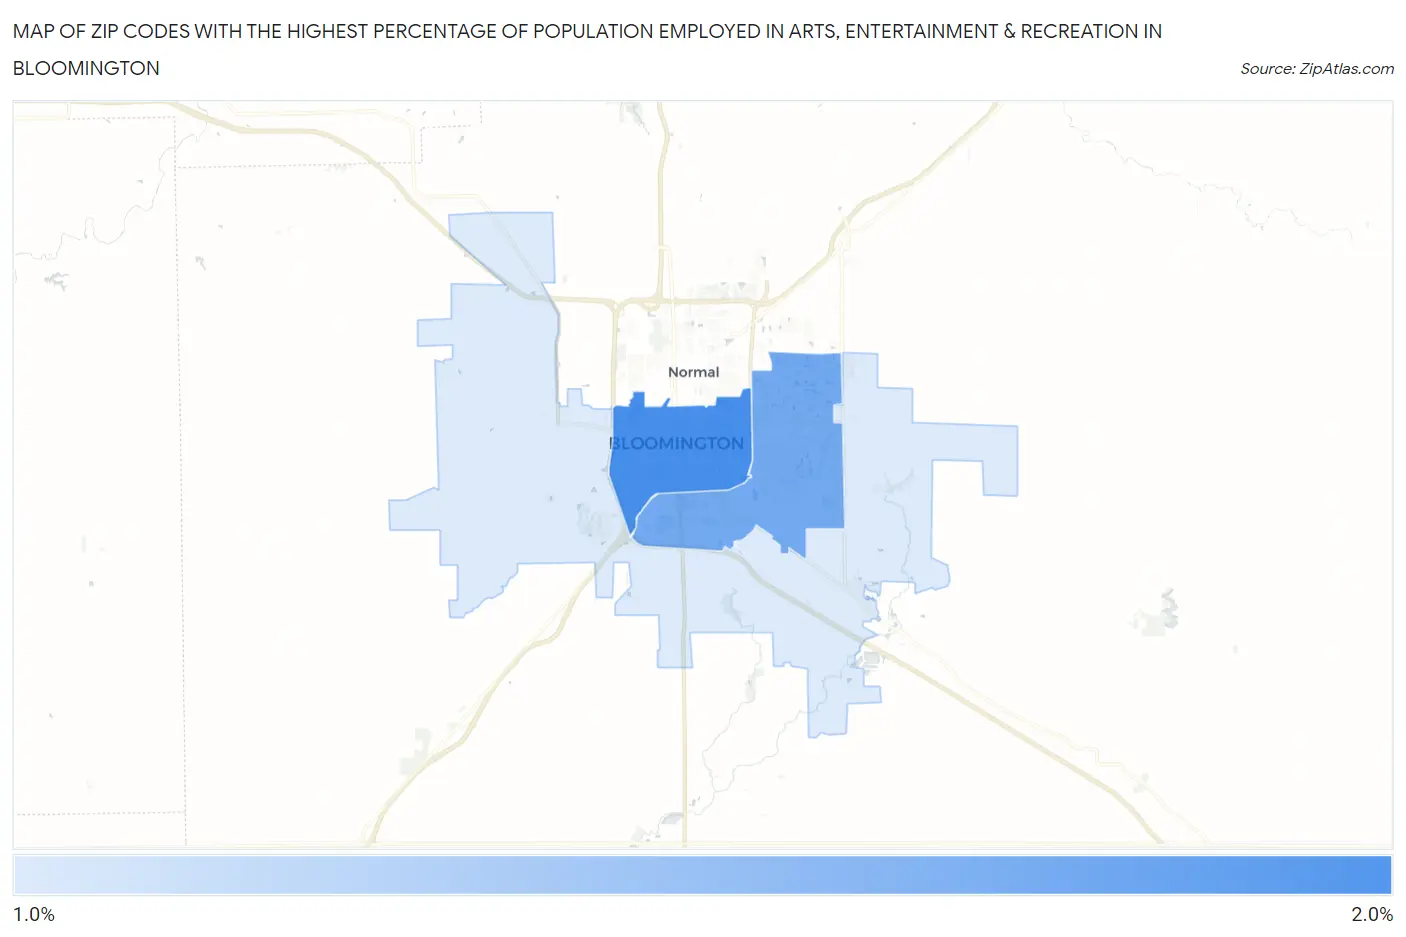
Map of Zip Codes with the Highest Percentage of Population Employed in Arts, Entertainment & Recreation in Bloomington
0.0%
2.0%
Zip Codes with the Highest Percentage of Population Employed in Arts, Entertainment & Recreation in Bloomington, IL
| Zip Code | % Employed | vs State | vs National | |
| 1. | 61701 | 2.0% | 1.9%(+0.062)#339 | 2.1%(-0.086)#9,802 |
| 2. | 61704 | 1.8% | 1.9%(-0.137)#398 | 2.1%(-0.285)#11,029 |
| 3. | 61705 | 1.3% | 1.9%(-0.625)#554 | 2.1%(-0.773)#14,646 |
1
Common Questions
What are the Top Zip Codes with the Highest Percentage of Population Employed in Arts, Entertainment & Recreation in Bloomington, IL?
Top Zip Codes with the Highest Percentage of Population Employed in Arts, Entertainment & Recreation in Bloomington, IL are:
What zip code has the Highest Percentage of Population Employed in Arts, Entertainment & Recreation in Bloomington, IL?
61701 has the Highest Percentage of Population Employed in Arts, Entertainment & Recreation in Bloomington, IL with 2.0%.
What is the Percentage of Population Employed in Arts, Entertainment & Recreation in Bloomington, IL?
Percentage of Population Employed in Arts, Entertainment & Recreation in Bloomington is 1.8%.
What is the Percentage of Population Employed in Arts, Entertainment & Recreation in Illinois?
Percentage of Population Employed in Arts, Entertainment & Recreation in Illinois is 1.9%.
What is the Percentage of Population Employed in Arts, Entertainment & Recreation in the United States?
Percentage of Population Employed in Arts, Entertainment & Recreation in the United States is 2.1%.