Zip Codes with the Highest Percentage of Population Employed in Health Care & Social Assistance in Iowa
RELATED REPORTS & OPTIONS
Health Care & Social Assistance
Iowa
Compare Zip Codes
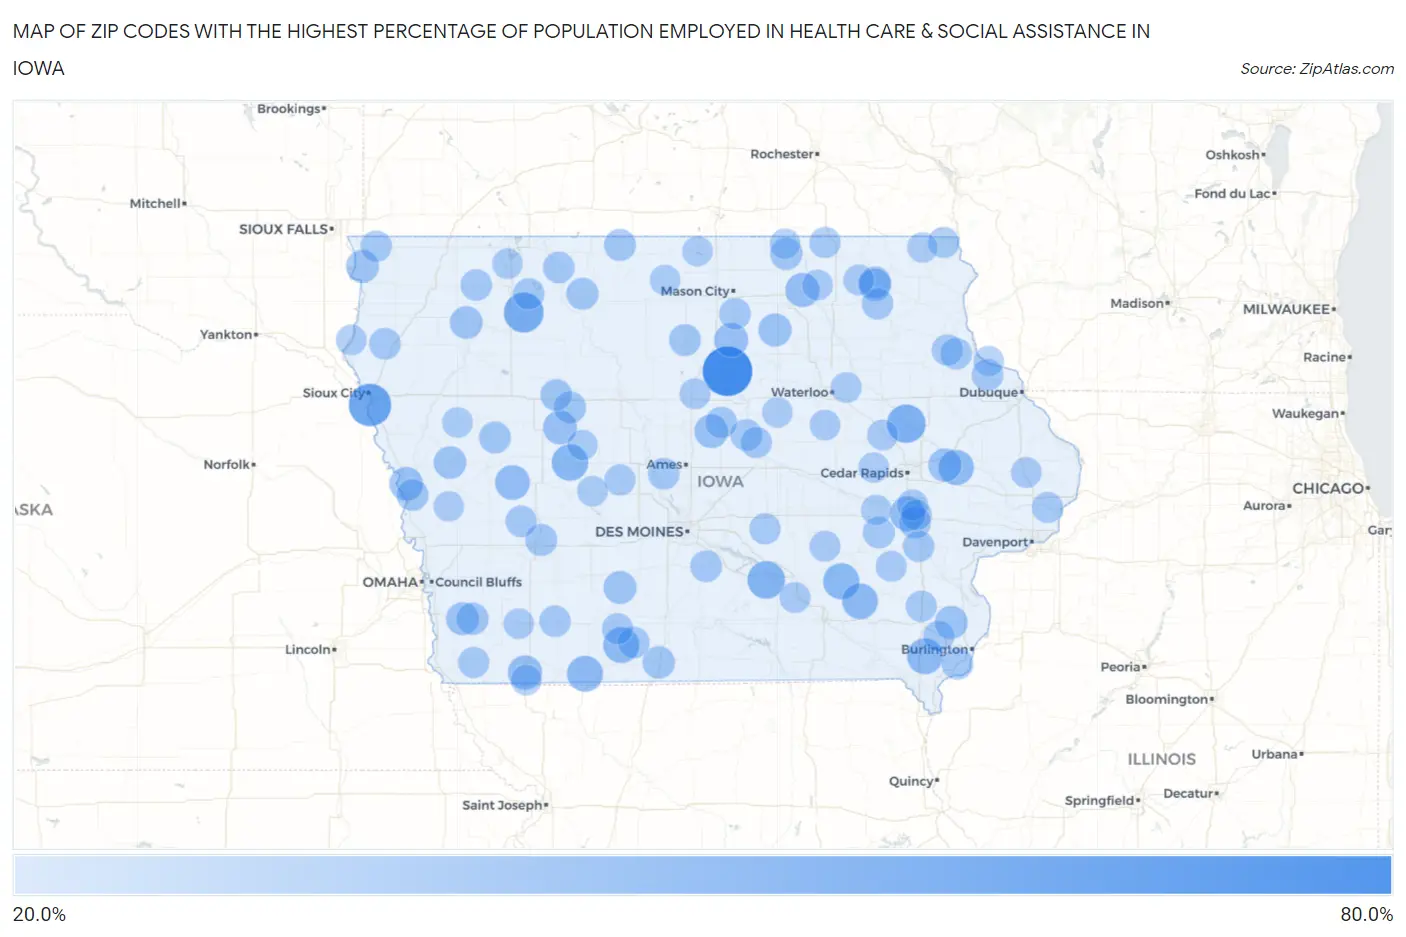
Map of Zip Codes with the Highest Percentage of Population Employed in Health Care & Social Assistance in Iowa
0.0%
80.0%
Zip Codes with the Highest Percentage of Population Employed in Health Care & Social Assistance in Iowa
| Zip Code | % Employed | vs State | vs National | |
| 1. | 50041 | 74.6% | 14.2%(+60.4)#1 | 13.9%(+60.7)#81 |
| 2. | 51111 | 54.2% | 14.2%(+40.0)#2 | 13.9%(+40.3)#178 |
| 3. | 51341 | 47.1% | 14.2%(+32.9)#3 | 13.9%(+33.1)#267 |
| 4. | 52344 | 43.8% | 14.2%(+29.5)#4 | 13.9%(+29.8)#319 |
| 5. | 50256 | 40.9% | 14.2%(+26.7)#5 | 13.9%(+26.9)#372 |
| 6. | 51459 | 37.9% | 14.2%(+23.7)#6 | 13.9%(+24.0)#463 |
| 7. | 52562 | 37.0% | 14.2%(+22.8)#7 | 13.9%(+23.1)#492 |
| 8. | 52657 | 36.6% | 14.2%(+22.4)#8 | 13.9%(+22.6)#517 |
| 9. | 50863 | 36.6% | 14.2%(+22.4)#9 | 13.9%(+22.6)#519 |
| 10. | 50836 | 36.2% | 14.2%(+22.0)#10 | 13.9%(+22.3)#537 |
| 11. | 52580 | 35.9% | 14.2%(+21.7)#11 | 13.9%(+22.0)#550 |
| 12. | 52312 | 34.3% | 14.2%(+20.1)#12 | 13.9%(+20.4)#636 |
| 13. | 52340 | 33.8% | 14.2%(+19.6)#13 | 13.9%(+19.9)#666 |
| 14. | 51432 | 33.3% | 14.2%(+19.1)#14 | 13.9%(+19.4)#698 |
| 15. | 51651 | 31.5% | 14.2%(+17.3)#15 | 13.9%(+17.6)#811 |
| 16. | 50620 | 31.4% | 14.2%(+17.2)#16 | 13.9%(+17.5)#815 |
| 17. | 50427 | 30.9% | 14.2%(+16.7)#17 | 13.9%(+16.9)#863 |
| 18. | 51449 | 30.6% | 14.2%(+16.4)#18 | 13.9%(+16.7)#889 |
| 19. | 51523 | 30.1% | 14.2%(+15.9)#19 | 13.9%(+16.1)#927 |
| 20. | 50102 | 29.8% | 14.2%(+15.6)#20 | 13.9%(+15.9)#952 |
| 21. | 52305 | 29.1% | 14.2%(+14.9)#21 | 13.9%(+15.2)#1,028 |
| 22. | 50636 | 28.5% | 14.2%(+14.3)#22 | 13.9%(+14.6)#1,111 |
| 23. | 52660 | 28.4% | 14.2%(+14.2)#23 | 13.9%(+14.4)#1,132 |
| 24. | 51551 | 28.1% | 14.2%(+13.9)#24 | 13.9%(+14.2)#1,160 |
| 25. | 51240 | 28.0% | 14.2%(+13.8)#25 | 13.9%(+14.1)#1,181 |
| 26. | 50155 | 28.0% | 14.2%(+13.8)#26 | 13.9%(+14.1)#1,184 |
| 27. | 51009 | 27.6% | 14.2%(+13.4)#27 | 13.9%(+13.7)#1,246 |
| 28. | 51060 | 27.2% | 14.2%(+13.0)#28 | 13.9%(+13.3)#1,303 |
| 29. | 50067 | 26.8% | 14.2%(+12.6)#29 | 13.9%(+12.9)#1,376 |
| 30. | 52132 | 26.7% | 14.2%(+12.5)#30 | 13.9%(+12.8)#1,386 |
| 31. | 51540 | 26.4% | 14.2%(+12.2)#31 | 13.9%(+12.5)#1,443 |
| 32. | 50454 | 26.3% | 14.2%(+12.1)#32 | 13.9%(+12.4)#1,466 |
| 33. | 50579 | 26.1% | 14.2%(+11.9)#33 | 13.9%(+12.1)#1,506 |
| 34. | 50528 | 25.7% | 14.2%(+11.5)#34 | 13.9%(+11.7)#1,587 |
| 35. | 52246 | 25.6% | 14.2%(+11.4)#35 | 13.9%(+11.7)#1,594 |
| 36. | 52168 | 25.6% | 14.2%(+11.4)#36 | 13.9%(+11.7)#1,596 |
| 37. | 50042 | 25.5% | 14.2%(+11.3)#37 | 13.9%(+11.5)#1,625 |
| 38. | 50556 | 25.4% | 14.2%(+11.2)#38 | 13.9%(+11.5)#1,634 |
| 39. | 51545 | 25.3% | 14.2%(+11.1)#39 | 13.9%(+11.4)#1,661 |
| 40. | 51448 | 25.1% | 14.2%(+10.9)#40 | 13.9%(+11.2)#1,700 |
| 41. | 50551 | 25.0% | 14.2%(+10.8)#41 | 13.9%(+11.1)#1,745 |
| 42. | 50421 | 25.0% | 14.2%(+10.8)#42 | 13.9%(+11.0)#1,750 |
| 43. | 50258 | 24.9% | 14.2%(+10.7)#43 | 13.9%(+11.0)#1,761 |
| 44. | 52325 | 24.9% | 14.2%(+10.7)#44 | 13.9%(+11.0)#1,762 |
| 45. | 50001 | 24.8% | 14.2%(+10.6)#45 | 13.9%(+10.8)#1,782 |
| 46. | 52658 | 24.8% | 14.2%(+10.6)#46 | 13.9%(+10.8)#1,784 |
| 47. | 50122 | 24.7% | 14.2%(+10.5)#47 | 13.9%(+10.8)#1,795 |
| 48. | 50074 | 24.7% | 14.2%(+10.5)#48 | 13.9%(+10.8)#1,797 |
| 49. | 50152 | 24.7% | 14.2%(+10.5)#49 | 13.9%(+10.8)#1,800 |
| 50. | 51008 | 24.6% | 14.2%(+10.4)#50 | 13.9%(+10.7)#1,815 |
| 51. | 52053 | 24.6% | 14.2%(+10.4)#51 | 13.9%(+10.6)#1,843 |
| 52. | 52166 | 24.3% | 14.2%(+10.1)#52 | 13.9%(+10.4)#1,914 |
| 53. | 51346 | 24.2% | 14.2%(+10.0)#53 | 13.9%(+10.3)#1,937 |
| 54. | 50841 | 24.2% | 14.2%(+10.00)#54 | 13.9%(+10.3)#1,949 |
| 55. | 50469 | 24.2% | 14.2%(+9.97)#55 | 13.9%(+10.2)#1,954 |
| 56. | 52048 | 24.1% | 14.2%(+9.91)#56 | 13.9%(+10.2)#1,969 |
| 57. | 51365 | 24.1% | 14.2%(+9.87)#57 | 13.9%(+10.1)#1,976 |
| 58. | 51333 | 24.1% | 14.2%(+9.87)#58 | 13.9%(+10.1)#1,977 |
| 59. | 51543 | 24.0% | 14.2%(+9.77)#59 | 13.9%(+10.0)#1,997 |
| 60. | 50148 | 23.9% | 14.2%(+9.74)#60 | 13.9%(+10.0)#2,007 |
| 61. | 52327 | 23.9% | 14.2%(+9.72)#61 | 13.9%(+9.98)#2,015 |
| 62. | 52044 | 23.8% | 14.2%(+9.58)#62 | 13.9%(+9.84)#2,057 |
| 63. | 51242 | 23.7% | 14.2%(+9.46)#63 | 13.9%(+9.72)#2,091 |
| 64. | 52645 | 23.3% | 14.2%(+9.13)#64 | 13.9%(+9.39)#2,210 |
| 65. | 50235 | 23.3% | 14.2%(+9.09)#65 | 13.9%(+9.35)#2,234 |
| 66. | 52134 | 23.3% | 14.2%(+9.07)#66 | 13.9%(+9.33)#2,240 |
| 67. | 52160 | 23.3% | 14.2%(+9.05)#67 | 13.9%(+9.32)#2,250 |
| 68. | 50137 | 23.2% | 14.2%(+9.01)#68 | 13.9%(+9.28)#2,270 |
| 69. | 52758 | 23.1% | 14.2%(+8.93)#69 | 13.9%(+9.20)#2,300 |
| 70. | 52652 | 23.1% | 14.2%(+8.88)#70 | 13.9%(+9.14)#2,324 |
| 71. | 50831 | 23.1% | 14.2%(+8.88)#71 | 13.9%(+9.14)#2,327 |
| 72. | 51639 | 23.0% | 14.2%(+8.84)#72 | 13.9%(+9.10)#2,335 |
| 73. | 52317 | 22.8% | 14.2%(+8.60)#73 | 13.9%(+8.87)#2,412 |
| 74. | 52553 | 22.8% | 14.2%(+8.56)#74 | 13.9%(+8.82)#2,431 |
| 75. | 52241 | 22.7% | 14.2%(+8.55)#75 | 13.9%(+8.81)#2,441 |
| 76. | 52163 | 22.7% | 14.2%(+8.50)#76 | 13.9%(+8.76)#2,473 |
| 77. | 50104 | 22.6% | 14.2%(+8.38)#77 | 13.9%(+8.64)#2,531 |
| 78. | 50271 | 22.5% | 14.2%(+8.35)#78 | 13.9%(+8.61)#2,543 |
| 79. | 52359 | 22.5% | 14.2%(+8.33)#79 | 13.9%(+8.60)#2,548 |
| 80. | 50603 | 22.2% | 14.2%(+8.02)#80 | 13.9%(+8.29)#2,684 |
| 81. | 52037 | 22.0% | 14.2%(+7.76)#81 | 13.9%(+8.03)#2,814 |
| 82. | 51631 | 21.9% | 14.2%(+7.69)#82 | 13.9%(+7.96)#2,853 |
| 83. | 50026 | 21.9% | 14.2%(+7.67)#83 | 13.9%(+7.94)#2,866 |
| 84. | 50623 | 21.9% | 14.2%(+7.67)#84 | 13.9%(+7.94)#2,867 |
| 85. | 52345 | 21.9% | 14.2%(+7.67)#85 | 13.9%(+7.93)#2,869 |
| 86. | 50612 | 21.9% | 14.2%(+7.65)#86 | 13.9%(+7.92)#2,877 |
| 87. | 51573 | 21.8% | 14.2%(+7.59)#87 | 13.9%(+7.85)#2,909 |
| 88. | 51351 | 21.8% | 14.2%(+7.56)#88 | 13.9%(+7.83)#2,919 |
| 89. | 51001 | 21.7% | 14.2%(+7.53)#89 | 13.9%(+7.80)#2,937 |
| 90. | 51006 | 21.7% | 14.2%(+7.53)#90 | 13.9%(+7.80)#2,938 |
| 91. | 50450 | 21.7% | 14.2%(+7.46)#91 | 13.9%(+7.73)#2,972 |
| 92. | 52334 | 21.6% | 14.2%(+7.44)#92 | 13.9%(+7.71)#2,989 |
| 93. | 52140 | 21.5% | 14.2%(+7.31)#93 | 13.9%(+7.57)#3,058 |
| 94. | 50476 | 21.5% | 14.2%(+7.29)#94 | 13.9%(+7.55)#3,065 |
| 95. | 52315 | 21.5% | 14.2%(+7.29)#95 | 13.9%(+7.55)#3,068 |
| 96. | 50638 | 21.5% | 14.2%(+7.27)#96 | 13.9%(+7.53)#3,075 |
| 97. | 50432 | 21.3% | 14.2%(+7.12)#97 | 13.9%(+7.39)#3,157 |
| 98. | 51579 | 21.3% | 14.2%(+7.08)#98 | 13.9%(+7.35)#3,177 |
| 99. | 52066 | 21.2% | 14.2%(+7.01)#99 | 13.9%(+7.28)#3,231 |
| 100. | 50050 | 21.2% | 14.2%(+6.98)#100 | 13.9%(+7.25)#3,249 |
Common Questions
What are the Top 10 Zip Codes with the Highest Percentage of Population Employed in Health Care & Social Assistance in Iowa?
Top 10 Zip Codes with the Highest Percentage of Population Employed in Health Care & Social Assistance in Iowa are:
What zip code has the Highest Percentage of Population Employed in Health Care & Social Assistance in Iowa?
50041 has the Highest Percentage of Population Employed in Health Care & Social Assistance in Iowa with 74.6%.
What is the Percentage of Population Employed in Health Care & Social Assistance in the State of Iowa?
Percentage of Population Employed in Health Care & Social Assistance in Iowa is 14.2%.
What is the Percentage of Population Employed in Health Care & Social Assistance in the United States?
Percentage of Population Employed in Health Care & Social Assistance in the United States is 13.9%.