Zip Codes with the Highest Percentage of Households Heated by Bottled Gas / Liquid Propane in Iowa
RELATED REPORTS & OPTIONS
Bottled Gas / LP Heating
Iowa
Compare Zip Codes
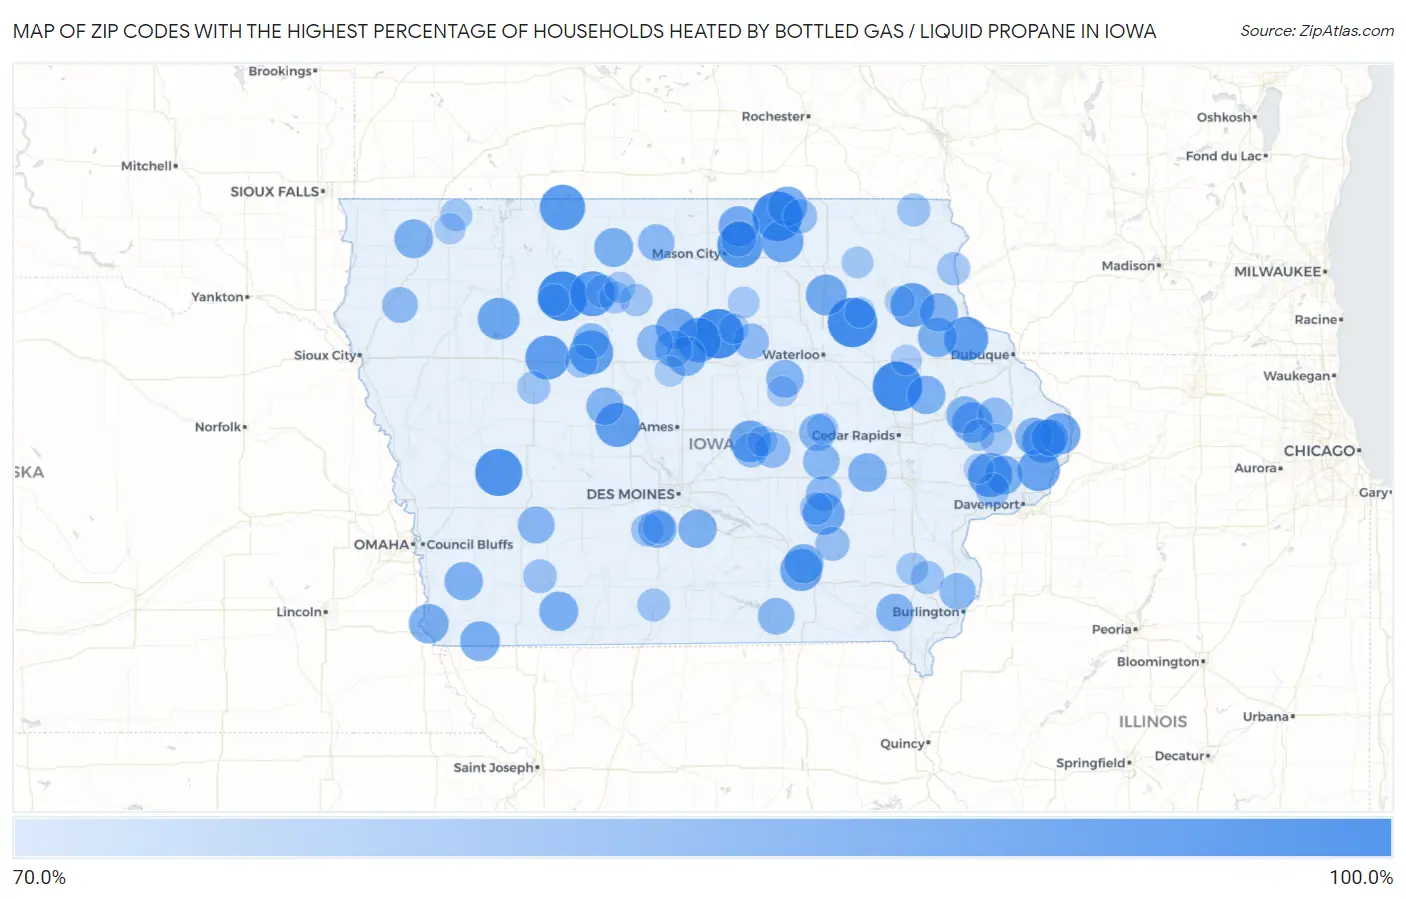
Map of Zip Codes with the Highest Percentage of Households Heated by Bottled Gas / Liquid Propane in Iowa
0.0%
100.0%
Zip Codes with the Highest Percentage of Households Heated by Bottled Gas / Liquid Propane in Iowa
| Zip Code | Bottled Gas / LP Heating | vs State | vs National | |
| 1. | 50664 | 100.0% | 12.8%(+87.2)#1 | 4.9%(+95.1)#17 |
| 2. | 52344 | 100.0% | 12.8%(+87.2)#2 | 4.9%(+95.1)#31 |
| 3. | 50041 | 100.0% | 12.8%(+87.2)#3 | 4.9%(+95.1)#32 |
| 4. | 50454 | 100.0% | 12.8%(+87.2)#4 | 4.9%(+95.1)#39 |
| 5. | 50573 | 100.0% | 12.8%(+87.2)#5 | 4.9%(+95.1)#48 |
| 6. | 51447 | 97.0% | 12.8%(+84.2)#6 | 4.9%(+92.1)#141 |
| 7. | 50531 | 94.6% | 12.8%(+81.8)#7 | 4.9%(+89.7)#149 |
| 8. | 50467 | 94.6% | 12.8%(+81.8)#8 | 4.9%(+89.7)#150 |
| 9. | 50570 | 94.2% | 12.8%(+81.4)#9 | 4.9%(+89.3)#153 |
| 10. | 50227 | 93.5% | 12.8%(+80.7)#10 | 4.9%(+88.6)#157 |
| 11. | 52765 | 93.1% | 12.8%(+80.3)#11 | 4.9%(+88.2)#159 |
| 12. | 50551 | 93.1% | 12.8%(+80.3)#12 | 4.9%(+88.2)#161 |
| 13. | 52056 | 93.0% | 12.8%(+80.2)#13 | 4.9%(+88.1)#162 |
| 14. | 52077 | 92.9% | 12.8%(+80.1)#14 | 4.9%(+88.0)#164 |
| 15. | 50031 | 92.9% | 12.8%(+80.1)#15 | 4.9%(+88.0)#166 |
| 16. | 50518 | 92.7% | 12.8%(+79.9)#16 | 4.9%(+87.8)#167 |
| 17. | 52750 | 91.6% | 12.8%(+78.8)#17 | 4.9%(+86.7)#175 |
| 18. | 52758 | 90.7% | 12.8%(+77.9)#18 | 4.9%(+85.8)#180 |
| 19. | 50460 | 90.4% | 12.8%(+77.6)#19 | 4.9%(+85.5)#184 |
| 20. | 52548 | 90.3% | 12.8%(+77.5)#20 | 4.9%(+85.4)#189 |
| 21. | 50592 | 90.2% | 12.8%(+77.4)#21 | 4.9%(+85.3)#191 |
| 22. | 50255 | 90.0% | 12.8%(+77.2)#22 | 4.9%(+85.1)#193 |
| 23. | 50120 | 89.7% | 12.8%(+76.9)#23 | 4.9%(+84.8)#194 |
| 24. | 52701 | 89.1% | 12.8%(+76.3)#24 | 4.9%(+84.2)#205 |
| 25. | 50631 | 88.8% | 12.8%(+76.0)#25 | 4.9%(+83.9)#208 |
| 26. | 52362 | 88.5% | 12.8%(+75.7)#26 | 4.9%(+83.6)#212 |
| 27. | 50101 | 88.5% | 12.8%(+75.7)#27 | 4.9%(+83.6)#214 |
| 28. | 50440 | 88.3% | 12.8%(+75.5)#28 | 4.9%(+83.4)#215 |
| 29. | 51647 | 87.5% | 12.8%(+74.7)#29 | 4.9%(+82.6)#221 |
| 30. | 51648 | 87.3% | 12.8%(+74.5)#30 | 4.9%(+82.4)#224 |
| 31. | 50455 | 87.1% | 12.8%(+74.3)#31 | 4.9%(+82.2)#227 |
| 32. | 50271 | 86.9% | 12.8%(+74.1)#32 | 4.9%(+82.0)#230 |
| 33. | 52566 | 86.9% | 12.8%(+74.1)#33 | 4.9%(+82.0)#231 |
| 34. | 52050 | 86.7% | 12.8%(+73.9)#34 | 4.9%(+81.8)#233 |
| 35. | 50862 | 86.7% | 12.8%(+73.9)#35 | 4.9%(+81.8)#234 |
| 36. | 50522 | 86.5% | 12.8%(+73.7)#36 | 4.9%(+81.6)#236 |
| 37. | 51244 | 86.4% | 12.8%(+73.6)#37 | 4.9%(+81.5)#240 |
| 38. | 52745 | 86.1% | 12.8%(+73.3)#38 | 4.9%(+81.2)#245 |
| 39. | 52334 | 86.0% | 12.8%(+73.2)#39 | 4.9%(+81.1)#247 |
| 40. | 52044 | 85.9% | 12.8%(+73.1)#40 | 4.9%(+81.0)#250 |
| 41. | 50001 | 85.8% | 12.8%(+73.0)#41 | 4.9%(+80.9)#251 |
| 42. | 51540 | 85.8% | 12.8%(+73.0)#42 | 4.9%(+80.9)#252 |
| 43. | 52219 | 85.7% | 12.8%(+72.9)#43 | 4.9%(+80.8)#254 |
| 44. | 50033 | 85.7% | 12.8%(+72.9)#44 | 4.9%(+80.8)#260 |
| 45. | 50217 | 84.6% | 12.8%(+71.8)#45 | 4.9%(+79.7)#271 |
| 46. | 52630 | 84.6% | 12.8%(+71.8)#46 | 4.9%(+79.7)#274 |
| 47. | 50657 | 84.6% | 12.8%(+71.8)#47 | 4.9%(+79.7)#275 |
| 48. | 52212 | 84.4% | 12.8%(+71.6)#48 | 4.9%(+79.5)#277 |
| 49. | 52731 | 84.2% | 12.8%(+71.4)#49 | 4.9%(+79.3)#286 |
| 50. | 50034 | 84.0% | 12.8%(+71.2)#50 | 4.9%(+79.1)#293 |
| 51. | 52727 | 84.0% | 12.8%(+71.2)#51 | 4.9%(+79.1)#294 |
| 52. | 50274 | 83.9% | 12.8%(+71.1)#52 | 4.9%(+79.0)#296 |
| 53. | 52348 | 83.8% | 12.8%(+71.0)#53 | 4.9%(+78.9)#299 |
| 54. | 52593 | 83.6% | 12.8%(+70.8)#54 | 4.9%(+78.7)#302 |
| 55. | 52232 | 83.3% | 12.8%(+70.5)#55 | 4.9%(+78.4)#307 |
| 56. | 50432 | 83.3% | 12.8%(+70.5)#56 | 4.9%(+78.4)#308 |
| 57. | 52650 | 83.0% | 12.8%(+70.2)#57 | 4.9%(+78.1)#316 |
| 58. | 50524 | 82.9% | 12.8%(+70.1)#58 | 4.9%(+78.0)#319 |
| 59. | 50599 | 82.6% | 12.8%(+69.8)#59 | 4.9%(+77.7)#322 |
| 60. | 51045 | 82.5% | 12.8%(+69.7)#60 | 4.9%(+77.6)#327 |
| 61. | 50106 | 82.4% | 12.8%(+69.6)#61 | 4.9%(+77.5)#328 |
| 62. | 52222 | 82.3% | 12.8%(+69.5)#62 | 4.9%(+77.4)#333 |
| 63. | 50464 | 82.1% | 12.8%(+69.3)#63 | 4.9%(+77.2)#338 |
| 64. | 50608 | 82.1% | 12.8%(+69.3)#64 | 4.9%(+77.2)#343 |
| 65. | 50141 | 81.4% | 12.8%(+68.6)#65 | 4.9%(+76.5)#353 |
| 66. | 52207 | 81.3% | 12.8%(+68.5)#66 | 4.9%(+76.4)#356 |
| 67. | 50466 | 80.7% | 12.8%(+67.9)#67 | 4.9%(+75.8)#371 |
| 68. | 52562 | 80.6% | 12.8%(+67.8)#68 | 4.9%(+75.7)#375 |
| 69. | 52769 | 80.0% | 12.8%(+67.2)#69 | 4.9%(+75.1)#386 |
| 70. | 50839 | 80.0% | 12.8%(+67.2)#70 | 4.9%(+75.1)#390 |
| 71. | 52644 | 79.2% | 12.8%(+66.4)#71 | 4.9%(+74.3)#405 |
| 72. | 50519 | 79.1% | 12.8%(+66.3)#72 | 4.9%(+74.2)#408 |
| 73. | 51433 | 79.1% | 12.8%(+66.3)#73 | 4.9%(+74.2)#409 |
| 74. | 52140 | 79.1% | 12.8%(+66.3)#74 | 4.9%(+74.2)#410 |
| 75. | 52158 | 79.1% | 12.8%(+66.3)#75 | 4.9%(+74.2)#411 |
| 76. | 50218 | 78.9% | 12.8%(+66.1)#76 | 4.9%(+74.0)#415 |
| 77. | 50262 | 78.9% | 12.8%(+66.1)#77 | 4.9%(+74.0)#416 |
| 78. | 50104 | 78.8% | 12.8%(+66.0)#78 | 4.9%(+73.9)#421 |
| 79. | 50552 | 78.8% | 12.8%(+66.0)#79 | 4.9%(+73.9)#422 |
| 80. | 50229 | 78.6% | 12.8%(+65.8)#80 | 4.9%(+73.7)#426 |
| 81. | 50577 | 78.3% | 12.8%(+65.5)#81 | 4.9%(+73.4)#434 |
| 82. | 51354 | 77.8% | 12.8%(+65.0)#82 | 4.9%(+72.9)#446 |
| 83. | 50558 | 77.8% | 12.8%(+65.0)#83 | 4.9%(+72.9)#447 |
| 84. | 52652 | 77.8% | 12.8%(+65.0)#84 | 4.9%(+72.9)#449 |
| 85. | 50546 | 77.7% | 12.8%(+64.9)#85 | 4.9%(+72.8)#451 |
| 86. | 52254 | 77.6% | 12.8%(+64.8)#86 | 4.9%(+72.7)#452 |
| 87. | 52171 | 77.5% | 12.8%(+64.7)#87 | 4.9%(+72.6)#453 |
| 88. | 52323 | 77.4% | 12.8%(+64.6)#88 | 4.9%(+72.5)#455 |
| 89. | 50560 | 77.3% | 12.8%(+64.5)#89 | 4.9%(+72.4)#458 |
| 90. | 52225 | 77.2% | 12.8%(+64.4)#90 | 4.9%(+72.3)#461 |
| 91. | 50605 | 77.2% | 12.8%(+64.4)#91 | 4.9%(+72.3)#462 |
| 92. | 51350 | 76.7% | 12.8%(+63.9)#92 | 4.9%(+71.8)#479 |
| 93. | 50681 | 76.4% | 12.8%(+63.6)#93 | 4.9%(+71.5)#490 |
| 94. | 50654 | 76.1% | 12.8%(+63.3)#94 | 4.9%(+71.2)#501 |
| 95. | 50132 | 76.0% | 12.8%(+63.2)#95 | 4.9%(+71.1)#505 |
| 96. | 50633 | 76.0% | 12.8%(+63.2)#96 | 4.9%(+71.1)#506 |
| 97. | 50652 | 76.0% | 12.8%(+63.2)#97 | 4.9%(+71.1)#508 |
| 98. | 50078 | 76.0% | 12.8%(+63.2)#98 | 4.9%(+71.1)#509 |
| 99. | 52169 | 75.8% | 12.8%(+63.0)#99 | 4.9%(+70.9)#514 |
| 100. | 52721 | 75.6% | 12.8%(+62.8)#100 | 4.9%(+70.7)#517 |
Common Questions
What are the Top 10 Zip Codes with the Highest Percentage of Households Heated by Bottled Gas / Liquid Propane in Iowa?
Top 10 Zip Codes with the Highest Percentage of Households Heated by Bottled Gas / Liquid Propane in Iowa are:
What zip code has the Highest Percentage of Households Heated by Bottled Gas / Liquid Propane in Iowa?
50664 has the Highest Percentage of Households Heated by Bottled Gas / Liquid Propane in Iowa with 100.0%.
What is the Percentage of Households Heated by Bottled Gas / Liquid Propane in the State of Iowa?
Percentage of Households Heated by Bottled Gas / Liquid Propane in Iowa is 12.8%.
What is the Percentage of Households Heated by Bottled Gas / Liquid Propane in the United States?
Percentage of Households Heated by Bottled Gas / Liquid Propane in the United States is 4.9%.