Zip Codes with the Highest Percentage of Population Employed in Farming, Fishing & Forestry in Iowa
RELATED REPORTS & OPTIONS
Farming, Fishing & Forestry
Iowa
Compare Zip Codes
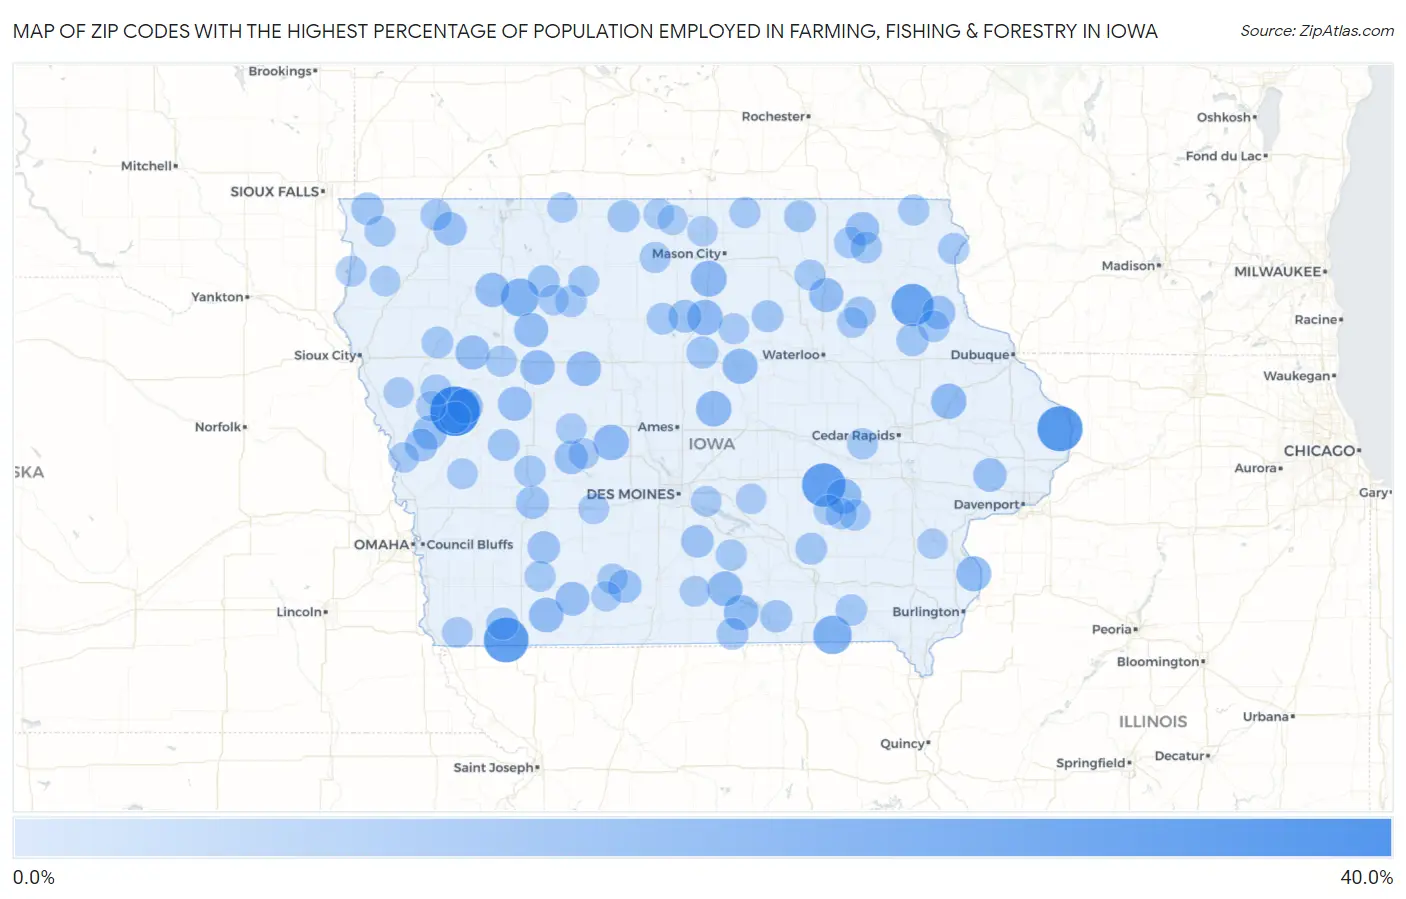
Map of Zip Codes with the Highest Percentage of Population Employed in Farming, Fishing & Forestry in Iowa
0.0%
40.0%
Zip Codes with the Highest Percentage of Population Employed in Farming, Fishing & Forestry in Iowa
| Zip Code | % Employed | vs State | vs National | |
| 1. | 51460 | 35.3% | 1.1%(+34.2)#1 | 0.61%(+34.7)#138 |
| 2. | 52771 | 28.6% | 1.1%(+27.5)#2 | 0.61%(+28.0)#215 |
| 3. | 51637 | 27.8% | 1.1%(+26.7)#3 | 0.61%(+27.2)#228 |
| 4. | 52221 | 26.0% | 1.1%(+24.9)#4 | 0.61%(+25.4)#269 |
| 5. | 52077 | 24.1% | 1.1%(+23.0)#5 | 0.61%(+23.5)#302 |
| 6. | 52584 | 18.3% | 1.1%(+17.2)#6 | 0.61%(+17.7)#464 |
| 7. | 50565 | 17.4% | 1.1%(+16.3)#7 | 0.61%(+16.8)#508 |
| 8. | 50477 | 14.3% | 1.1%(+13.2)#8 | 0.61%(+13.7)#695 |
| 9. | 50235 | 13.7% | 1.1%(+12.6)#9 | 0.61%(+13.1)#747 |
| 10. | 50431 | 13.7% | 1.1%(+12.6)#10 | 0.61%(+13.1)#750 |
| 11. | 50278 | 13.6% | 1.1%(+12.5)#11 | 0.61%(+13.0)#755 |
| 12. | 51461 | 13.5% | 1.1%(+12.4)#12 | 0.61%(+12.9)#770 |
| 13. | 52252 | 13.4% | 1.1%(+12.3)#13 | 0.61%(+12.8)#778 |
| 14. | 52308 | 13.2% | 1.1%(+12.1)#14 | 0.61%(+12.6)#792 |
| 15. | 50672 | 13.1% | 1.1%(+12.0)#15 | 0.61%(+12.5)#800 |
| 16. | 52646 | 13.0% | 1.1%(+12.0)#16 | 0.61%(+12.4)#809 |
| 17. | 52581 | 13.0% | 1.1%(+11.9)#17 | 0.61%(+12.4)#812 |
| 18. | 50238 | 12.9% | 1.1%(+11.8)#18 | 0.61%(+12.3)#817 |
| 19. | 50586 | 12.5% | 1.1%(+11.4)#19 | 0.61%(+11.9)#867 |
| 20. | 50848 | 12.4% | 1.1%(+11.3)#20 | 0.61%(+11.7)#888 |
| 21. | 50561 | 12.3% | 1.1%(+11.2)#21 | 0.61%(+11.7)#894 |
| 22. | 51033 | 11.8% | 1.1%(+10.7)#22 | 0.61%(+11.2)#952 |
| 23. | 50593 | 11.8% | 1.1%(+10.7)#23 | 0.61%(+11.2)#959 |
| 24. | 50631 | 11.7% | 1.1%(+10.6)#24 | 0.61%(+11.1)#968 |
| 25. | 51020 | 11.6% | 1.1%(+10.5)#25 | 0.61%(+11.0)#972 |
| 26. | 51572 | 11.6% | 1.1%(+10.5)#26 | 0.61%(+11.0)#973 |
| 27. | 51436 | 11.5% | 1.1%(+10.4)#27 | 0.61%(+10.9)#985 |
| 28. | 50851 | 11.4% | 1.1%(+10.3)#28 | 0.61%(+10.8)#1,007 |
| 29. | 52165 | 10.8% | 1.1%(+9.75)#29 | 0.61%(+10.2)#1,070 |
| 30. | 52765 | 10.8% | 1.1%(+9.70)#30 | 0.61%(+10.2)#1,081 |
| 31. | 51350 | 10.6% | 1.1%(+9.51)#31 | 0.61%(+9.99)#1,110 |
| 32. | 52044 | 10.5% | 1.1%(+9.40)#32 | 0.61%(+9.88)#1,127 |
| 33. | 50029 | 10.4% | 1.1%(+9.36)#33 | 0.61%(+9.84)#1,132 |
| 34. | 50254 | 10.3% | 1.1%(+9.17)#34 | 0.61%(+9.65)#1,173 |
| 35. | 50042 | 10.0% | 1.1%(+8.91)#35 | 0.61%(+9.39)#1,209 |
| 36. | 50470 | 9.8% | 1.1%(+8.67)#36 | 0.61%(+9.15)#1,248 |
| 37. | 50166 | 9.6% | 1.1%(+8.53)#37 | 0.61%(+9.01)#1,271 |
| 38. | 51558 | 9.6% | 1.1%(+8.48)#38 | 0.61%(+8.96)#1,282 |
| 39. | 50853 | 9.3% | 1.1%(+8.21)#39 | 0.61%(+8.70)#1,341 |
| 40. | 52038 | 9.2% | 1.1%(+8.10)#40 | 0.61%(+8.59)#1,362 |
| 41. | 52593 | 9.2% | 1.1%(+8.09)#41 | 0.61%(+8.58)#1,364 |
| 42. | 51242 | 9.1% | 1.1%(+8.05)#42 | 0.61%(+8.53)#1,375 |
| 43. | 51656 | 9.1% | 1.1%(+8.00)#43 | 0.61%(+8.49)#1,388 |
| 44. | 50451 | 8.8% | 1.1%(+7.67)#44 | 0.61%(+8.16)#1,463 |
| 45. | 50006 | 8.7% | 1.1%(+7.64)#45 | 0.61%(+8.13)#1,471 |
| 46. | 50527 | 8.5% | 1.1%(+7.42)#46 | 0.61%(+7.91)#1,526 |
| 47. | 50681 | 8.4% | 1.1%(+7.29)#47 | 0.61%(+7.77)#1,547 |
| 48. | 51432 | 8.3% | 1.1%(+7.24)#48 | 0.61%(+7.73)#1,569 |
| 49. | 51439 | 8.3% | 1.1%(+7.20)#49 | 0.61%(+7.68)#1,578 |
| 50. | 52561 | 8.3% | 1.1%(+7.19)#50 | 0.61%(+7.68)#1,581 |
| 51. | 50602 | 8.2% | 1.1%(+7.15)#51 | 0.61%(+7.63)#1,592 |
| 52. | 52590 | 8.2% | 1.1%(+7.14)#52 | 0.61%(+7.62)#1,596 |
| 53. | 50466 | 8.1% | 1.1%(+7.03)#53 | 0.61%(+7.52)#1,629 |
| 54. | 50581 | 8.1% | 1.1%(+6.97)#54 | 0.61%(+7.45)#1,644 |
| 55. | 50525 | 8.1% | 1.1%(+6.97)#55 | 0.61%(+7.45)#1,646 |
| 56. | 51061 | 8.0% | 1.1%(+6.94)#56 | 0.61%(+7.42)#1,656 |
| 57. | 52163 | 8.0% | 1.1%(+6.89)#57 | 0.61%(+7.37)#1,673 |
| 58. | 52132 | 7.9% | 1.1%(+6.77)#58 | 0.61%(+7.25)#1,702 |
| 59. | 52335 | 7.8% | 1.1%(+6.75)#59 | 0.61%(+7.23)#1,708 |
| 60. | 50025 | 7.8% | 1.1%(+6.73)#60 | 0.61%(+7.21)#1,711 |
| 61. | 52042 | 7.8% | 1.1%(+6.71)#61 | 0.61%(+7.20)#1,716 |
| 62. | 52146 | 7.8% | 1.1%(+6.70)#62 | 0.61%(+7.19)#1,721 |
| 63. | 51249 | 7.6% | 1.1%(+6.56)#63 | 0.61%(+7.04)#1,773 |
| 64. | 52551 | 7.6% | 1.1%(+6.54)#64 | 0.61%(+7.02)#1,785 |
| 65. | 52355 | 7.5% | 1.1%(+6.37)#65 | 0.61%(+6.86)#1,832 |
| 66. | 50057 | 7.3% | 1.1%(+6.23)#66 | 0.61%(+6.71)#1,876 |
| 67. | 52354 | 7.2% | 1.1%(+6.16)#67 | 0.61%(+6.64)#1,896 |
| 68. | 50535 | 7.2% | 1.1%(+6.15)#68 | 0.61%(+6.64)#1,900 |
| 69. | 52140 | 7.2% | 1.1%(+6.08)#69 | 0.61%(+6.56)#1,922 |
| 70. | 50426 | 7.1% | 1.1%(+6.05)#70 | 0.61%(+6.54)#1,933 |
| 71. | 50839 | 7.1% | 1.1%(+6.05)#71 | 0.61%(+6.54)#1,934 |
| 72. | 51019 | 7.1% | 1.1%(+6.00)#72 | 0.61%(+6.48)#1,946 |
| 73. | 50645 | 7.1% | 1.1%(+5.97)#73 | 0.61%(+6.45)#1,953 |
| 74. | 51235 | 7.0% | 1.1%(+5.94)#74 | 0.61%(+6.42)#1,964 |
| 75. | 50423 | 7.0% | 1.1%(+5.94)#75 | 0.61%(+6.42)#1,967 |
| 76. | 50597 | 7.0% | 1.1%(+5.89)#76 | 0.61%(+6.37)#1,983 |
| 77. | 51650 | 6.9% | 1.1%(+5.81)#77 | 0.61%(+6.29)#2,023 |
| 78. | 50026 | 6.9% | 1.1%(+5.79)#78 | 0.61%(+6.27)#2,036 |
| 79. | 51023 | 6.8% | 1.1%(+5.73)#79 | 0.61%(+6.21)#2,047 |
| 80. | 50633 | 6.8% | 1.1%(+5.73)#80 | 0.61%(+6.21)#2,050 |
| 81. | 50250 | 6.8% | 1.1%(+5.70)#81 | 0.61%(+6.19)#2,058 |
| 82. | 50664 | 6.7% | 1.1%(+5.65)#82 | 0.61%(+6.14)#2,077 |
| 83. | 50068 | 6.7% | 1.1%(+5.62)#83 | 0.61%(+6.11)#2,089 |
| 84. | 50237 | 6.7% | 1.1%(+5.57)#84 | 0.61%(+6.05)#2,111 |
| 85. | 51562 | 6.6% | 1.1%(+5.50)#85 | 0.61%(+5.99)#2,128 |
| 86. | 51462 | 6.6% | 1.1%(+5.47)#86 | 0.61%(+5.95)#2,141 |
| 87. | 50830 | 6.5% | 1.1%(+5.40)#87 | 0.61%(+5.88)#2,162 |
| 88. | 51026 | 6.4% | 1.1%(+5.32)#88 | 0.61%(+5.80)#2,196 |
| 89. | 50478 | 6.4% | 1.1%(+5.32)#89 | 0.61%(+5.80)#2,197 |
| 90. | 50546 | 6.4% | 1.1%(+5.27)#90 | 0.61%(+5.75)#2,217 |
| 91. | 51545 | 6.3% | 1.1%(+5.24)#91 | 0.61%(+5.72)#2,224 |
| 92. | 50136 | 6.3% | 1.1%(+5.23)#92 | 0.61%(+5.71)#2,228 |
| 93. | 51034 | 6.3% | 1.1%(+5.22)#93 | 0.61%(+5.70)#2,234 |
| 94. | 52737 | 6.3% | 1.1%(+5.20)#94 | 0.61%(+5.69)#2,242 |
| 95. | 50444 | 6.3% | 1.1%(+5.20)#95 | 0.61%(+5.68)#2,247 |
| 96. | 51036 | 6.3% | 1.1%(+5.17)#96 | 0.61%(+5.66)#2,258 |
| 97. | 50232 | 6.2% | 1.1%(+5.16)#97 | 0.61%(+5.64)#2,265 |
| 98. | 50531 | 6.2% | 1.1%(+5.16)#98 | 0.61%(+5.64)#2,270 |
| 99. | 50861 | 6.2% | 1.1%(+5.08)#99 | 0.61%(+5.57)#2,307 |
| 100. | 50453 | 6.0% | 1.1%(+4.94)#100 | 0.61%(+5.42)#2,380 |
Common Questions
What are the Top 10 Zip Codes with the Highest Percentage of Population Employed in Farming, Fishing & Forestry in Iowa?
Top 10 Zip Codes with the Highest Percentage of Population Employed in Farming, Fishing & Forestry in Iowa are:
What zip code has the Highest Percentage of Population Employed in Farming, Fishing & Forestry in Iowa?
51460 has the Highest Percentage of Population Employed in Farming, Fishing & Forestry in Iowa with 35.3%.
What is the Percentage of Population Employed in Farming, Fishing & Forestry in the State of Iowa?
Percentage of Population Employed in Farming, Fishing & Forestry in Iowa is 1.1%.
What is the Percentage of Population Employed in Farming, Fishing & Forestry in the United States?
Percentage of Population Employed in Farming, Fishing & Forestry in the United States is 0.61%.