Yatesville, GA Map & Demographics
Yatesville Map
Yatesville Overview
$29,561
PER CAPITA INCOME
$82,583
AVG FAMILY INCOME
$62,019
AVG HOUSEHOLD INCOME
38.7%
WAGE / INCOME GAP [ % ]
61.3¢/ $1
WAGE / INCOME GAP [ $ ]
0.35
INEQUALITY / GINI INDEX
358
TOTAL POPULATION
158
MALE POPULATION
200
FEMALE POPULATION
79.00
MALES / 100 FEMALES
126.58
FEMALES / 100 MALES
52.8
MEDIAN AGE
2.6
AVG FAMILY SIZE
2.2
AVG HOUSEHOLD SIZE
190
LABOR FORCE [ PEOPLE ]
59.9%
PERCENT IN LABOR FORCE
1.1%
UNEMPLOYMENT RATE
Yatesville Zip Codes
Income in Yatesville
Income Overview in Yatesville
Per Capita Income in Yatesville is $29,561, while median incomes of families and households are $82,583 and $62,019 respectively.
| Characteristic | Number | Measure |
| Per Capita Income | 358 | $29,561 |
| Median Family Income | 117 | $82,583 |
| Mean Family Income | 117 | $78,672 |
| Median Household Income | 161 | $62,019 |
| Mean Household Income | 161 | $65,306 |
| Income Deficit | 117 | $0 |
| Wage / Income Gap (%) | 358 | 38.67% |
| Wage / Income Gap ($) | 358 | 61.33¢ per $1 |
| Gini / Inequality Index | 358 | 0.35 |
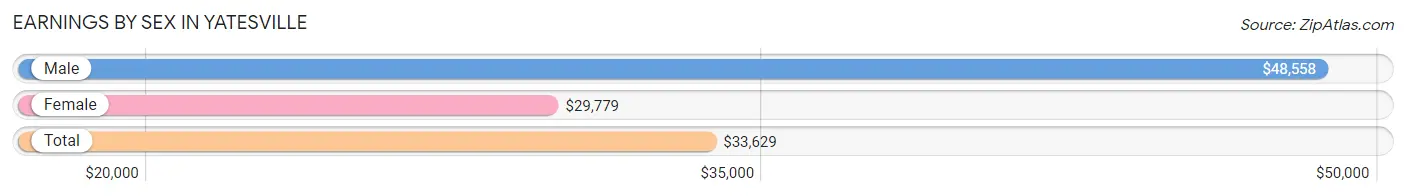
Earnings by Sex in Yatesville
Average Earnings in Yatesville are $33,629, $48,558 for men and $29,779 for women, a difference of 38.7%.
| Sex | Number | Average Earnings |
| Male | 91 (46.9%) | $48,558 |
| Female | 103 (53.1%) | $29,779 |
| Total | 194 (100.0%) | $33,629 |
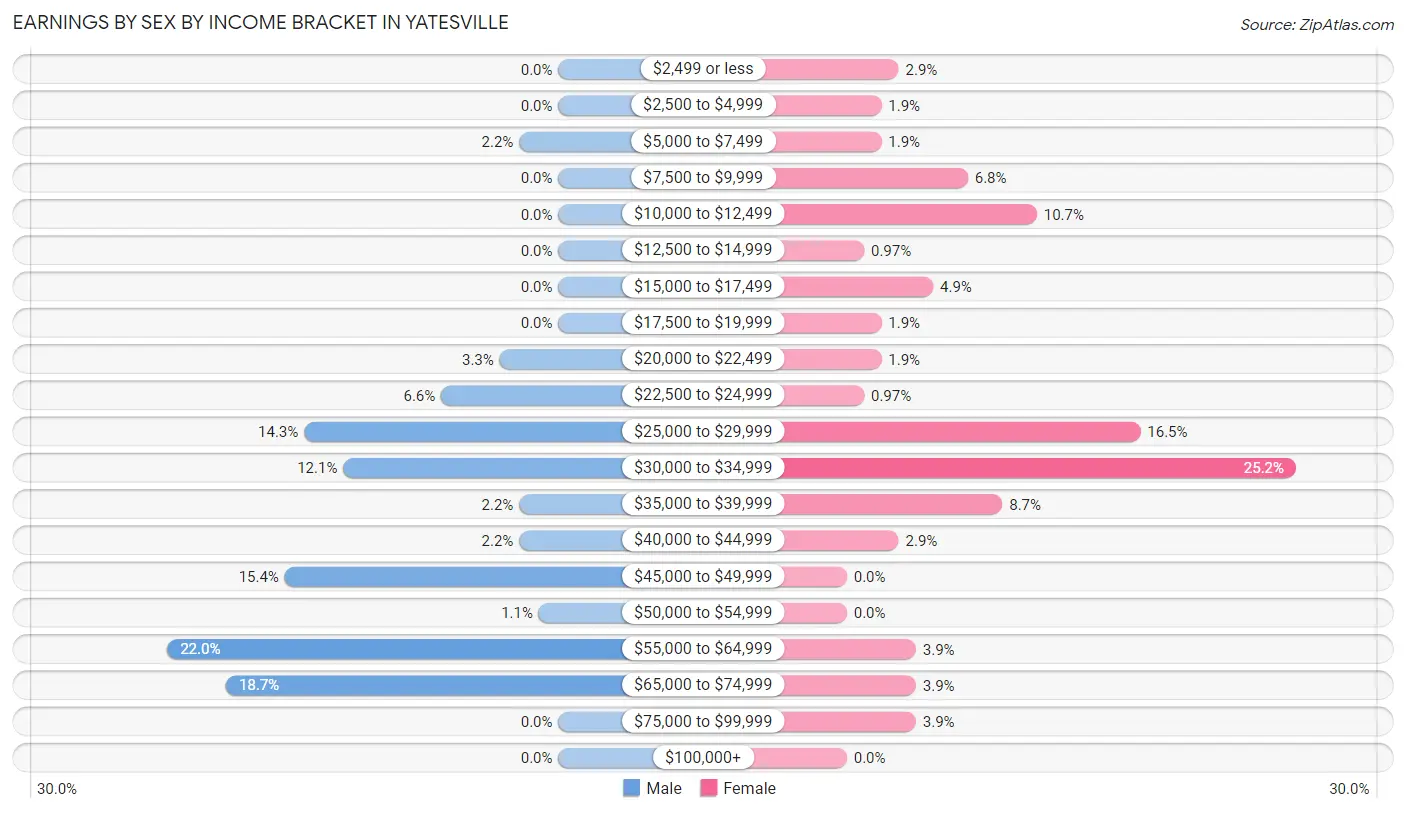
Earnings by Sex by Income Bracket in Yatesville
The most common earnings brackets in Yatesville are $55,000 to $64,999 for men (20 | 22.0%) and $30,000 to $34,999 for women (26 | 25.2%).
| Income | Male | Female |
| $2,499 or less | 0 (0.0%) | 3 (2.9%) |
| $2,500 to $4,999 | 0 (0.0%) | 2 (1.9%) |
| $5,000 to $7,499 | 2 (2.2%) | 2 (1.9%) |
| $7,500 to $9,999 | 0 (0.0%) | 7 (6.8%) |
| $10,000 to $12,499 | 0 (0.0%) | 11 (10.7%) |
| $12,500 to $14,999 | 0 (0.0%) | 1 (1.0%) |
| $15,000 to $17,499 | 0 (0.0%) | 5 (4.9%) |
| $17,500 to $19,999 | 0 (0.0%) | 2 (1.9%) |
| $20,000 to $22,499 | 3 (3.3%) | 2 (1.9%) |
| $22,500 to $24,999 | 6 (6.6%) | 1 (1.0%) |
| $25,000 to $29,999 | 13 (14.3%) | 17 (16.5%) |
| $30,000 to $34,999 | 11 (12.1%) | 26 (25.2%) |
| $35,000 to $39,999 | 2 (2.2%) | 9 (8.7%) |
| $40,000 to $44,999 | 2 (2.2%) | 3 (2.9%) |
| $45,000 to $49,999 | 14 (15.4%) | 0 (0.0%) |
| $50,000 to $54,999 | 1 (1.1%) | 0 (0.0%) |
| $55,000 to $64,999 | 20 (22.0%) | 4 (3.9%) |
| $65,000 to $74,999 | 17 (18.7%) | 4 (3.9%) |
| $75,000 to $99,999 | 0 (0.0%) | 4 (3.9%) |
| $100,000+ | 0 (0.0%) | 0 (0.0%) |
| Total | 91 (100.0%) | 103 (100.0%) |
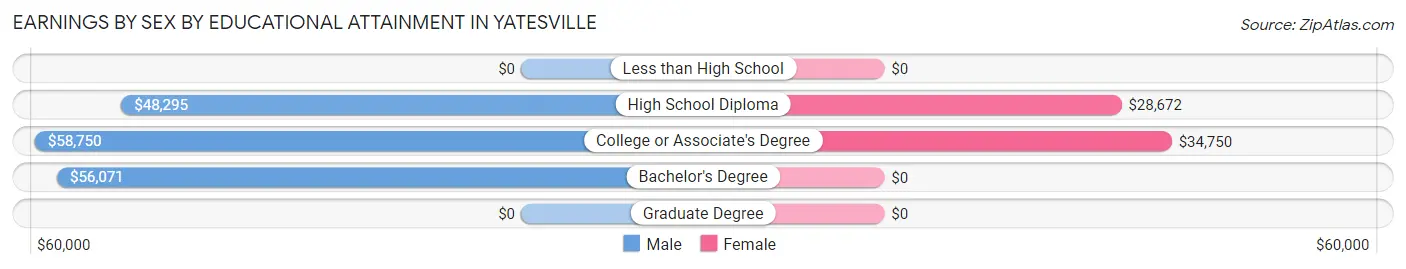
Earnings by Sex by Educational Attainment in Yatesville
Average earnings in Yatesville are $49,205 for men and $32,788 for women, a difference of 33.4%. Men with an educational attainment of college or associate's degree enjoy the highest average annual earnings of $58,750, while those with high school diploma education earn the least with $48,295. Women with an educational attainment of college or associate's degree earn the most with the average annual earnings of $34,750, while those with high school diploma education have the smallest earnings of $28,672.
| Educational Attainment | Male Income | Female Income |
| Less than High School | - | - |
| High School Diploma | $48,295 | $28,672 |
| College or Associate's Degree | $58,750 | $34,750 |
| Bachelor's Degree | $56,071 | $0 |
| Graduate Degree | - | - |
| Total | $49,205 | $32,788 |
Family Income in Yatesville
Family Income Brackets in Yatesville
According to the Yatesville family income data, there are 32 families falling into the $100,000 to $149,999 income range, which is the most common income bracket and makes up 27.4% of all families.
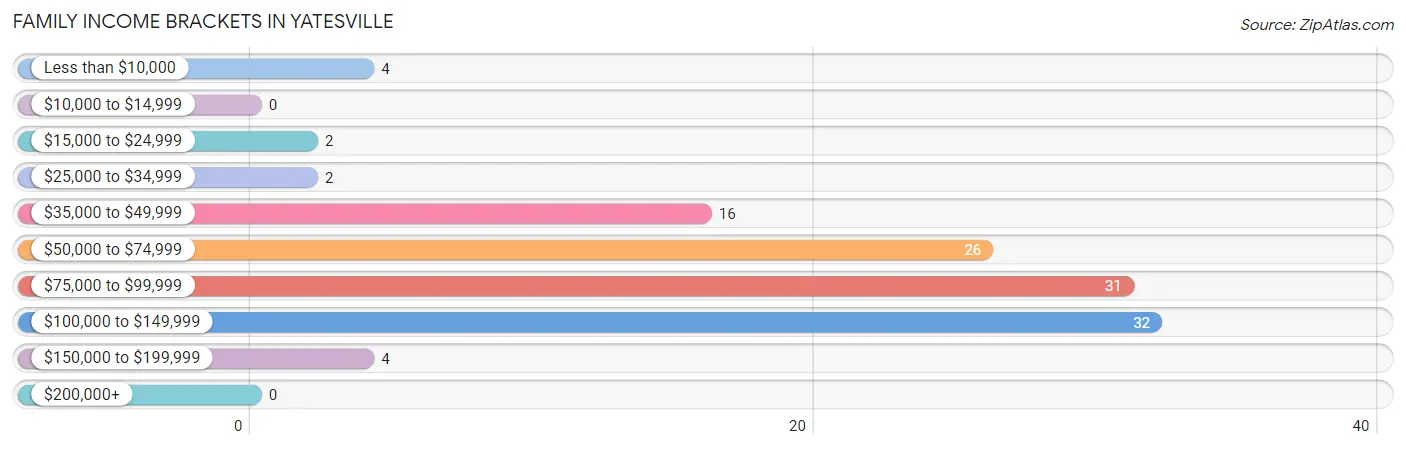
| Income Bracket | # Families | % Families |
| Less than $10,000 | 4 | 3.4% |
| $10,000 to $14,999 | 0 | 0.0% |
| $15,000 to $24,999 | 2 | 1.7% |
| $25,000 to $34,999 | 2 | 1.7% |
| $35,000 to $49,999 | 16 | 13.7% |
| $50,000 to $74,999 | 26 | 22.2% |
| $75,000 to $99,999 | 31 | 26.5% |
| $100,000 to $149,999 | 32 | 27.4% |
| $150,000 to $199,999 | 4 | 3.4% |
| $200,000+ | 0 | 0.0% |
Family Income by Famaliy Size in Yatesville
4-person families (13 | 11.1%) account for the highest median family income in Yatesville with $116,250 per family, while 2-person families (80 | 68.4%) have the highest median income of $41,750 per family member.
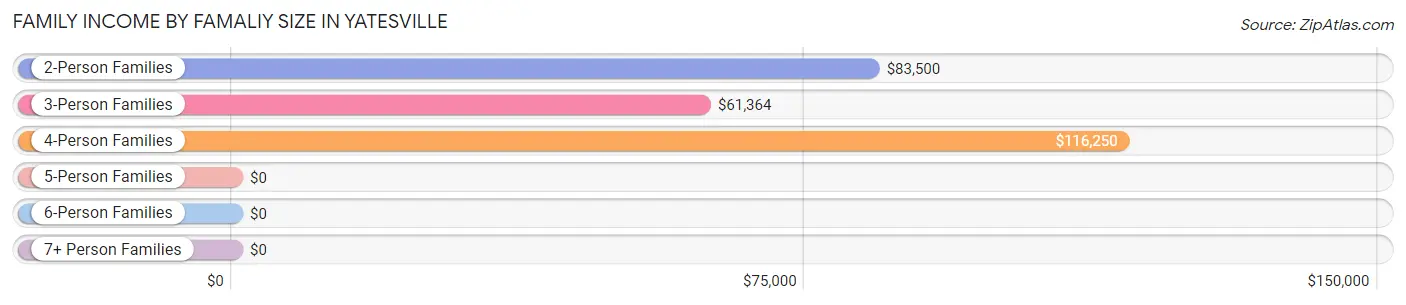
| Income Bracket | # Families | Median Income |
| 2-Person Families | 80 (68.4%) | $83,500 |
| 3-Person Families | 22 (18.8%) | $61,364 |
| 4-Person Families | 13 (11.1%) | $116,250 |
| 5-Person Families | 2 (1.7%) | $0 |
| 6-Person Families | 0 (0.0%) | $0 |
| 7+ Person Families | 0 (0.0%) | $0 |
| Total | 117 (100.0%) | $82,583 |
Family Income by Number of Earners in Yatesville
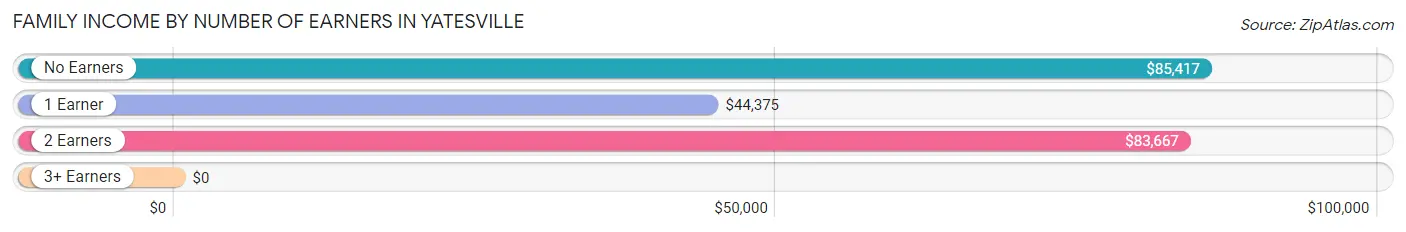
| Number of Earners | # Families | Median Income |
| No Earners | 17 (14.5%) | $85,417 |
| 1 Earner | 30 (25.6%) | $44,375 |
| 2 Earners | 68 (58.1%) | $83,667 |
| 3+ Earners | 2 (1.7%) | $0 |
| Total | 117 (100.0%) | $82,583 |
Household Income in Yatesville
Household Income Brackets in Yatesville
With 33 households falling in the category, the $75,000 to $99,999 income range is the most frequent in Yatesville, accounting for 20.5% of all households.
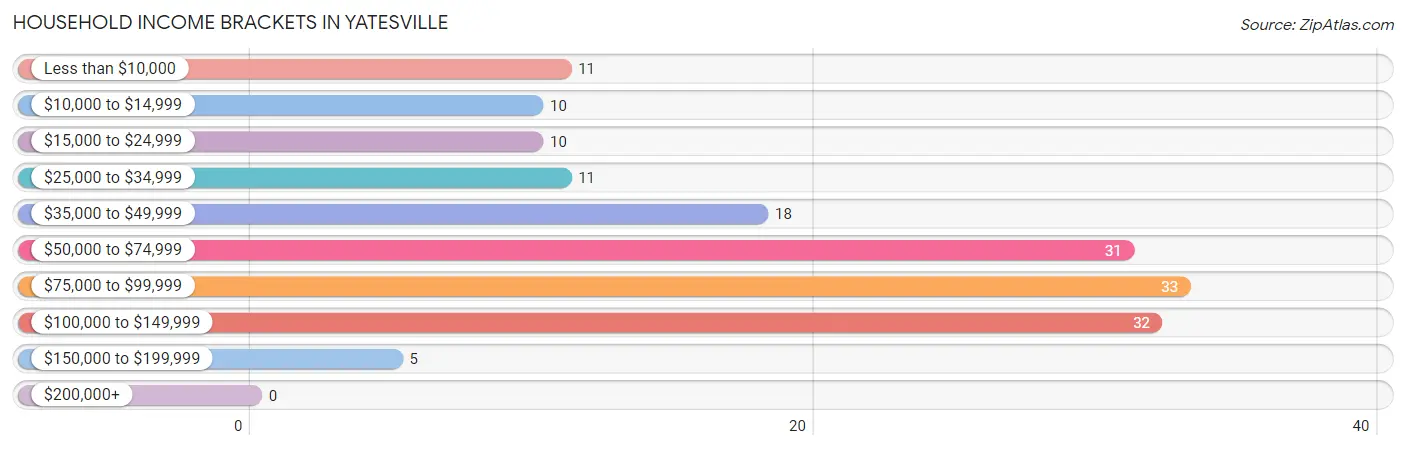
| Income Bracket | # Households | % Households |
| Less than $10,000 | 11 | 6.8% |
| $10,000 to $14,999 | 10 | 6.2% |
| $15,000 to $24,999 | 10 | 6.2% |
| $25,000 to $34,999 | 11 | 6.8% |
| $35,000 to $49,999 | 18 | 11.2% |
| $50,000 to $74,999 | 31 | 19.3% |
| $75,000 to $99,999 | 33 | 20.5% |
| $100,000 to $149,999 | 32 | 19.9% |
| $150,000 to $199,999 | 5 | 3.1% |
| $200,000+ | 0 | 0.0% |
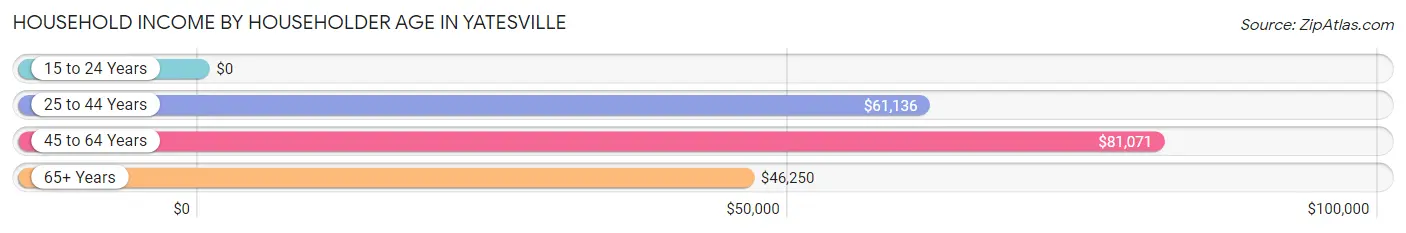
Household Income by Householder Age in Yatesville
The median household income in Yatesville is $62,019, with the highest median household income of $81,071 found in the 45 to 64 years age bracket for the primary householder. A total of 84 households (52.2%) fall into this category. Meanwhile, the 15 to 24 years age bracket for the primary householder has the lowest median household income of $0, with 2 households (1.2%) in this group.
| Income Bracket | # Households | Median Income |
| 15 to 24 Years | 2 (1.2%) | $0 |
| 25 to 44 Years | 30 (18.6%) | $61,136 |
| 45 to 64 Years | 84 (52.2%) | $81,071 |
| 65+ Years | 45 (28.0%) | $46,250 |
| Total | 161 (100.0%) | $62,019 |
Poverty in Yatesville
Income Below Poverty by Sex and Age in Yatesville
With 5.7% poverty level for males and 11.0% for females among the residents of Yatesville, 75 year old and over males and 75 year old and over females are the most vulnerable to poverty, with 5 males (45.5%) and 7 females (36.8%) in their respective age groups living below the poverty level.
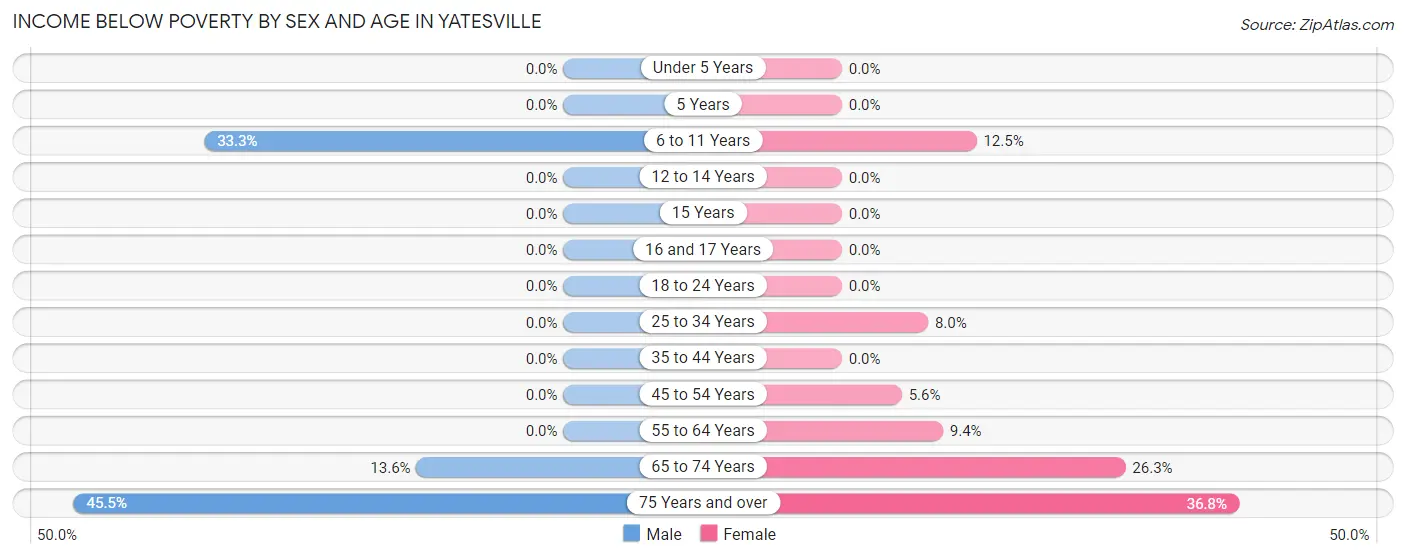
| Age Bracket | Male | Female |
| Under 5 Years | 0 (0.0%) | 0 (0.0%) |
| 5 Years | 0 (0.0%) | 0 (0.0%) |
| 6 to 11 Years | 1 (33.3%) | 1 (12.5%) |
| 12 to 14 Years | 0 (0.0%) | 0 (0.0%) |
| 15 Years | 0 (0.0%) | 0 (0.0%) |
| 16 and 17 Years | 0 (0.0%) | 0 (0.0%) |
| 18 to 24 Years | 0 (0.0%) | 0 (0.0%) |
| 25 to 34 Years | 0 (0.0%) | 2 (8.0%) |
| 35 to 44 Years | 0 (0.0%) | 0 (0.0%) |
| 45 to 54 Years | 0 (0.0%) | 1 (5.6%) |
| 55 to 64 Years | 0 (0.0%) | 6 (9.4%) |
| 65 to 74 Years | 3 (13.6%) | 5 (26.3%) |
| 75 Years and over | 5 (45.5%) | 7 (36.8%) |
| Total | 9 (5.7%) | 22 (11.0%) |
Income Above Poverty by Sex and Age in Yatesville
According to the poverty statistics in Yatesville, males aged under 5 years and females aged under 5 years are the age groups that are most secure financially, with 100.0% of males and 100.0% of females in these age groups living above the poverty line.
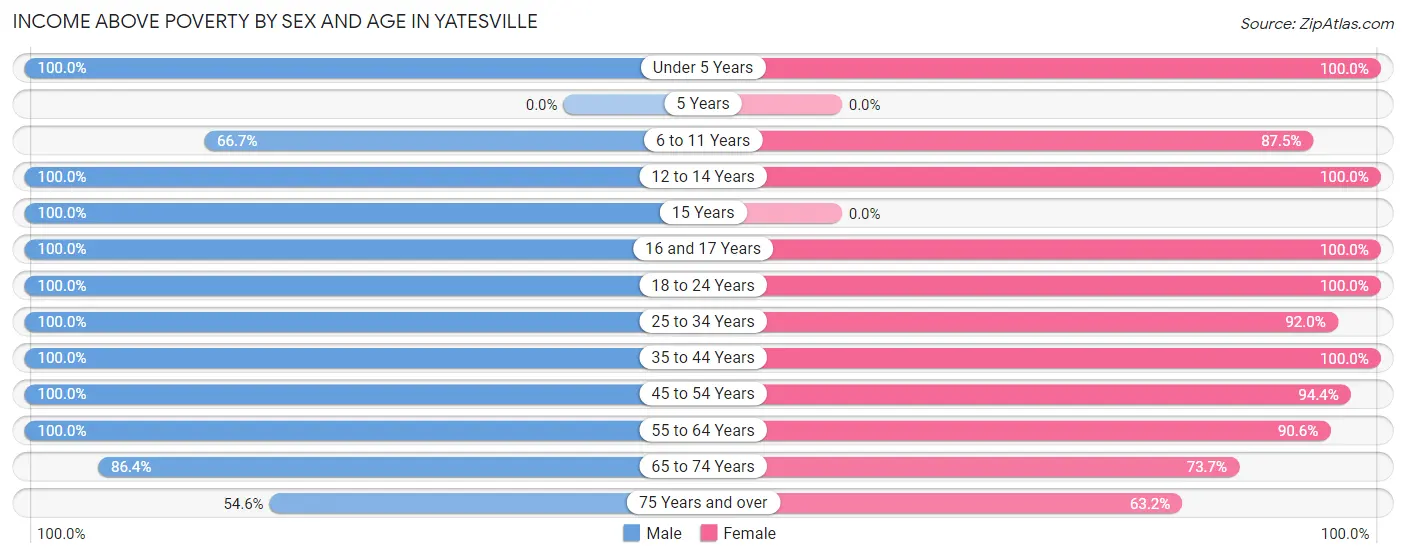
| Age Bracket | Male | Female |
| Under 5 Years | 4 (100.0%) | 18 (100.0%) |
| 5 Years | 0 (0.0%) | 0 (0.0%) |
| 6 to 11 Years | 2 (66.7%) | 7 (87.5%) |
| 12 to 14 Years | 2 (100.0%) | 5 (100.0%) |
| 15 Years | 1 (100.0%) | 0 (0.0%) |
| 16 and 17 Years | 5 (100.0%) | 4 (100.0%) |
| 18 to 24 Years | 8 (100.0%) | 9 (100.0%) |
| 25 to 34 Years | 19 (100.0%) | 23 (92.0%) |
| 35 to 44 Years | 12 (100.0%) | 11 (100.0%) |
| 45 to 54 Years | 37 (100.0%) | 17 (94.4%) |
| 55 to 64 Years | 34 (100.0%) | 58 (90.6%) |
| 65 to 74 Years | 19 (86.4%) | 14 (73.7%) |
| 75 Years and over | 6 (54.5%) | 12 (63.2%) |
| Total | 149 (94.3%) | 178 (89.0%) |
Income Below Poverty Among Married-Couple Families in Yatesville
The poverty statistics for married-couple families in Yatesville show that 4.1% or 4 of the total 98 families live below the poverty line. Families with no children have the highest poverty rate of 5.3%, comprising of 4 families. On the other hand, families with 1 or 2 children have the lowest poverty rate of 0.0%, which includes 0 families.
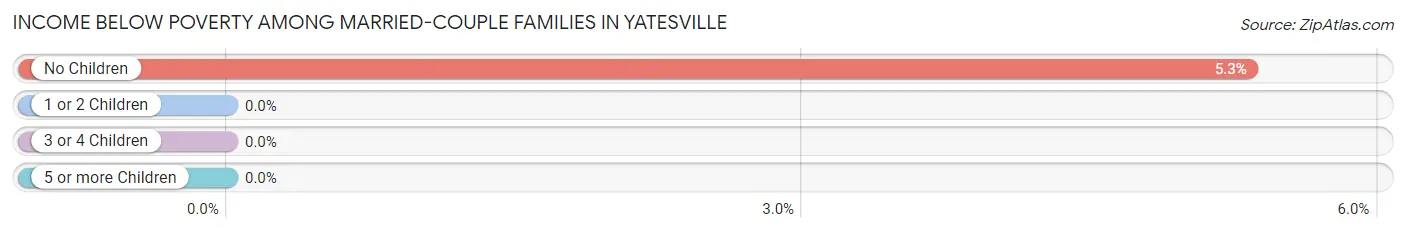
| Children | Above Poverty | Below Poverty |
| No Children | 71 (94.7%) | 4 (5.3%) |
| 1 or 2 Children | 22 (100.0%) | 0 (0.0%) |
| 3 or 4 Children | 1 (100.0%) | 0 (0.0%) |
| 5 or more Children | 0 (0.0%) | 0 (0.0%) |
| Total | 94 (95.9%) | 4 (4.1%) |
Income Below Poverty Among Single-Parent Households in Yatesville
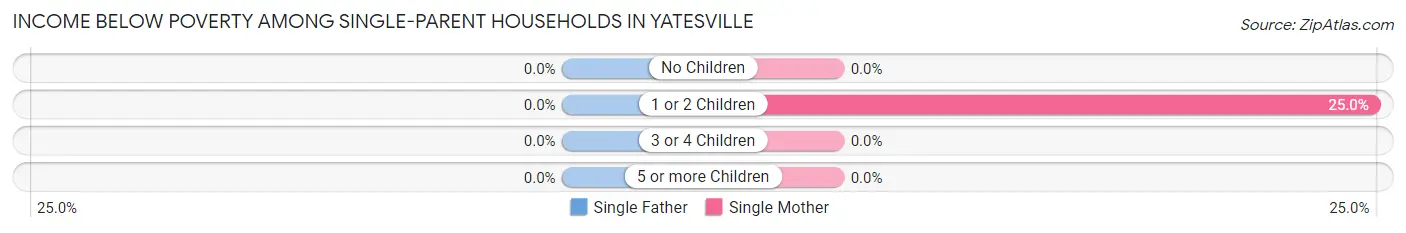
| Children | Single Father | Single Mother |
| No Children | 0 (0.0%) | 0 (0.0%) |
| 1 or 2 Children | 0 (0.0%) | 2 (25.0%) |
| 3 or 4 Children | 0 (0.0%) | 0 (0.0%) |
| 5 or more Children | 0 (0.0%) | 0 (0.0%) |
| Total | 0 (0.0%) | 2 (13.3%) |
Income Below Poverty Among Married-Couple vs Single-Parent Households in Yatesville
The poverty data for Yatesville shows that 4 of the married-couple family households (4.1%) and 2 of the single-parent households (10.5%) are living below the poverty level. Within the married-couple family households, those with no children have the highest poverty rate, with 4 households (5.3%) falling below the poverty line. Among the single-parent households, those with 1 or 2 children have the highest poverty rate, with 2 household (16.7%) living below poverty.
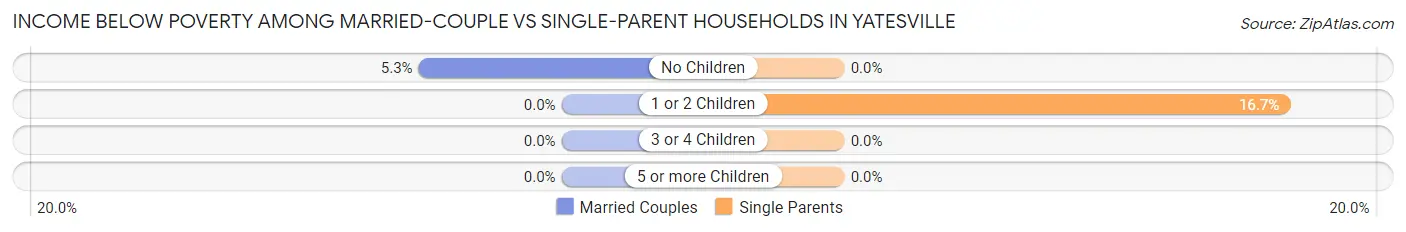
| Children | Married-Couple Families | Single-Parent Households |
| No Children | 4 (5.3%) | 0 (0.0%) |
| 1 or 2 Children | 0 (0.0%) | 2 (16.7%) |
| 3 or 4 Children | 0 (0.0%) | 0 (0.0%) |
| 5 or more Children | 0 (0.0%) | 0 (0.0%) |
| Total | 4 (4.1%) | 2 (10.5%) |
Race in Yatesville
The most populous races in Yatesville are White / Caucasian (340 | 95.0%), and Black / African American (18 | 5.0%).
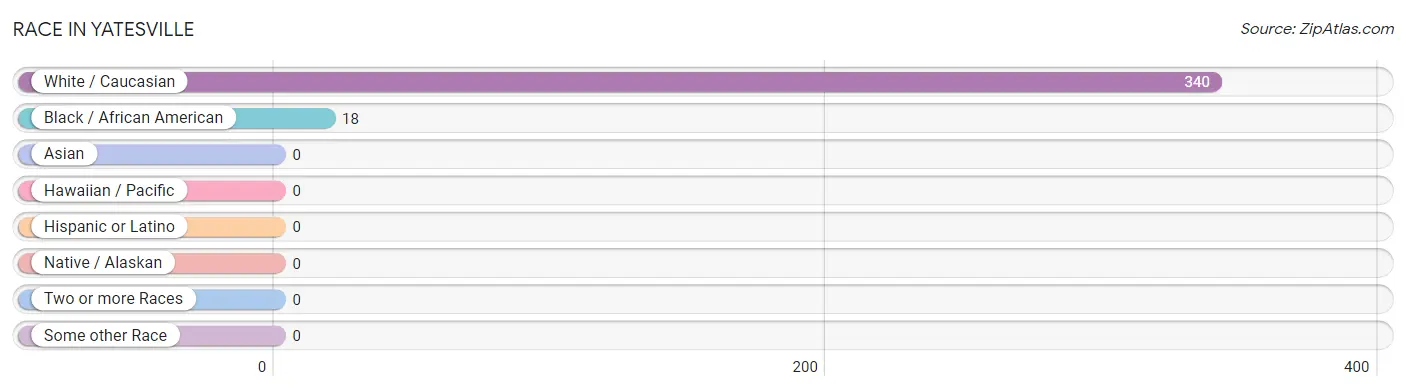
| Race | # Population | % Population |
| Asian | 0 | 0.0% |
| Black / African American | 18 | 5.0% |
| Hawaiian / Pacific | 0 | 0.0% |
| Hispanic or Latino | 0 | 0.0% |
| Native / Alaskan | 0 | 0.0% |
| White / Caucasian | 340 | 95.0% |
| Two or more Races | 0 | 0.0% |
| Some other Race | 0 | 0.0% |
| Total | 358 | 100.0% |
Ancestry in Yatesville
The most populous ancestries reported in Yatesville are American (52 | 14.5%), English (42 | 11.7%), Irish (22 | 6.1%), British (6 | 1.7%), and Scottish (6 | 1.7%), together accounting for 35.8% of all Yatesville residents.
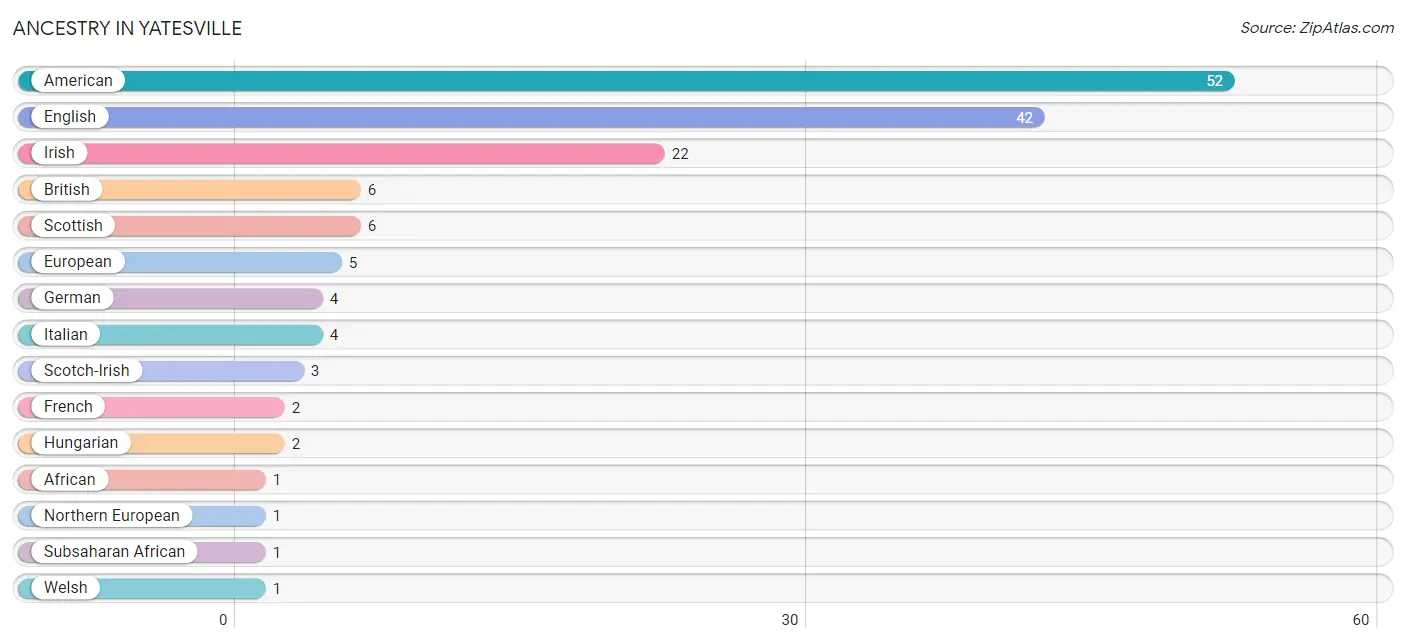
| Ancestry | # Population | % Population |
| African | 1 | 0.3% |
| American | 52 | 14.5% |
| British | 6 | 1.7% |
| English | 42 | 11.7% |
| European | 5 | 1.4% |
| French | 2 | 0.6% |
| German | 4 | 1.1% |
| Hungarian | 2 | 0.6% |
| Irish | 22 | 6.1% |
| Italian | 4 | 1.1% |
| Northern European | 1 | 0.3% |
| Scotch-Irish | 3 | 0.8% |
| Scottish | 6 | 1.7% |
| Subsaharan African | 1 | 0.3% |
| Welsh | 1 | 0.3% | View All 15 Rows |
Immigrants in Yatesville

| Immigration Origin | # Population | % Population | View All 0 Rows |
Sex and Age in Yatesville
Sex and Age in Yatesville
The most populous age groups in Yatesville are 50 to 54 Years (37 | 23.4%) for men and 55 to 59 Years (38 | 19.0%) for women.
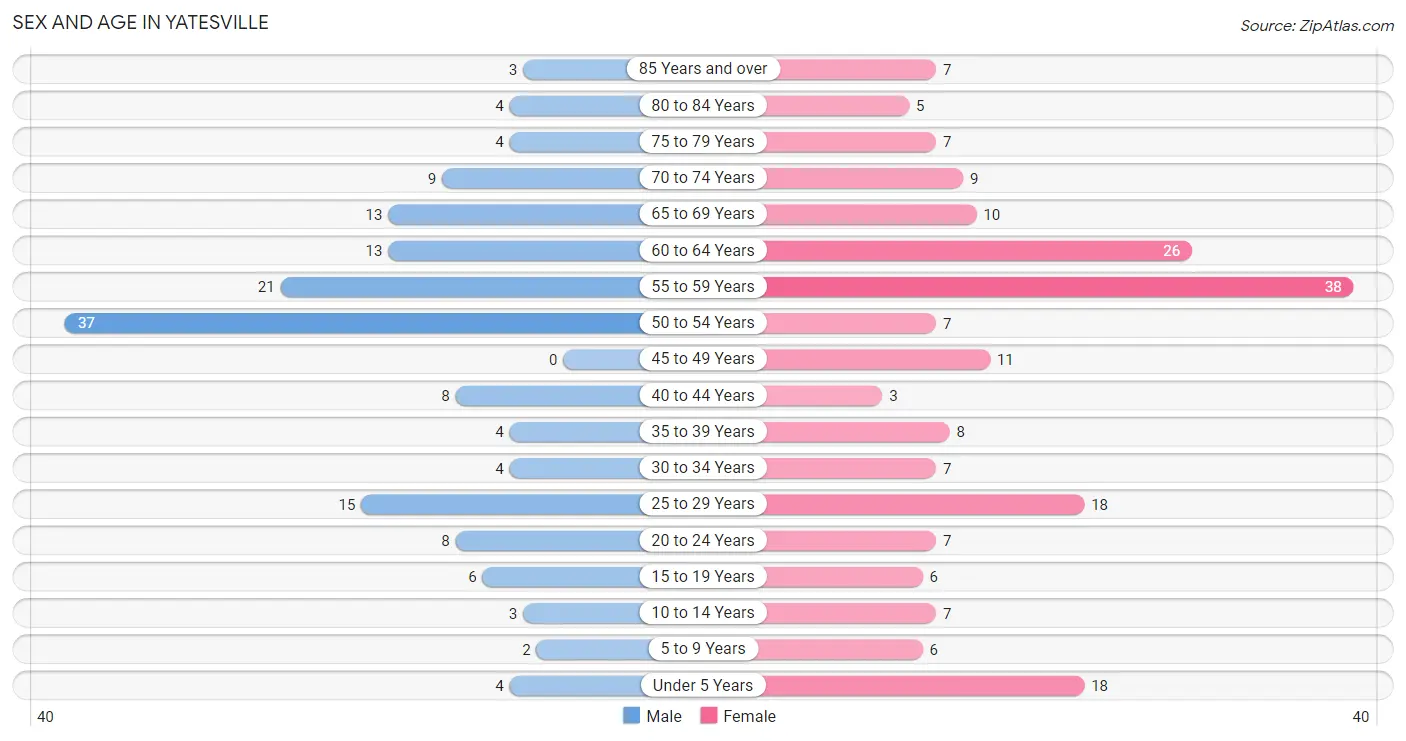
| Age Bracket | Male | Female |
| Under 5 Years | 4 (2.5%) | 18 (9.0%) |
| 5 to 9 Years | 2 (1.3%) | 6 (3.0%) |
| 10 to 14 Years | 3 (1.9%) | 7 (3.5%) |
| 15 to 19 Years | 6 (3.8%) | 6 (3.0%) |
| 20 to 24 Years | 8 (5.1%) | 7 (3.5%) |
| 25 to 29 Years | 15 (9.5%) | 18 (9.0%) |
| 30 to 34 Years | 4 (2.5%) | 7 (3.5%) |
| 35 to 39 Years | 4 (2.5%) | 8 (4.0%) |
| 40 to 44 Years | 8 (5.1%) | 3 (1.5%) |
| 45 to 49 Years | 0 (0.0%) | 11 (5.5%) |
| 50 to 54 Years | 37 (23.4%) | 7 (3.5%) |
| 55 to 59 Years | 21 (13.3%) | 38 (19.0%) |
| 60 to 64 Years | 13 (8.2%) | 26 (13.0%) |
| 65 to 69 Years | 13 (8.2%) | 10 (5.0%) |
| 70 to 74 Years | 9 (5.7%) | 9 (4.5%) |
| 75 to 79 Years | 4 (2.5%) | 7 (3.5%) |
| 80 to 84 Years | 4 (2.5%) | 5 (2.5%) |
| 85 Years and over | 3 (1.9%) | 7 (3.5%) |
| Total | 158 (100.0%) | 200 (100.0%) |
Families and Households in Yatesville
Median Family Size in Yatesville
The median family size in Yatesville is 2.62 persons per family, with single male/father families (4 | 3.4%) accounting for the largest median family size of 5.5 persons per family. On the other hand, married-couple families (98 | 83.8%) represent the smallest median family size with 2.39 persons per family.
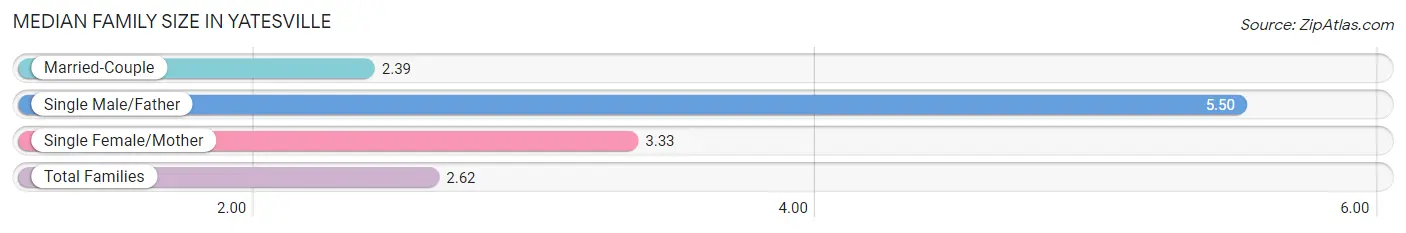
| Family Type | # Families | Family Size |
| Married-Couple | 98 (83.8%) | 2.39 |
| Single Male/Father | 4 (3.4%) | 5.50 |
| Single Female/Mother | 15 (12.8%) | 3.33 |
| Total Families | 117 (100.0%) | 2.62 |
Median Household Size in Yatesville
The median household size in Yatesville is 2.22 persons per household, with single male/father households (4 | 2.5%) accounting for the largest median household size of 5.75 persons per household. non-family households (44 | 27.3%) represent the smallest median household size with 1.09 persons per household.
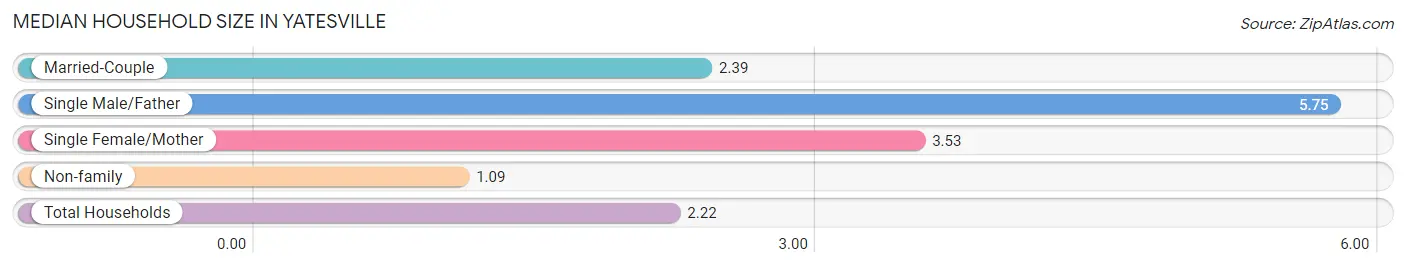
| Household Type | # Households | Household Size |
| Married-Couple | 98 (60.9%) | 2.39 |
| Single Male/Father | 4 (2.5%) | 5.75 |
| Single Female/Mother | 15 (9.3%) | 3.53 |
| Non-family | 44 (27.3%) | 1.09 |
| Total Households | 161 (100.0%) | 2.22 |
Household Size by Marriage Status in Yatesville
Out of a total of 161 households in Yatesville, 117 (72.7%) are family households, while 44 (27.3%) are nonfamily households. The most numerous type of family households are 2-person households, comprising 78, and the most common type of nonfamily households are 1-person households, comprising 39.
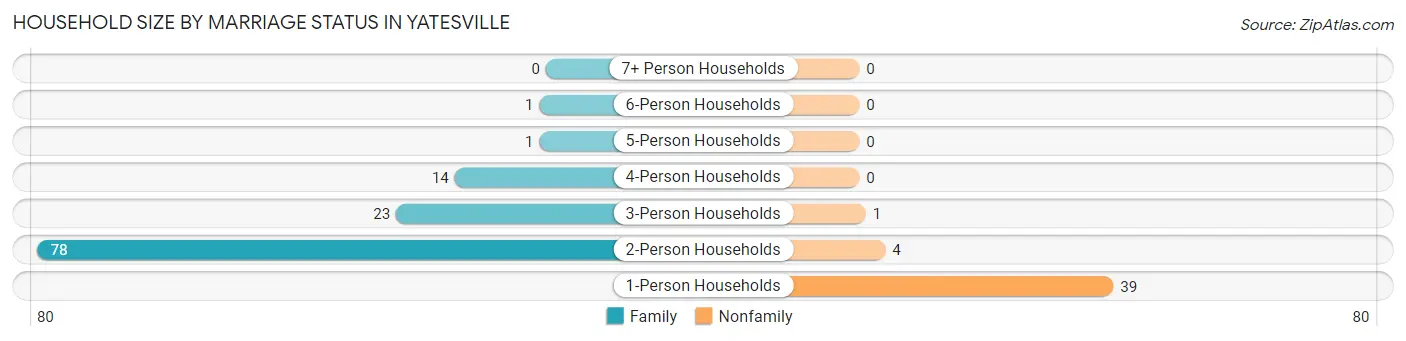
| Household Size | Family Households | Nonfamily Households |
| 1-Person Households | - | 39 (24.2%) |
| 2-Person Households | 78 (48.4%) | 4 (2.5%) |
| 3-Person Households | 23 (14.3%) | 1 (0.6%) |
| 4-Person Households | 14 (8.7%) | 0 (0.0%) |
| 5-Person Households | 1 (0.6%) | 0 (0.0%) |
| 6-Person Households | 1 (0.6%) | 0 (0.0%) |
| 7+ Person Households | 0 (0.0%) | 0 (0.0%) |
| Total | 117 (72.7%) | 44 (27.3%) |
Female Fertility in Yatesville
Fertility by Age in Yatesville
Average fertility rate in Yatesville is 16.0 births per 1,000 women. Women in the age bracket of 20 to 34 years have the highest fertility rate with 31.0 births per 1,000 women. Women in the age bracket of 20 to 34 years acount for 100.0% of all women with births.
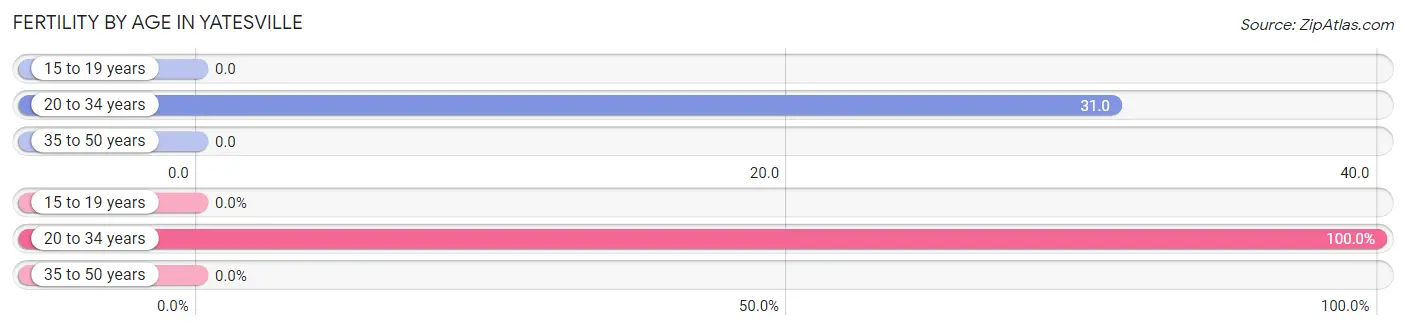
| Age Bracket | Women with Births | Births / 1,000 Women |
| 15 to 19 years | 0 (0.0%) | 0.0 |
| 20 to 34 years | 1 (100.0%) | 31.0 |
| 35 to 50 years | 0 (0.0%) | 0.0 |
| Total | 1 (100.0%) | 16.0 |
Fertility by Age by Marriage Status in Yatesville
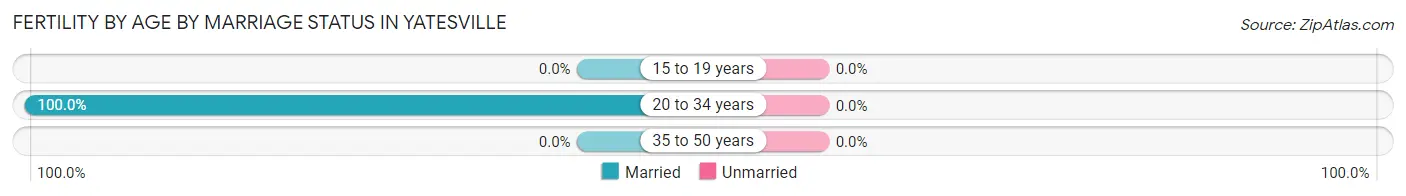
| Age Bracket | Married | Unmarried |
| 15 to 19 years | 0 (0.0%) | 0 (0.0%) |
| 20 to 34 years | 1 (100.0%) | 0 (0.0%) |
| 35 to 50 years | 0 (0.0%) | 0 (0.0%) |
| Total | 1 (100.0%) | 0 (0.0%) |
Fertility by Education in Yatesville
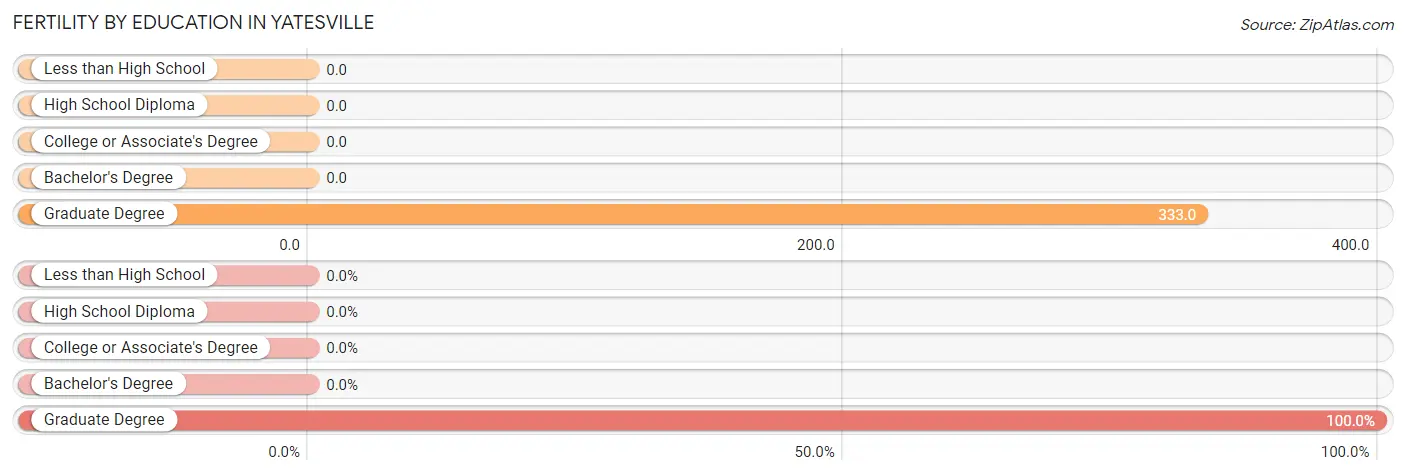
| Educational Attainment | Women with Births | Births / 1,000 Women |
| Less than High School | 0 (0.0%) | 0.0 |
| High School Diploma | 0 (0.0%) | 0.0 |
| College or Associate's Degree | 0 (0.0%) | 0.0 |
| Bachelor's Degree | 0 (0.0%) | 0.0 |
| Graduate Degree | 1 (100.0%) | 333.0 |
| Total | 1 (100.0%) | 16.0 |
Fertility by Education by Marriage Status in Yatesville
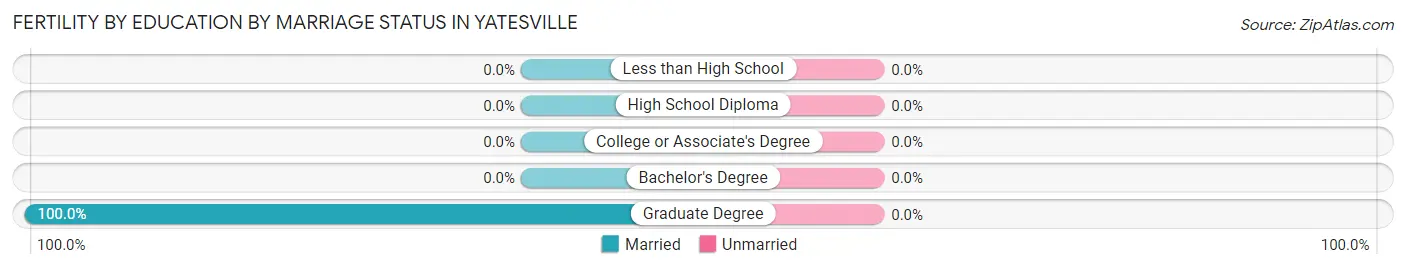
| Educational Attainment | Married | Unmarried |
| Less than High School | 0 (0.0%) | 0 (0.0%) |
| High School Diploma | 0 (0.0%) | 0 (0.0%) |
| College or Associate's Degree | 0 (0.0%) | 0 (0.0%) |
| Bachelor's Degree | 0 (0.0%) | 0 (0.0%) |
| Graduate Degree | 1 (100.0%) | 0 (0.0%) |
| Total | 1 (100.0%) | 0 (0.0%) |
Employment Characteristics in Yatesville
Employment by Class of Employer in Yatesville
Among the 188 employed individuals in Yatesville, private company employees (139 | 73.9%), state government employees (18 | 9.6%), and local government employees (14 | 7.4%) make up the most common classes of employment.
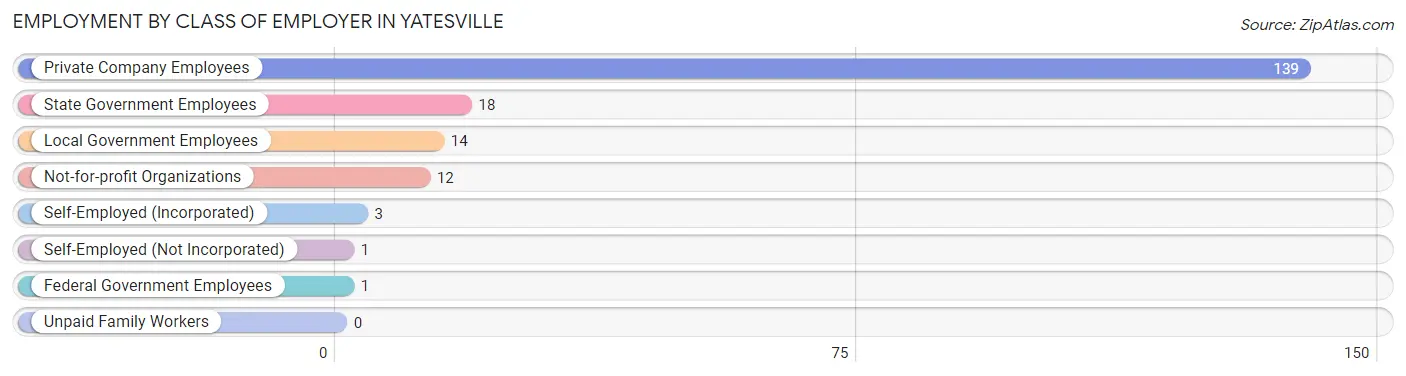
| Employer Class | # Employees | % Employees |
| Private Company Employees | 139 | 73.9% |
| Self-Employed (Incorporated) | 3 | 1.6% |
| Self-Employed (Not Incorporated) | 1 | 0.5% |
| Not-for-profit Organizations | 12 | 6.4% |
| Local Government Employees | 14 | 7.4% |
| State Government Employees | 18 | 9.6% |
| Federal Government Employees | 1 | 0.5% |
| Unpaid Family Workers | 0 | 0.0% |
| Total | 188 | 100.0% |
Employment Status by Age in Yatesville
According to the labor force statistics for Yatesville, out of the total population over 16 years of age (317), 59.9% or 190 individuals are in the labor force, with 1.1% or 2 of them unemployed. The age group with the highest labor force participation rate is 20 to 24 years, with 100.0% or 15 individuals in the labor force. Within the labor force, the 65 to 74 years age range has the highest percentage of unemployed individuals, with 16.7% or 1 of them being unemployed.
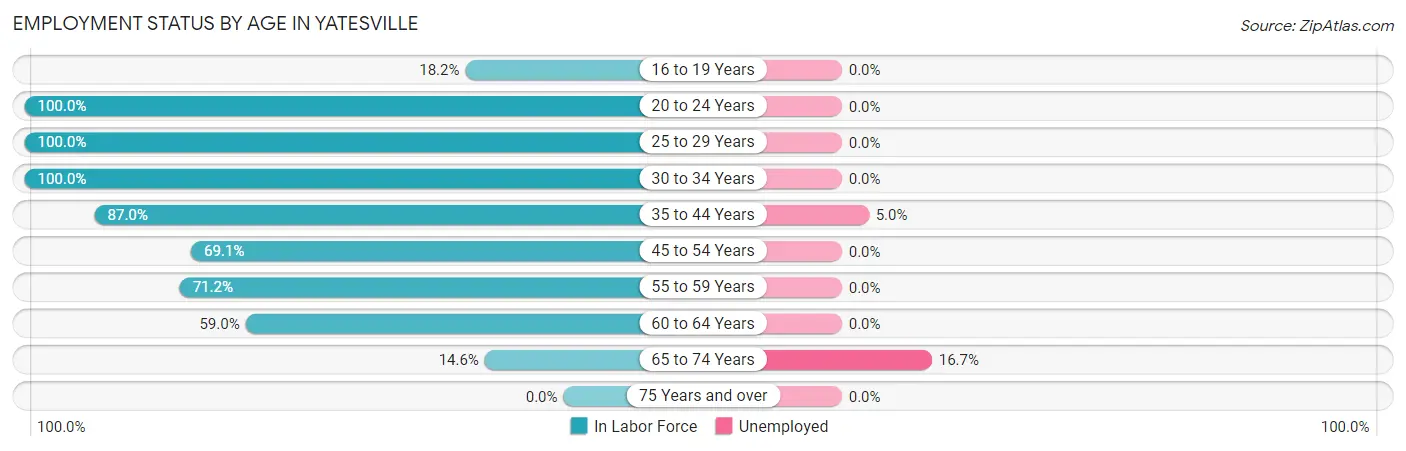
| Age Bracket | In Labor Force | Unemployed |
| 16 to 19 Years | 2 (18.2%) | 0 (0.0%) |
| 20 to 24 Years | 15 (100.0%) | 0 (0.0%) |
| 25 to 29 Years | 33 (100.0%) | 0 (0.0%) |
| 30 to 34 Years | 11 (100.0%) | 0 (0.0%) |
| 35 to 44 Years | 20 (87.0%) | 1 (5.0%) |
| 45 to 54 Years | 38 (69.1%) | 0 (0.0%) |
| 55 to 59 Years | 42 (71.2%) | 0 (0.0%) |
| 60 to 64 Years | 23 (59.0%) | 0 (0.0%) |
| 65 to 74 Years | 6 (14.6%) | 1 (16.7%) |
| 75 Years and over | 0 (0.0%) | 0 (0.0%) |
| Total | 190 (59.9%) | 2 (1.1%) |
Employment Status by Educational Attainment in Yatesville
According to labor force statistics for Yatesville, 75.9% of individuals (167) out of the total population between 25 and 64 years of age (220) are in the labor force, with 0.6% or 1 of them being unemployed. The group with the highest labor force participation rate are those with the educational attainment of bachelor's degree or higher, with 85.0% or 17 individuals in the labor force. Within the labor force, individuals with high school diploma education have the highest percentage of unemployment, with 1.3% or 1 of them being unemployed.
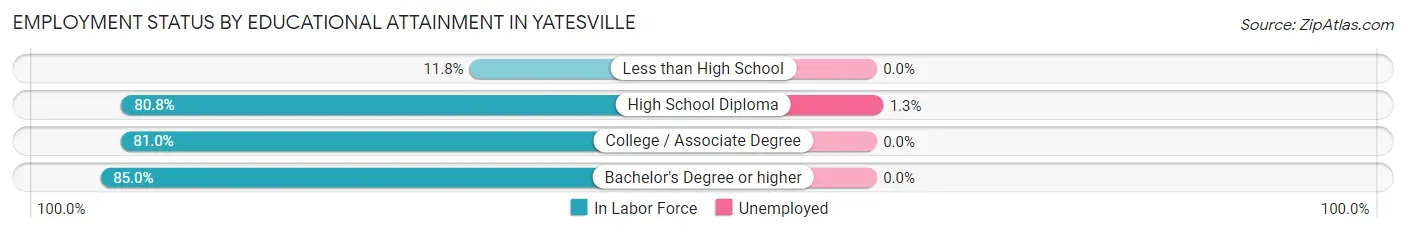
| Educational Attainment | In Labor Force | Unemployed |
| Less than High School | 2 (11.8%) | 0 (0.0%) |
| High School Diploma | 80 (80.8%) | 1 (1.3%) |
| College / Associate Degree | 68 (81.0%) | 0 (0.0%) |
| Bachelor's Degree or higher | 17 (85.0%) | 0 (0.0%) |
| Total | 167 (75.9%) | 1 (0.6%) |
Employment Occupations by Sex in Yatesville
Management, Business, Science and Arts Occupations
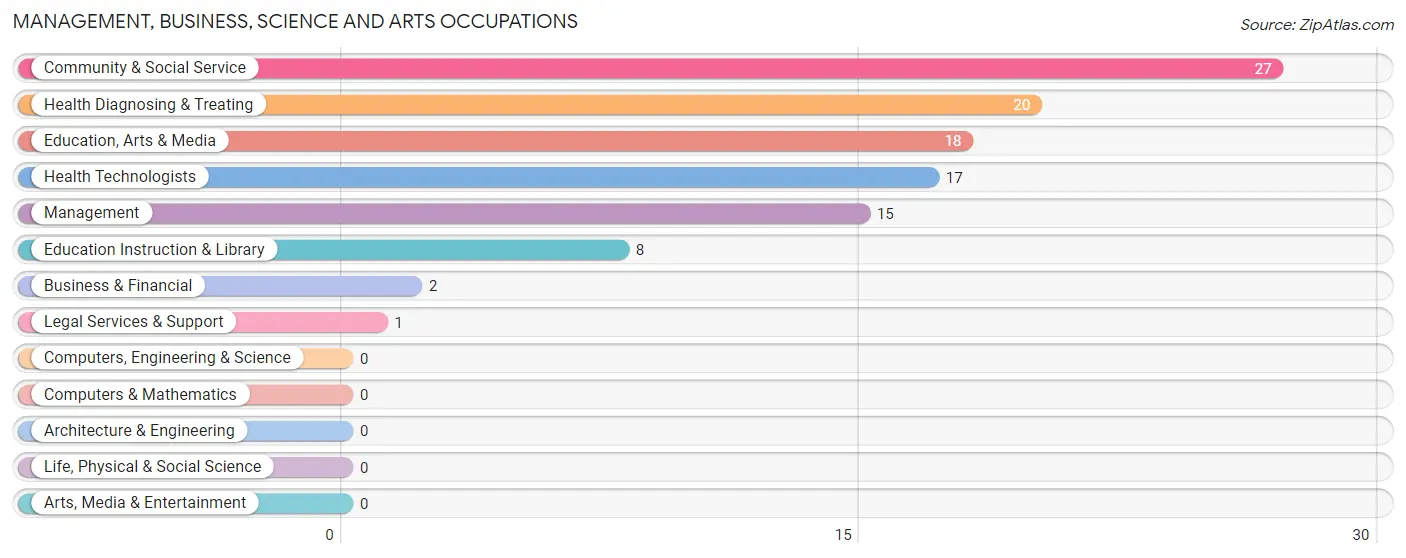
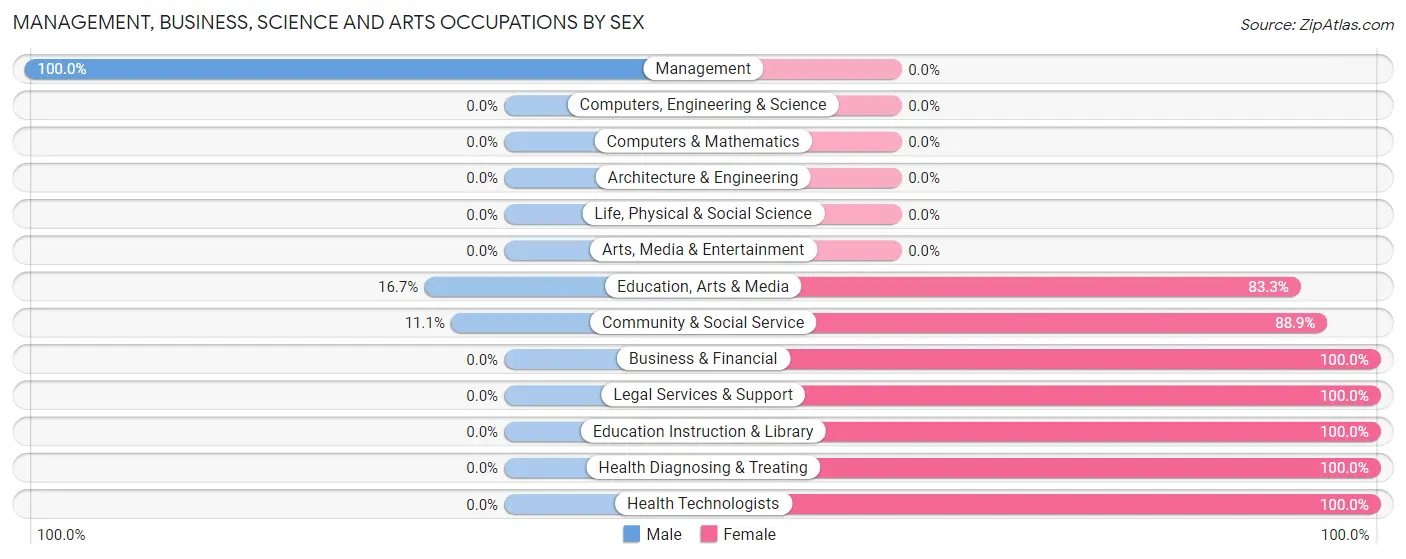
The most common Management, Business, Science and Arts occupations in Yatesville are Community & Social Service (27 | 14.4%), Health Diagnosing & Treating (20 | 10.6%), Education, Arts & Media (18 | 9.6%), Health Technologists (17 | 9.0%), and Management (15 | 8.0%).
Management, Business, Science and Arts Occupations by Sex
Within the Management, Business, Science and Arts occupations in Yatesville, the most male-oriented occupations are Management (100.0%), Education, Arts & Media (16.7%), and Community & Social Service (11.1%), while the most female-oriented occupations are Business & Financial (100.0%), Legal Services & Support (100.0%), and Education Instruction & Library (100.0%).
| Occupation | Male | Female |
| Management | 15 (100.0%) | 0 (0.0%) |
| Business & Financial | 0 (0.0%) | 2 (100.0%) |
| Computers, Engineering & Science | 0 (0.0%) | 0 (0.0%) |
| Computers & Mathematics | 0 (0.0%) | 0 (0.0%) |
| Architecture & Engineering | 0 (0.0%) | 0 (0.0%) |
| Life, Physical & Social Science | 0 (0.0%) | 0 (0.0%) |
| Community & Social Service | 3 (11.1%) | 24 (88.9%) |
| Education, Arts & Media | 3 (16.7%) | 15 (83.3%) |
| Legal Services & Support | 0 (0.0%) | 1 (100.0%) |
| Education Instruction & Library | 0 (0.0%) | 8 (100.0%) |
| Arts, Media & Entertainment | 0 (0.0%) | 0 (0.0%) |
| Health Diagnosing & Treating | 0 (0.0%) | 20 (100.0%) |
| Health Technologists | 0 (0.0%) | 17 (100.0%) |
| Total (Category) | 18 (28.1%) | 46 (71.9%) |
| Total (Overall) | 89 (47.3%) | 99 (52.7%) |
Services Occupations
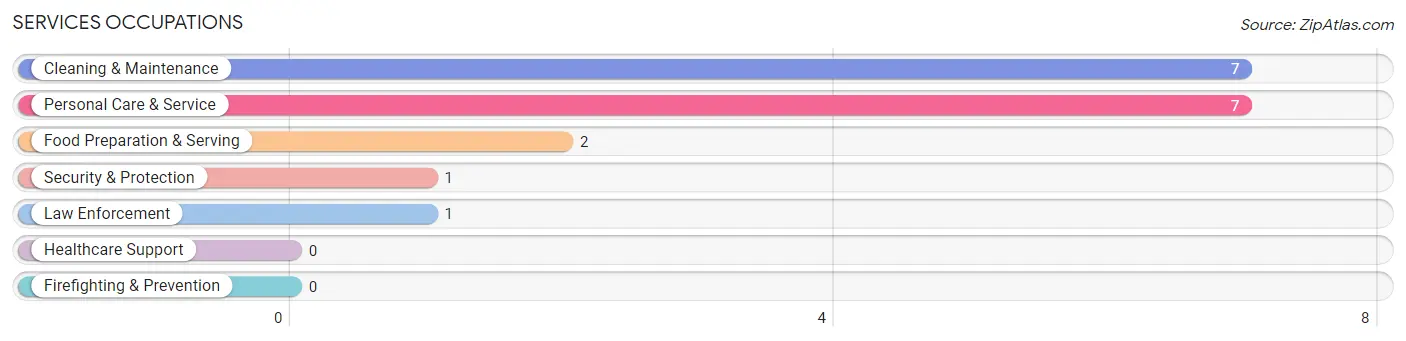
The most common Services occupations in Yatesville are Cleaning & Maintenance (7 | 3.7%), Personal Care & Service (7 | 3.7%), Food Preparation & Serving (2 | 1.1%), Security & Protection (1 | 0.5%), and Law Enforcement (1 | 0.5%).
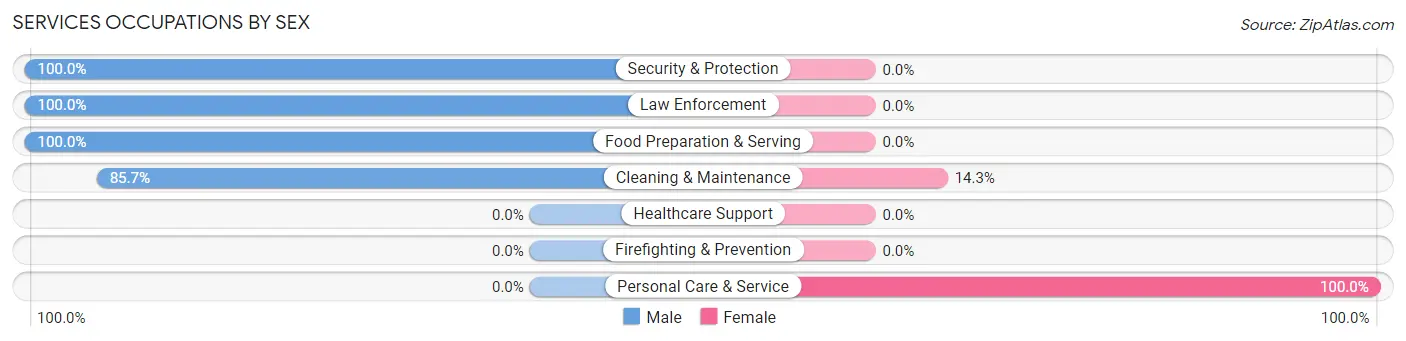
Services Occupations by Sex
Within the Services occupations in Yatesville, the most male-oriented occupations are Security & Protection (100.0%), Law Enforcement (100.0%), and Food Preparation & Serving (100.0%), while the most female-oriented occupations are Personal Care & Service (100.0%), and Cleaning & Maintenance (14.3%).
| Occupation | Male | Female |
| Healthcare Support | 0 (0.0%) | 0 (0.0%) |
| Security & Protection | 1 (100.0%) | 0 (0.0%) |
| Firefighting & Prevention | 0 (0.0%) | 0 (0.0%) |
| Law Enforcement | 1 (100.0%) | 0 (0.0%) |
| Food Preparation & Serving | 2 (100.0%) | 0 (0.0%) |
| Cleaning & Maintenance | 6 (85.7%) | 1 (14.3%) |
| Personal Care & Service | 0 (0.0%) | 7 (100.0%) |
| Total (Category) | 9 (52.9%) | 8 (47.1%) |
| Total (Overall) | 89 (47.3%) | 99 (52.7%) |
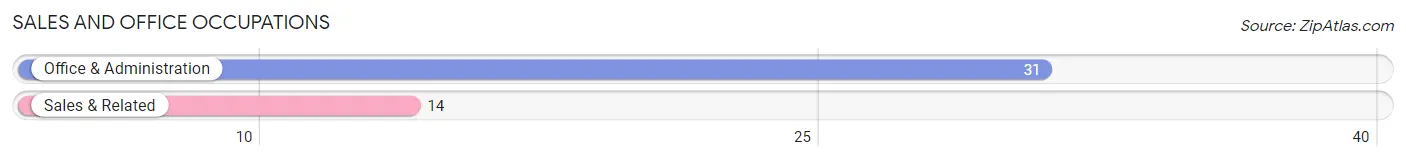
Sales and Office Occupations
The most common Sales and Office occupations in Yatesville are Office & Administration (31 | 16.5%), and Sales & Related (14 | 7.4%).
Sales and Office Occupations by Sex

| Occupation | Male | Female |
| Sales & Related | 7 (50.0%) | 7 (50.0%) |
| Office & Administration | 2 (6.5%) | 29 (93.5%) |
| Total (Category) | 9 (20.0%) | 36 (80.0%) |
| Total (Overall) | 89 (47.3%) | 99 (52.7%) |
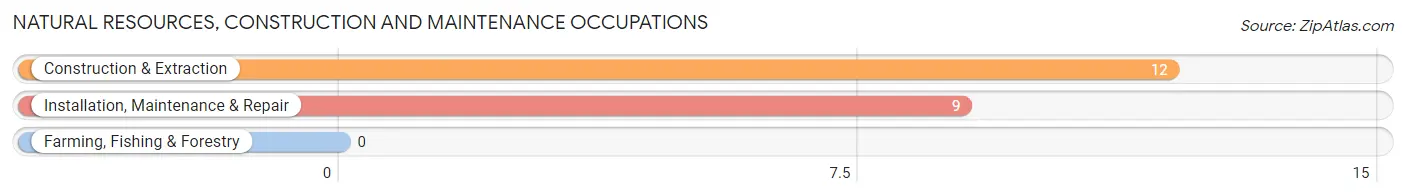
Natural Resources, Construction and Maintenance Occupations
The most common Natural Resources, Construction and Maintenance occupations in Yatesville are Construction & Extraction (12 | 6.4%), and Installation, Maintenance & Repair (9 | 4.8%).
Natural Resources, Construction and Maintenance Occupations by Sex
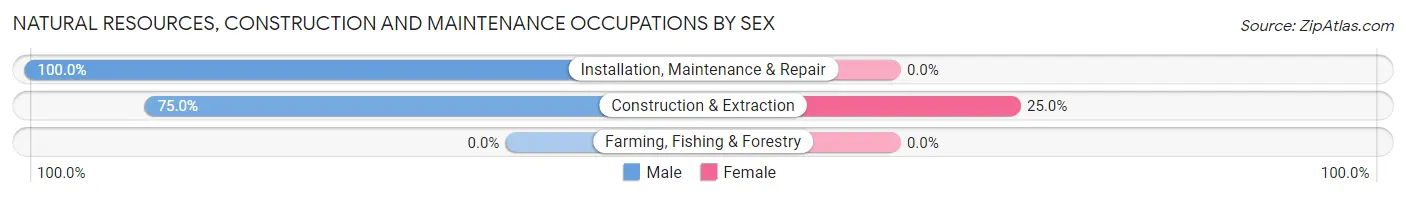
| Occupation | Male | Female |
| Farming, Fishing & Forestry | 0 (0.0%) | 0 (0.0%) |
| Construction & Extraction | 9 (75.0%) | 3 (25.0%) |
| Installation, Maintenance & Repair | 9 (100.0%) | 0 (0.0%) |
| Total (Category) | 18 (85.7%) | 3 (14.3%) |
| Total (Overall) | 89 (47.3%) | 99 (52.7%) |
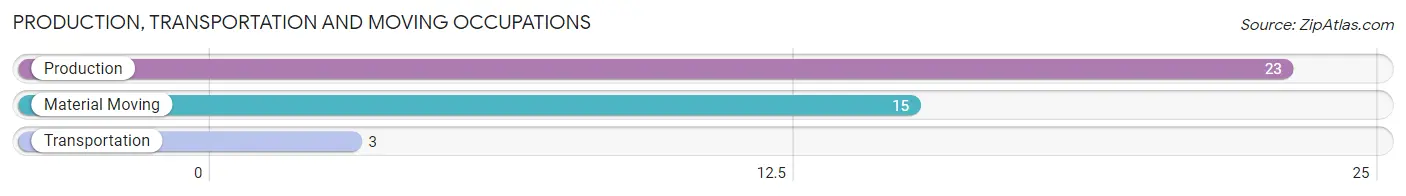
Production, Transportation and Moving Occupations
The most common Production, Transportation and Moving occupations in Yatesville are Production (23 | 12.2%), Material Moving (15 | 8.0%), and Transportation (3 | 1.6%).
Production, Transportation and Moving Occupations by Sex
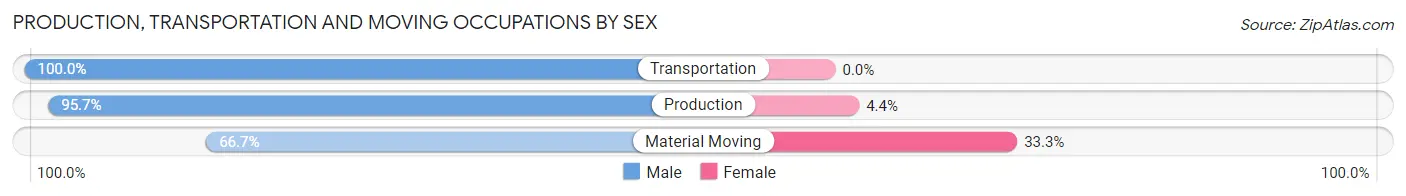
| Occupation | Male | Female |
| Production | 22 (95.7%) | 1 (4.3%) |
| Transportation | 3 (100.0%) | 0 (0.0%) |
| Material Moving | 10 (66.7%) | 5 (33.3%) |
| Total (Category) | 35 (85.4%) | 6 (14.6%) |
| Total (Overall) | 89 (47.3%) | 99 (52.7%) |
Employment Industries by Sex in Yatesville
Employment Industries in Yatesville
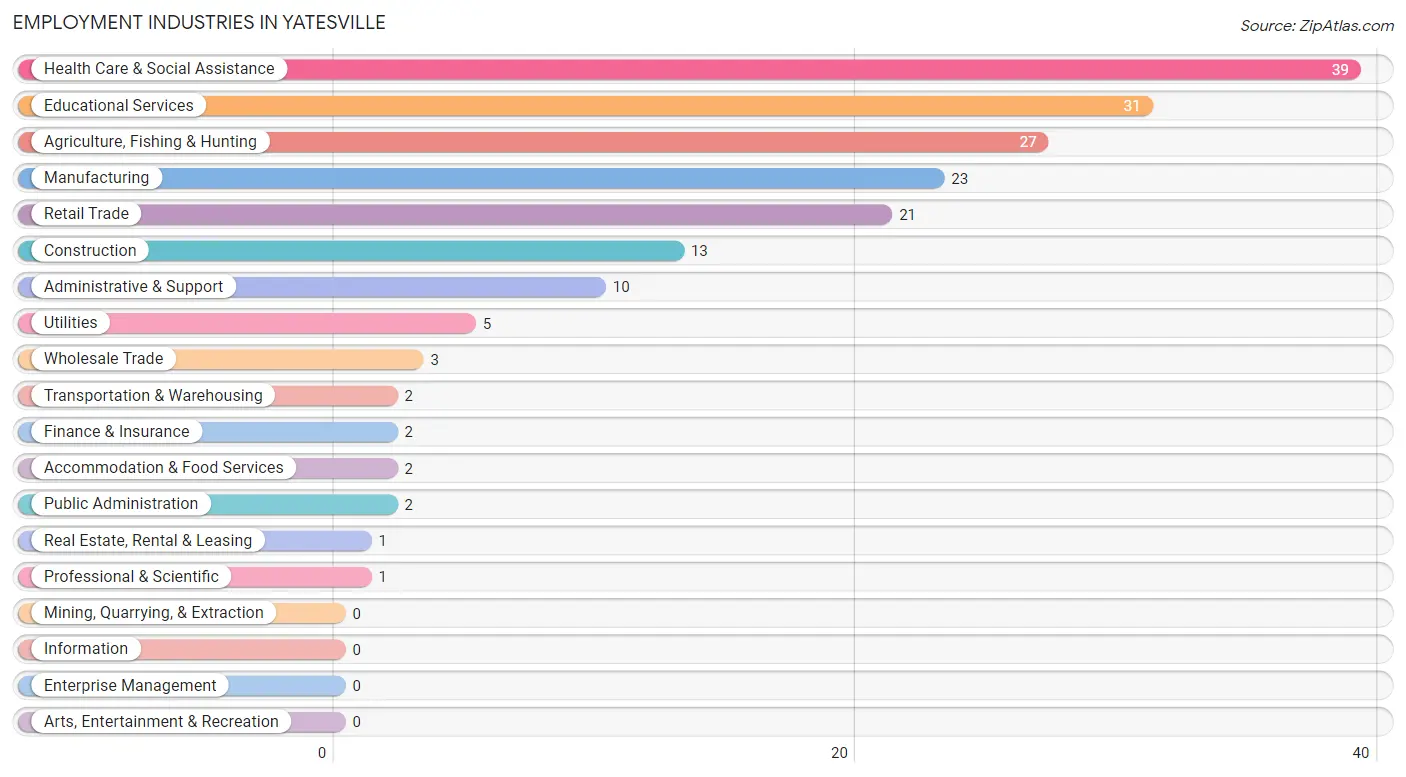
The major employment industries in Yatesville include Health Care & Social Assistance (39 | 20.7%), Educational Services (31 | 16.5%), Agriculture, Fishing & Hunting (27 | 14.4%), Manufacturing (23 | 12.2%), and Retail Trade (21 | 11.2%).
Employment Industries by Sex in Yatesville
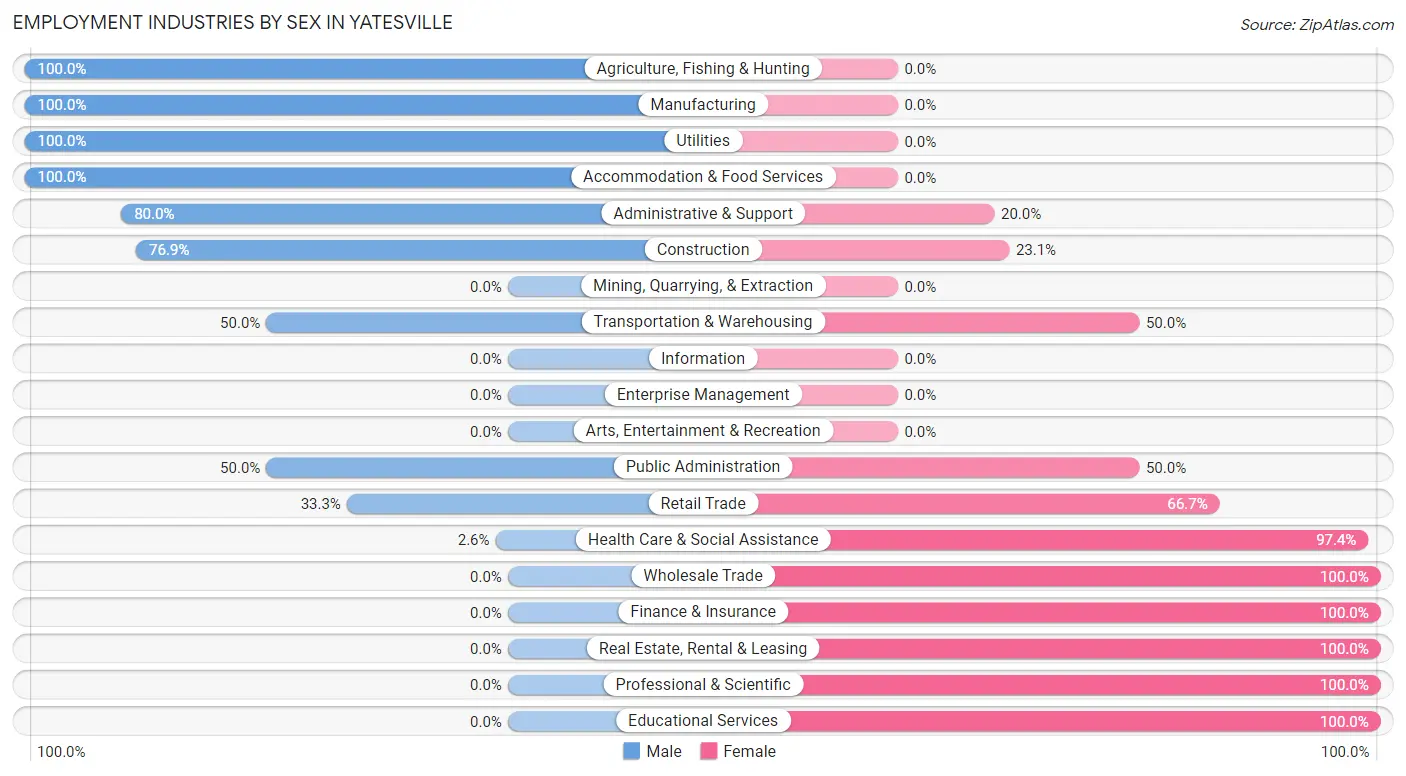
The Yatesville industries that see more men than women are Agriculture, Fishing & Hunting (100.0%), Manufacturing (100.0%), and Utilities (100.0%), whereas the industries that tend to have a higher number of women are Wholesale Trade (100.0%), Finance & Insurance (100.0%), and Real Estate, Rental & Leasing (100.0%).
| Industry | Male | Female |
| Agriculture, Fishing & Hunting | 27 (100.0%) | 0 (0.0%) |
| Mining, Quarrying, & Extraction | 0 (0.0%) | 0 (0.0%) |
| Construction | 10 (76.9%) | 3 (23.1%) |
| Manufacturing | 23 (100.0%) | 0 (0.0%) |
| Wholesale Trade | 0 (0.0%) | 3 (100.0%) |
| Retail Trade | 7 (33.3%) | 14 (66.7%) |
| Transportation & Warehousing | 1 (50.0%) | 1 (50.0%) |
| Utilities | 5 (100.0%) | 0 (0.0%) |
| Information | 0 (0.0%) | 0 (0.0%) |
| Finance & Insurance | 0 (0.0%) | 2 (100.0%) |
| Real Estate, Rental & Leasing | 0 (0.0%) | 1 (100.0%) |
| Professional & Scientific | 0 (0.0%) | 1 (100.0%) |
| Enterprise Management | 0 (0.0%) | 0 (0.0%) |
| Administrative & Support | 8 (80.0%) | 2 (20.0%) |
| Educational Services | 0 (0.0%) | 31 (100.0%) |
| Health Care & Social Assistance | 1 (2.6%) | 38 (97.4%) |
| Arts, Entertainment & Recreation | 0 (0.0%) | 0 (0.0%) |
| Accommodation & Food Services | 2 (100.0%) | 0 (0.0%) |
| Public Administration | 1 (50.0%) | 1 (50.0%) |
| Total | 89 (47.3%) | 99 (52.7%) |
Education in Yatesville
School Enrollment in Yatesville
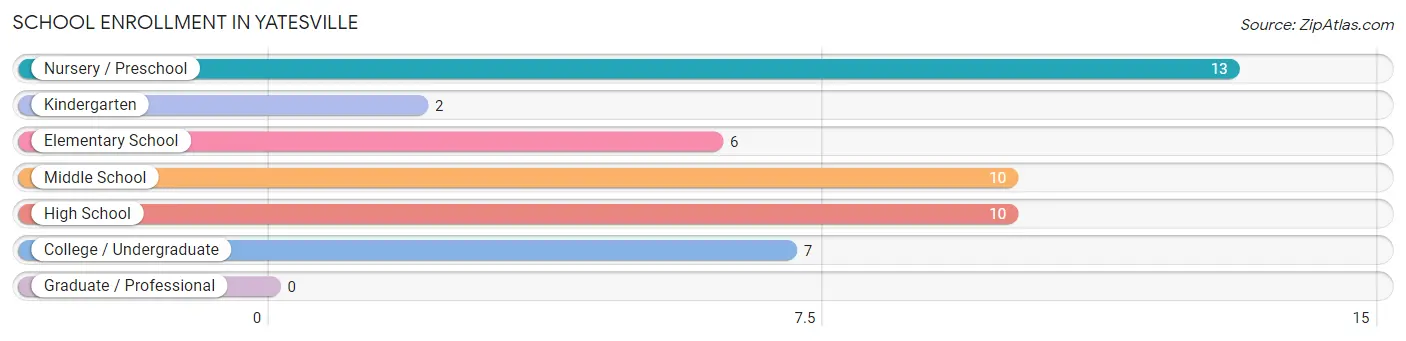
The most common levels of schooling among the 48 students in Yatesville are nursery / preschool (13 | 27.1%), middle school (10 | 20.8%), and high school (10 | 20.8%).
| School Level | # Students | % Students |
| Nursery / Preschool | 13 | 27.1% |
| Kindergarten | 2 | 4.2% |
| Elementary School | 6 | 12.5% |
| Middle School | 10 | 20.8% |
| High School | 10 | 20.8% |
| College / Undergraduate | 7 | 14.6% |
| Graduate / Professional | 0 | 0.0% |
| Total | 48 | 100.0% |
School Enrollment by Age by Funding Source in Yatesville
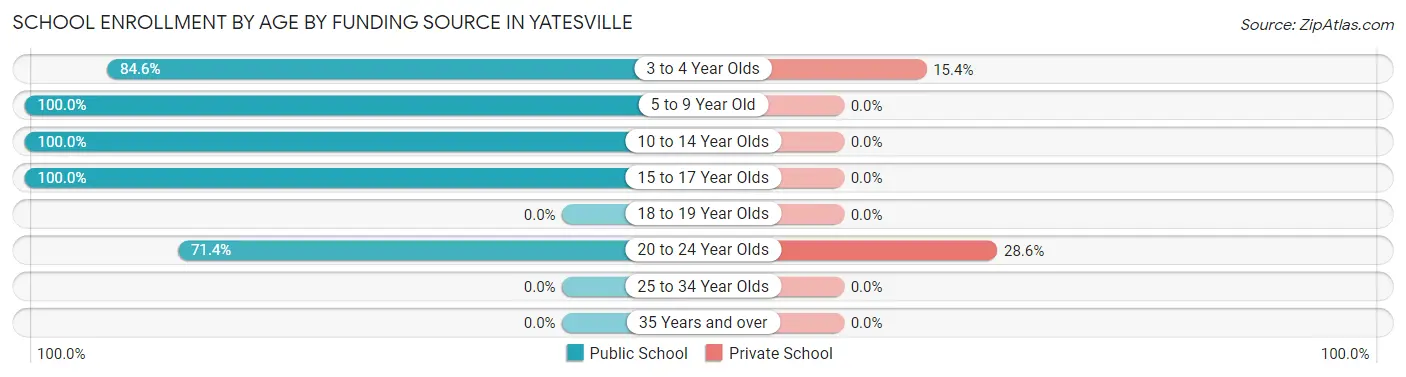
Out of a total of 48 students who are enrolled in schools in Yatesville, 4 (8.3%) attend a private institution, while the remaining 44 (91.7%) are enrolled in public schools. The age group of 20 to 24 year olds has the highest likelihood of being enrolled in private schools, with 2 (28.6% in the age bracket) enrolled. Conversely, the age group of 5 to 9 year old has the lowest likelihood of being enrolled in a private school, with 8 (100.0% in the age bracket) attending a public institution.
| Age Bracket | Public School | Private School |
| 3 to 4 Year Olds | 11 (84.6%) | 2 (15.4%) |
| 5 to 9 Year Old | 8 (100.0%) | 0 (0.0%) |
| 10 to 14 Year Olds | 10 (100.0%) | 0 (0.0%) |
| 15 to 17 Year Olds | 10 (100.0%) | 0 (0.0%) |
| 18 to 19 Year Olds | 0 (0.0%) | 0 (0.0%) |
| 20 to 24 Year Olds | 5 (71.4%) | 2 (28.6%) |
| 25 to 34 Year Olds | 0 (0.0%) | 0 (0.0%) |
| 35 Years and over | 0 (0.0%) | 0 (0.0%) |
| Total | 44 (91.7%) | 4 (8.3%) |
Educational Attainment by Field of Study in Yatesville
Engineering (12 | 35.3%), business (7 | 20.6%), education (6 | 17.6%), computers & mathematics (3 | 8.8%), and social sciences (3 | 8.8%) are the most common fields of study among 34 individuals in Yatesville who have obtained a bachelor's degree or higher.
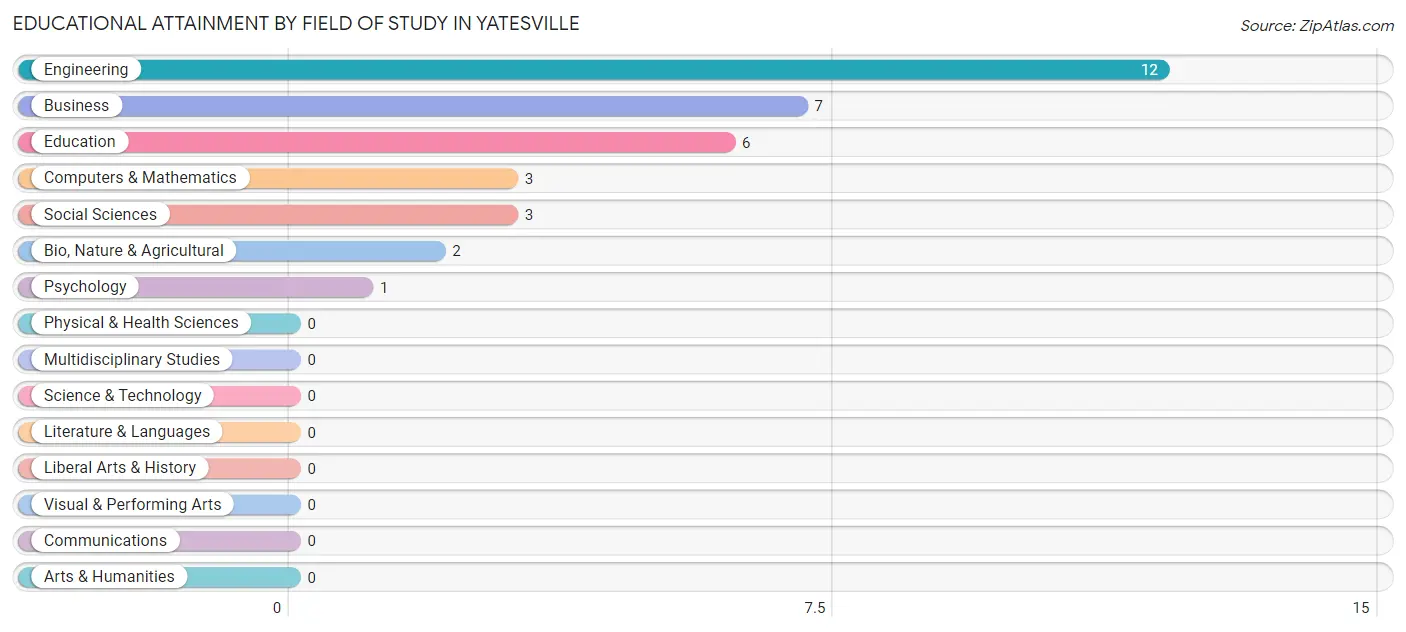
| Field of Study | # Graduates | % Graduates |
| Computers & Mathematics | 3 | 8.8% |
| Bio, Nature & Agricultural | 2 | 5.9% |
| Physical & Health Sciences | 0 | 0.0% |
| Psychology | 1 | 2.9% |
| Social Sciences | 3 | 8.8% |
| Engineering | 12 | 35.3% |
| Multidisciplinary Studies | 0 | 0.0% |
| Science & Technology | 0 | 0.0% |
| Business | 7 | 20.6% |
| Education | 6 | 17.6% |
| Literature & Languages | 0 | 0.0% |
| Liberal Arts & History | 0 | 0.0% |
| Visual & Performing Arts | 0 | 0.0% |
| Communications | 0 | 0.0% |
| Arts & Humanities | 0 | 0.0% |
| Total | 34 | 100.0% |
Transportation & Commute in Yatesville
Vehicle Availability by Sex in Yatesville
The most prevalent vehicle ownership categories in Yatesville are males with 3 vehicles (38, accounting for 42.7%) and females with 3 vehicles (51, making up 38.4%).
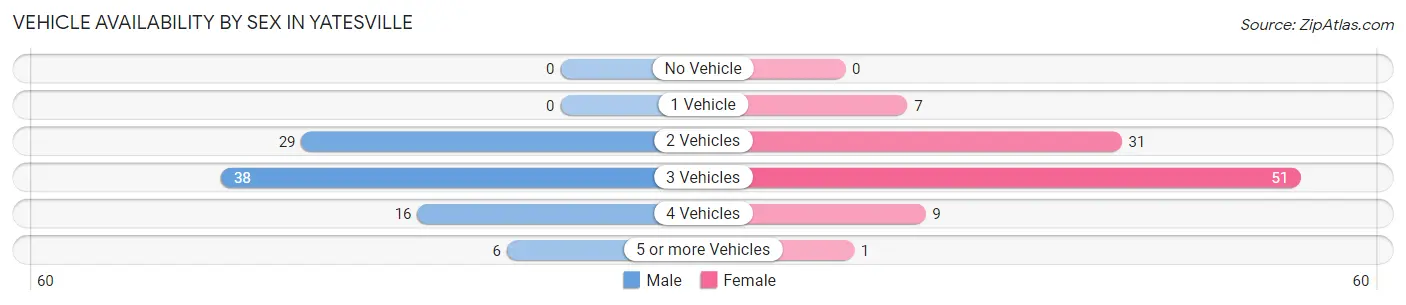
| Vehicles Available | Male | Female |
| No Vehicle | 0 (0.0%) | 0 (0.0%) |
| 1 Vehicle | 0 (0.0%) | 7 (7.1%) |
| 2 Vehicles | 29 (32.6%) | 31 (31.3%) |
| 3 Vehicles | 38 (42.7%) | 51 (51.5%) |
| 4 Vehicles | 16 (18.0%) | 9 (9.1%) |
| 5 or more Vehicles | 6 (6.7%) | 1 (1.0%) |
| Total | 89 (100.0%) | 99 (100.0%) |
Commute Time in Yatesville
The most frequently occuring commute durations in Yatesville are 15 to 19 minutes (65 commuters, 35.9%), 20 to 24 minutes (31 commuters, 17.1%), and 30 to 34 minutes (24 commuters, 13.3%).
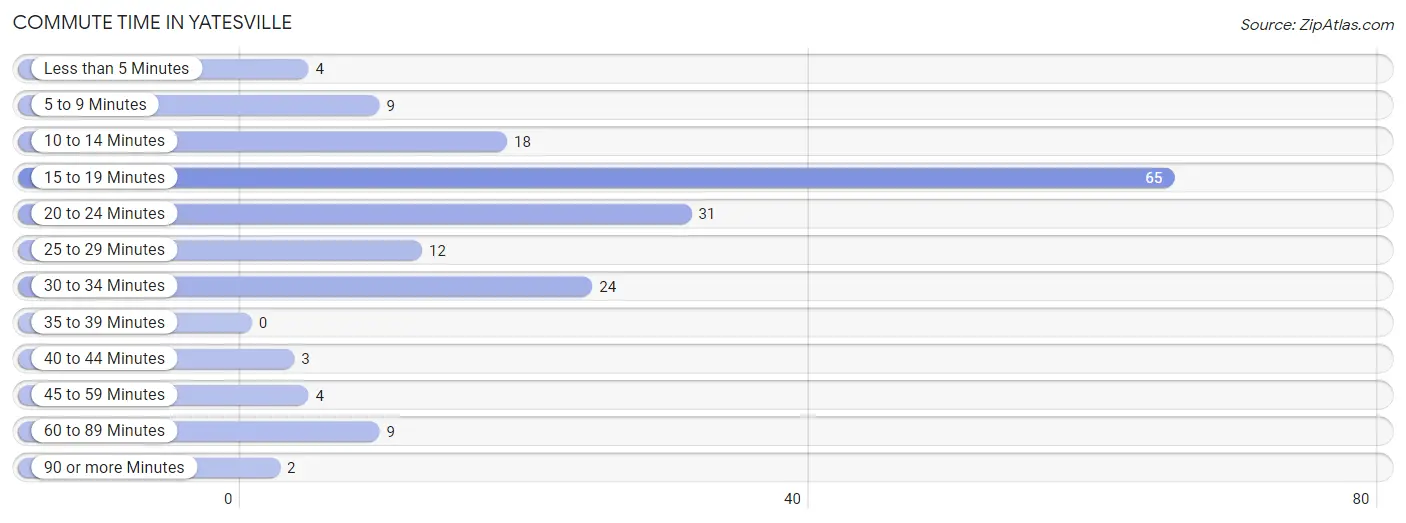
| Commute Time | # Commuters | % Commuters |
| Less than 5 Minutes | 4 | 2.2% |
| 5 to 9 Minutes | 9 | 5.0% |
| 10 to 14 Minutes | 18 | 9.9% |
| 15 to 19 Minutes | 65 | 35.9% |
| 20 to 24 Minutes | 31 | 17.1% |
| 25 to 29 Minutes | 12 | 6.6% |
| 30 to 34 Minutes | 24 | 13.3% |
| 35 to 39 Minutes | 0 | 0.0% |
| 40 to 44 Minutes | 3 | 1.7% |
| 45 to 59 Minutes | 4 | 2.2% |
| 60 to 89 Minutes | 9 | 5.0% |
| 90 or more Minutes | 2 | 1.1% |
Commute Time by Sex in Yatesville
The most common commute times in Yatesville are 15 to 19 minutes (37 commuters, 42.5%) for males and 15 to 19 minutes (28 commuters, 29.8%) for females.
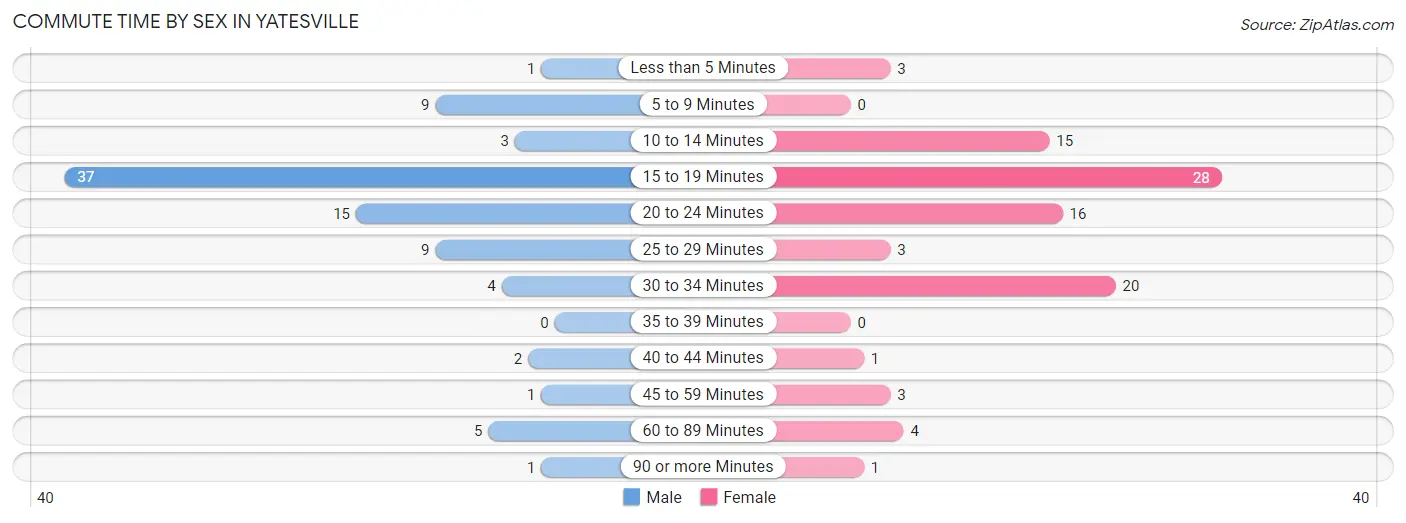
| Commute Time | Male | Female |
| Less than 5 Minutes | 1 (1.1%) | 3 (3.2%) |
| 5 to 9 Minutes | 9 (10.3%) | 0 (0.0%) |
| 10 to 14 Minutes | 3 (3.5%) | 15 (16.0%) |
| 15 to 19 Minutes | 37 (42.5%) | 28 (29.8%) |
| 20 to 24 Minutes | 15 (17.2%) | 16 (17.0%) |
| 25 to 29 Minutes | 9 (10.3%) | 3 (3.2%) |
| 30 to 34 Minutes | 4 (4.6%) | 20 (21.3%) |
| 35 to 39 Minutes | 0 (0.0%) | 0 (0.0%) |
| 40 to 44 Minutes | 2 (2.3%) | 1 (1.1%) |
| 45 to 59 Minutes | 1 (1.1%) | 3 (3.2%) |
| 60 to 89 Minutes | 5 (5.8%) | 4 (4.3%) |
| 90 or more Minutes | 1 (1.1%) | 1 (1.1%) |
Time of Departure to Work by Sex in Yatesville
The most frequent times of departure to work in Yatesville are 7:30 AM to 7:59 AM (24, 27.6%) for males and 7:00 AM to 7:29 AM (26, 27.7%) for females.
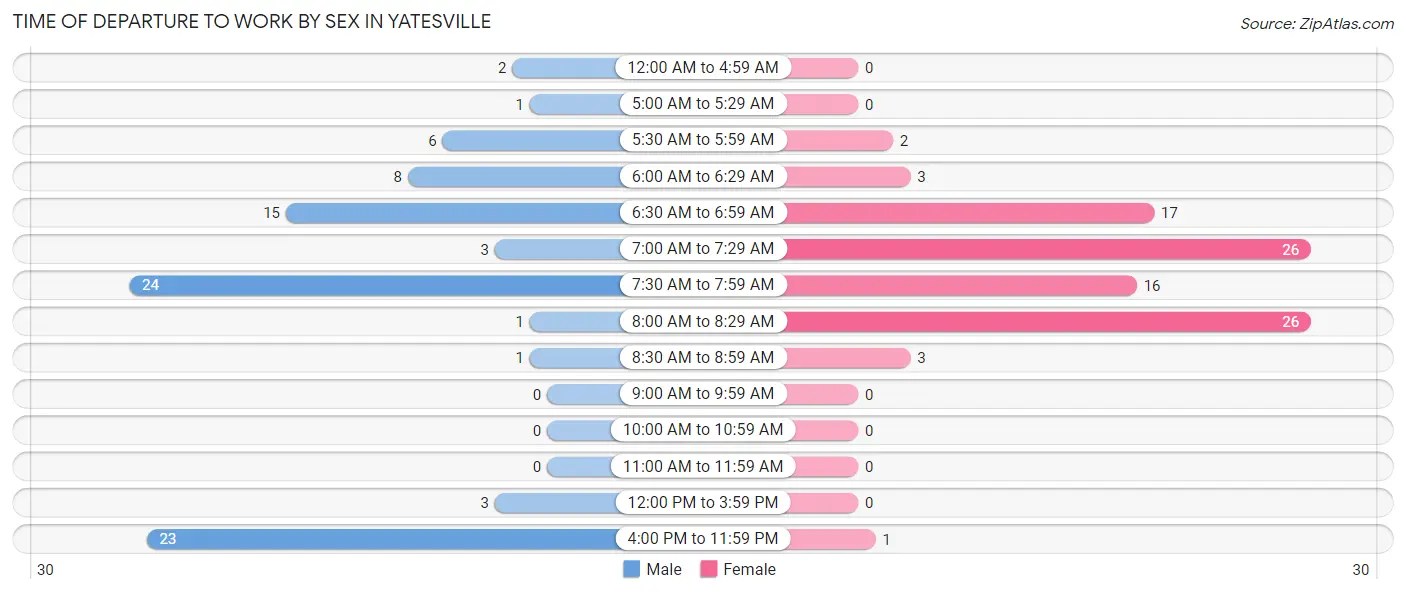
| Time of Departure | Male | Female |
| 12:00 AM to 4:59 AM | 2 (2.3%) | 0 (0.0%) |
| 5:00 AM to 5:29 AM | 1 (1.1%) | 0 (0.0%) |
| 5:30 AM to 5:59 AM | 6 (6.9%) | 2 (2.1%) |
| 6:00 AM to 6:29 AM | 8 (9.2%) | 3 (3.2%) |
| 6:30 AM to 6:59 AM | 15 (17.2%) | 17 (18.1%) |
| 7:00 AM to 7:29 AM | 3 (3.5%) | 26 (27.7%) |
| 7:30 AM to 7:59 AM | 24 (27.6%) | 16 (17.0%) |
| 8:00 AM to 8:29 AM | 1 (1.1%) | 26 (27.7%) |
| 8:30 AM to 8:59 AM | 1 (1.1%) | 3 (3.2%) |
| 9:00 AM to 9:59 AM | 0 (0.0%) | 0 (0.0%) |
| 10:00 AM to 10:59 AM | 0 (0.0%) | 0 (0.0%) |
| 11:00 AM to 11:59 AM | 0 (0.0%) | 0 (0.0%) |
| 12:00 PM to 3:59 PM | 3 (3.5%) | 0 (0.0%) |
| 4:00 PM to 11:59 PM | 23 (26.4%) | 1 (1.1%) |
| Total | 87 (100.0%) | 94 (100.0%) |
Housing Occupancy in Yatesville
Occupancy by Ownership in Yatesville
Of the total 161 dwellings in Yatesville, owner-occupied units account for 132 (82.0%), while renter-occupied units make up 29 (18.0%).
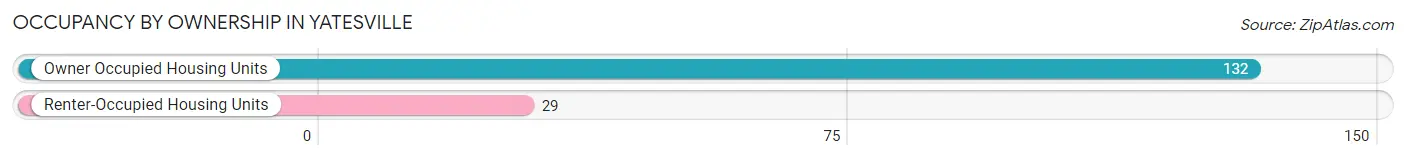
| Occupancy | # Housing Units | % Housing Units |
| Owner Occupied Housing Units | 132 | 82.0% |
| Renter-Occupied Housing Units | 29 | 18.0% |
| Total Occupied Housing Units | 161 | 100.0% |
Occupancy by Household Size in Yatesville
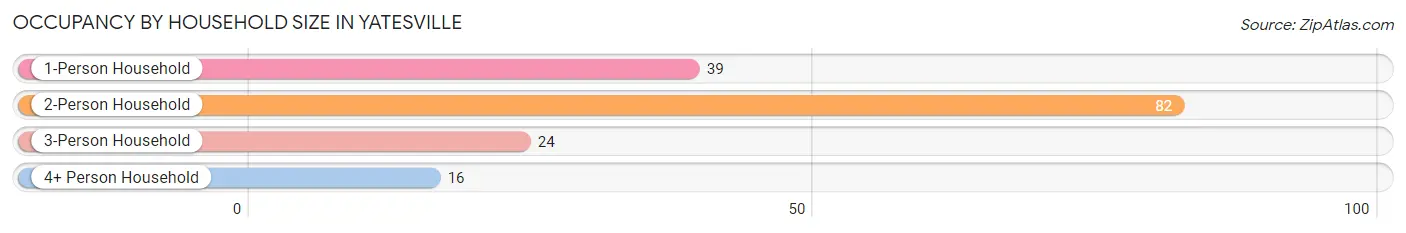
| Household Size | # Housing Units | % Housing Units |
| 1-Person Household | 39 | 24.2% |
| 2-Person Household | 82 | 50.9% |
| 3-Person Household | 24 | 14.9% |
| 4+ Person Household | 16 | 9.9% |
| Total Housing Units | 161 | 100.0% |
Occupancy by Ownership by Household Size in Yatesville
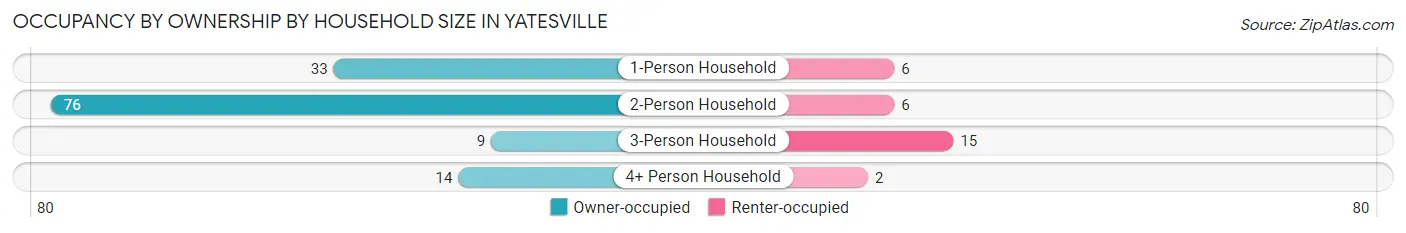
| Household Size | Owner-occupied | Renter-occupied |
| 1-Person Household | 33 (84.6%) | 6 (15.4%) |
| 2-Person Household | 76 (92.7%) | 6 (7.3%) |
| 3-Person Household | 9 (37.5%) | 15 (62.5%) |
| 4+ Person Household | 14 (87.5%) | 2 (12.5%) |
| Total Housing Units | 132 (82.0%) | 29 (18.0%) |
Occupancy by Educational Attainment in Yatesville
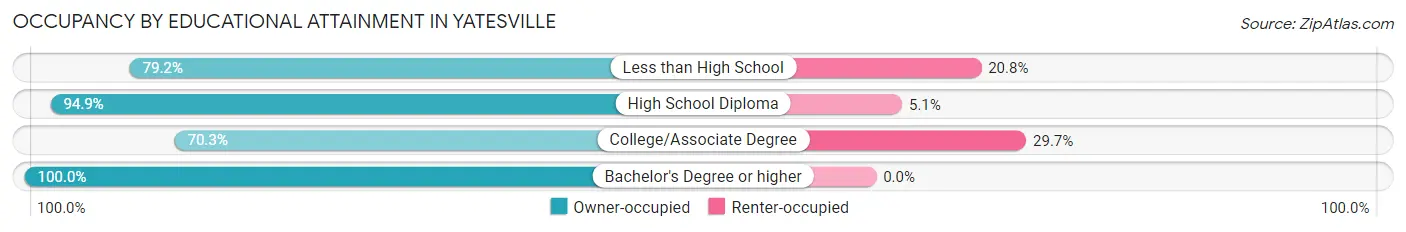
| Household Size | Owner-occupied | Renter-occupied |
| Less than High School | 19 (79.2%) | 5 (20.8%) |
| High School Diploma | 37 (94.9%) | 2 (5.1%) |
| College/Associate Degree | 52 (70.3%) | 22 (29.7%) |
| Bachelor's Degree or higher | 24 (100.0%) | 0 (0.0%) |
Occupancy by Age of Householder in Yatesville
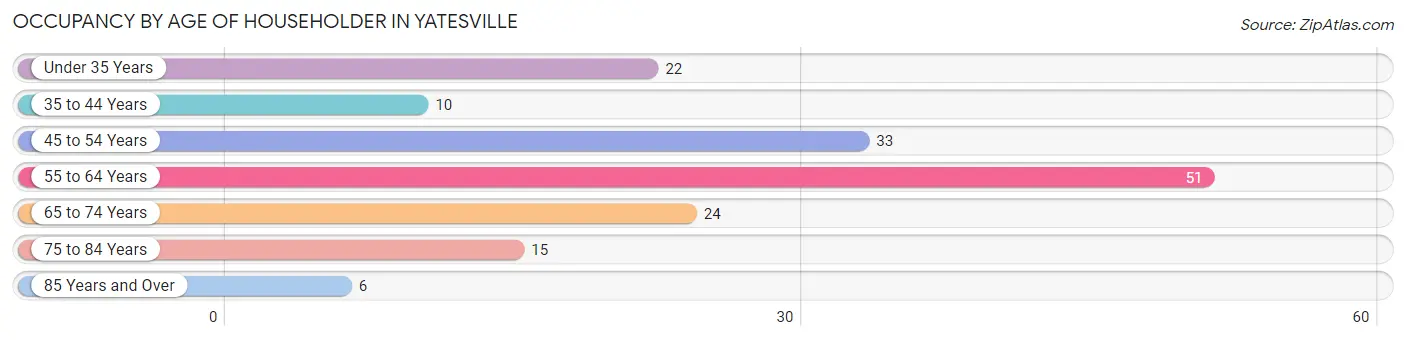
| Age Bracket | # Households | % Households |
| Under 35 Years | 22 | 13.7% |
| 35 to 44 Years | 10 | 6.2% |
| 45 to 54 Years | 33 | 20.5% |
| 55 to 64 Years | 51 | 31.7% |
| 65 to 74 Years | 24 | 14.9% |
| 75 to 84 Years | 15 | 9.3% |
| 85 Years and Over | 6 | 3.7% |
| Total | 161 | 100.0% |
Housing Finances in Yatesville
Median Income by Occupancy in Yatesville
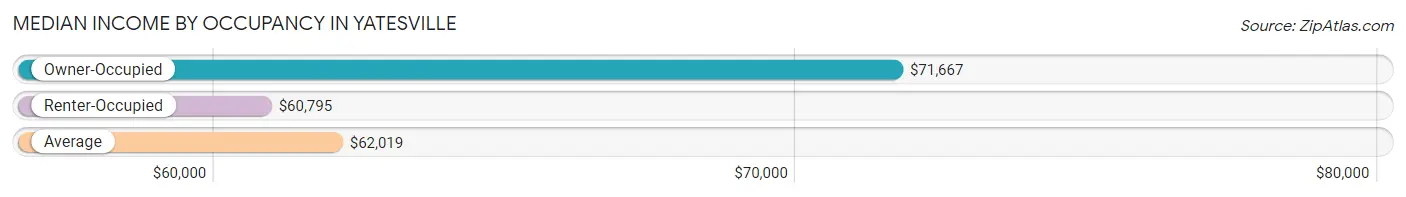
| Occupancy Type | # Households | Median Income |
| Owner-Occupied | 132 (82.0%) | $71,667 |
| Renter-Occupied | 29 (18.0%) | $60,795 |
| Average | 161 (100.0%) | $62,019 |
Occupancy by Householder Income Bracket in Yatesville
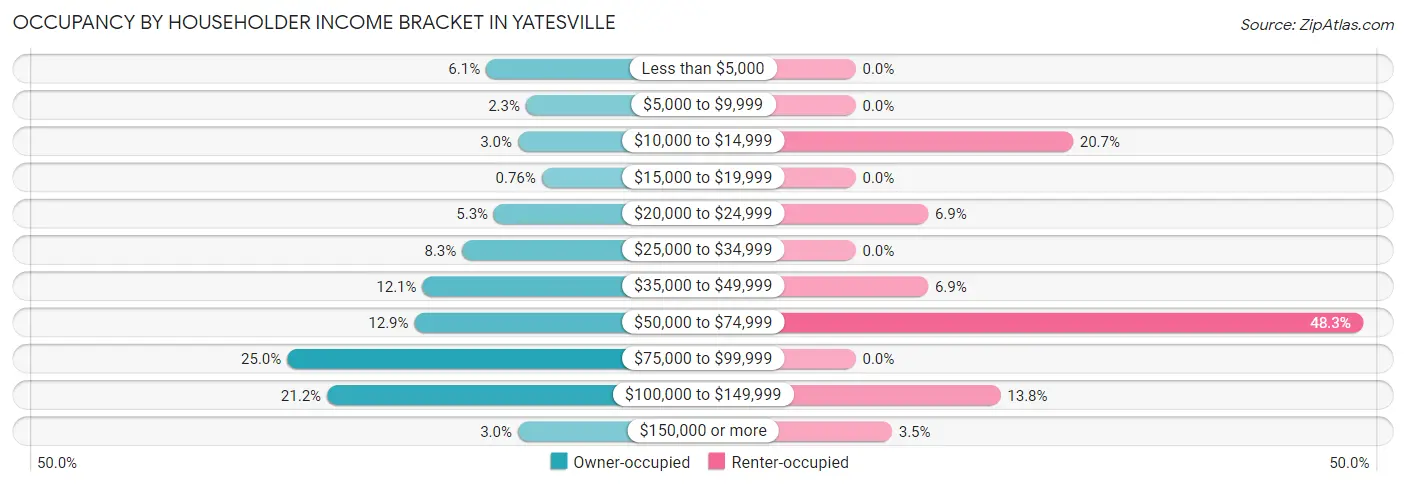
| Income Bracket | Owner-occupied | Renter-occupied |
| Less than $5,000 | 8 (6.1%) | 0 (0.0%) |
| $5,000 to $9,999 | 3 (2.3%) | 0 (0.0%) |
| $10,000 to $14,999 | 4 (3.0%) | 6 (20.7%) |
| $15,000 to $19,999 | 1 (0.8%) | 0 (0.0%) |
| $20,000 to $24,999 | 7 (5.3%) | 2 (6.9%) |
| $25,000 to $34,999 | 11 (8.3%) | 0 (0.0%) |
| $35,000 to $49,999 | 16 (12.1%) | 2 (6.9%) |
| $50,000 to $74,999 | 17 (12.9%) | 14 (48.3%) |
| $75,000 to $99,999 | 33 (25.0%) | 0 (0.0%) |
| $100,000 to $149,999 | 28 (21.2%) | 4 (13.8%) |
| $150,000 or more | 4 (3.0%) | 1 (3.5%) |
| Total | 132 (100.0%) | 29 (100.0%) |
Monthly Housing Cost Tiers in Yatesville
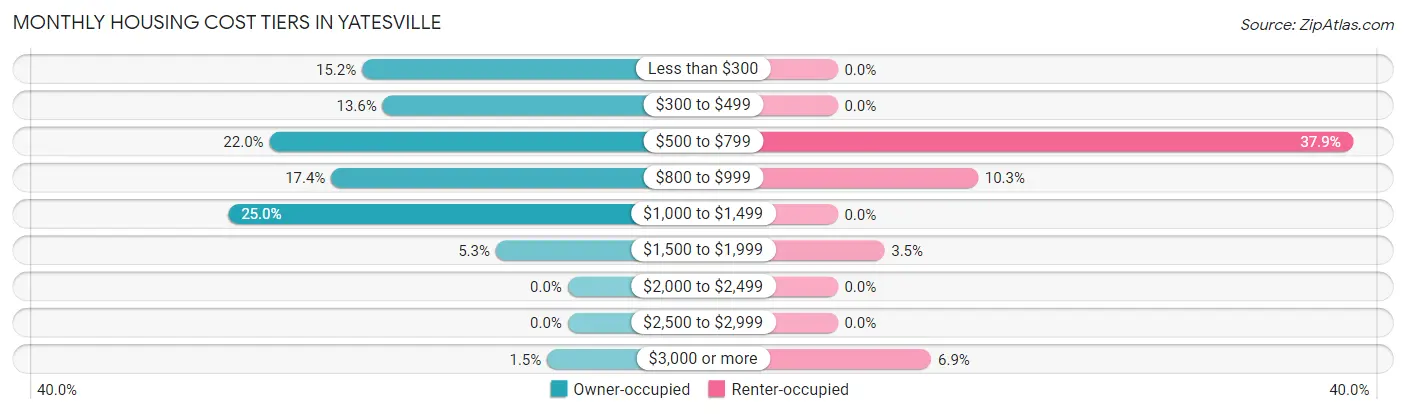
| Monthly Cost | Owner-occupied | Renter-occupied |
| Less than $300 | 20 (15.1%) | 0 (0.0%) |
| $300 to $499 | 18 (13.6%) | 0 (0.0%) |
| $500 to $799 | 29 (22.0%) | 11 (37.9%) |
| $800 to $999 | 23 (17.4%) | 3 (10.3%) |
| $1,000 to $1,499 | 33 (25.0%) | 0 (0.0%) |
| $1,500 to $1,999 | 7 (5.3%) | 1 (3.5%) |
| $2,000 to $2,499 | 0 (0.0%) | 0 (0.0%) |
| $2,500 to $2,999 | 0 (0.0%) | 0 (0.0%) |
| $3,000 or more | 2 (1.5%) | 2 (6.9%) |
| Total | 132 (100.0%) | 29 (100.0%) |
Physical Housing Characteristics in Yatesville
Housing Structures in Yatesville
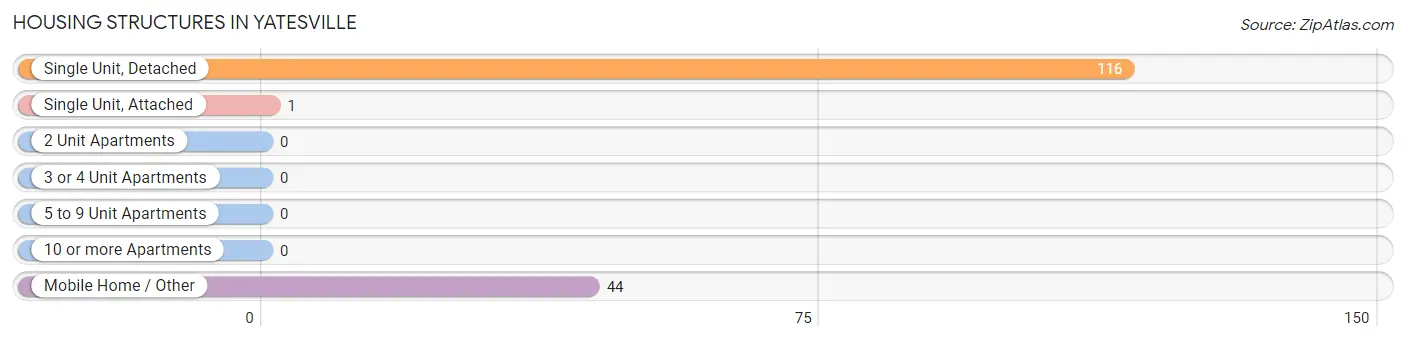
| Structure Type | # Housing Units | % Housing Units |
| Single Unit, Detached | 116 | 72.1% |
| Single Unit, Attached | 1 | 0.6% |
| 2 Unit Apartments | 0 | 0.0% |
| 3 or 4 Unit Apartments | 0 | 0.0% |
| 5 to 9 Unit Apartments | 0 | 0.0% |
| 10 or more Apartments | 0 | 0.0% |
| Mobile Home / Other | 44 | 27.3% |
| Total | 161 | 100.0% |
Housing Structures by Occupancy in Yatesville
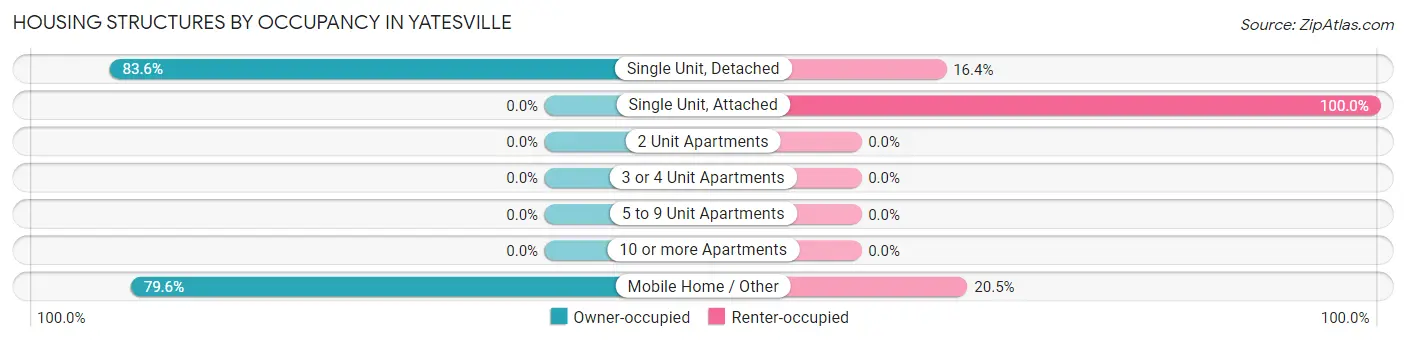
| Structure Type | Owner-occupied | Renter-occupied |
| Single Unit, Detached | 97 (83.6%) | 19 (16.4%) |
| Single Unit, Attached | 0 (0.0%) | 1 (100.0%) |
| 2 Unit Apartments | 0 (0.0%) | 0 (0.0%) |
| 3 or 4 Unit Apartments | 0 (0.0%) | 0 (0.0%) |
| 5 to 9 Unit Apartments | 0 (0.0%) | 0 (0.0%) |
| 10 or more Apartments | 0 (0.0%) | 0 (0.0%) |
| Mobile Home / Other | 35 (79.5%) | 9 (20.4%) |
| Total | 132 (82.0%) | 29 (18.0%) |
Housing Structures by Number of Rooms in Yatesville
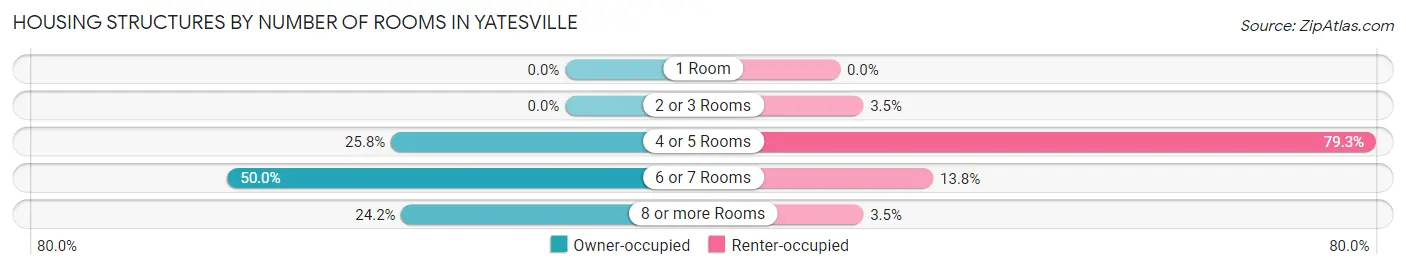
| Number of Rooms | Owner-occupied | Renter-occupied |
| 1 Room | 0 (0.0%) | 0 (0.0%) |
| 2 or 3 Rooms | 0 (0.0%) | 1 (3.5%) |
| 4 or 5 Rooms | 34 (25.8%) | 23 (79.3%) |
| 6 or 7 Rooms | 66 (50.0%) | 4 (13.8%) |
| 8 or more Rooms | 32 (24.2%) | 1 (3.5%) |
| Total | 132 (100.0%) | 29 (100.0%) |
Housing Structure by Heating Type in Yatesville
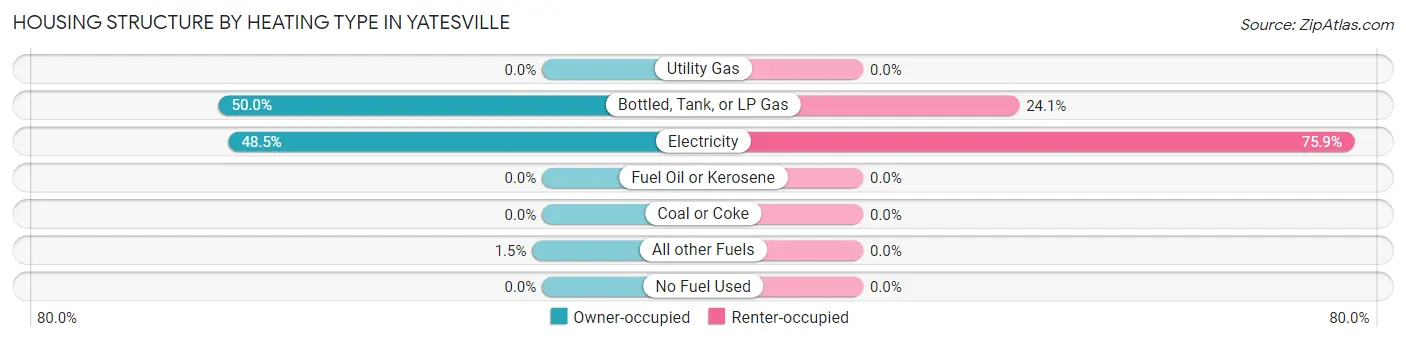
| Heating Type | Owner-occupied | Renter-occupied |
| Utility Gas | 0 (0.0%) | 0 (0.0%) |
| Bottled, Tank, or LP Gas | 66 (50.0%) | 7 (24.1%) |
| Electricity | 64 (48.5%) | 22 (75.9%) |
| Fuel Oil or Kerosene | 0 (0.0%) | 0 (0.0%) |
| Coal or Coke | 0 (0.0%) | 0 (0.0%) |
| All other Fuels | 2 (1.5%) | 0 (0.0%) |
| No Fuel Used | 0 (0.0%) | 0 (0.0%) |
| Total | 132 (100.0%) | 29 (100.0%) |
Household Vehicle Usage in Yatesville
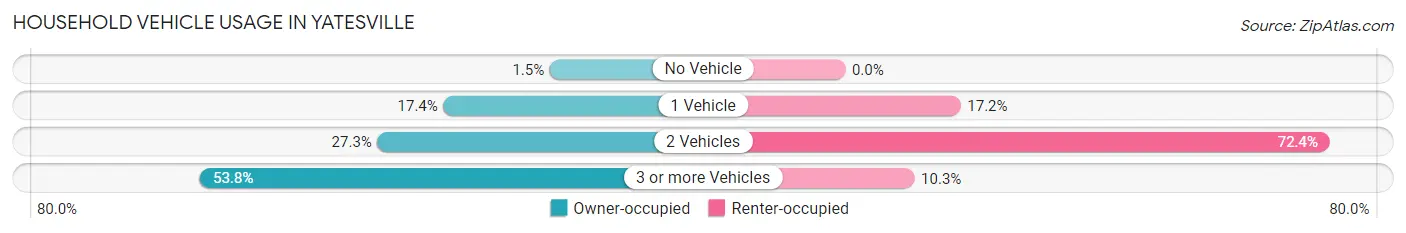
| Vehicles per Household | Owner-occupied | Renter-occupied |
| No Vehicle | 2 (1.5%) | 0 (0.0%) |
| 1 Vehicle | 23 (17.4%) | 5 (17.2%) |
| 2 Vehicles | 36 (27.3%) | 21 (72.4%) |
| 3 or more Vehicles | 71 (53.8%) | 3 (10.3%) |
| Total | 132 (100.0%) | 29 (100.0%) |
Real Estate & Mortgages in Yatesville
Real Estate and Mortgage Overview in Yatesville
| Characteristic | Without Mortgage | With Mortgage |
| Housing Units | 89 | 43 |
| Median Property Value | $150,500 | $112,500 |
| Median Household Income | $55,417 | $1 |
| Monthly Housing Costs | $541 | $0 |
| Real Estate Taxes | $1,133 | $0 |
Property Value by Mortgage Status in Yatesville
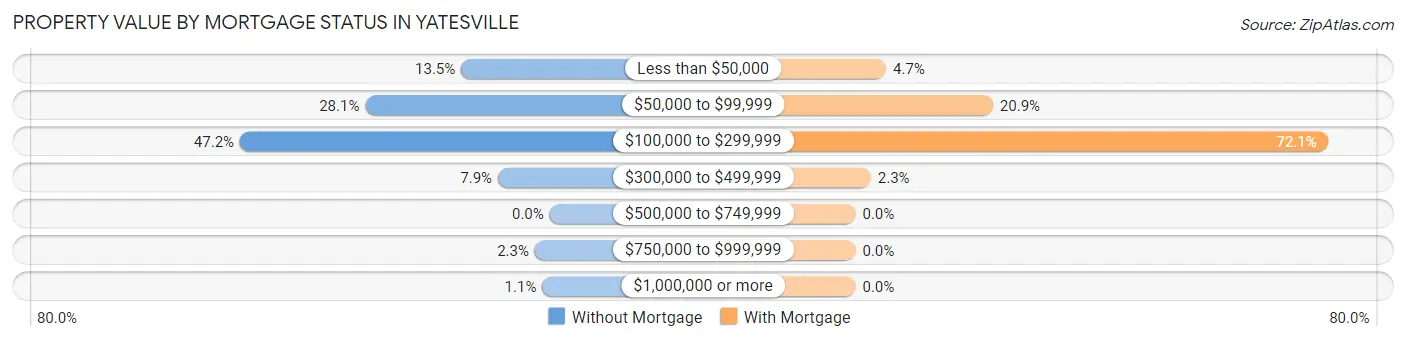
| Property Value | Without Mortgage | With Mortgage |
| Less than $50,000 | 12 (13.5%) | 2 (4.6%) |
| $50,000 to $99,999 | 25 (28.1%) | 9 (20.9%) |
| $100,000 to $299,999 | 42 (47.2%) | 31 (72.1%) |
| $300,000 to $499,999 | 7 (7.9%) | 1 (2.3%) |
| $500,000 to $749,999 | 0 (0.0%) | 0 (0.0%) |
| $750,000 to $999,999 | 2 (2.2%) | 0 (0.0%) |
| $1,000,000 or more | 1 (1.1%) | 0 (0.0%) |
| Total | 89 (100.0%) | 43 (100.0%) |
Household Income by Mortgage Status in Yatesville
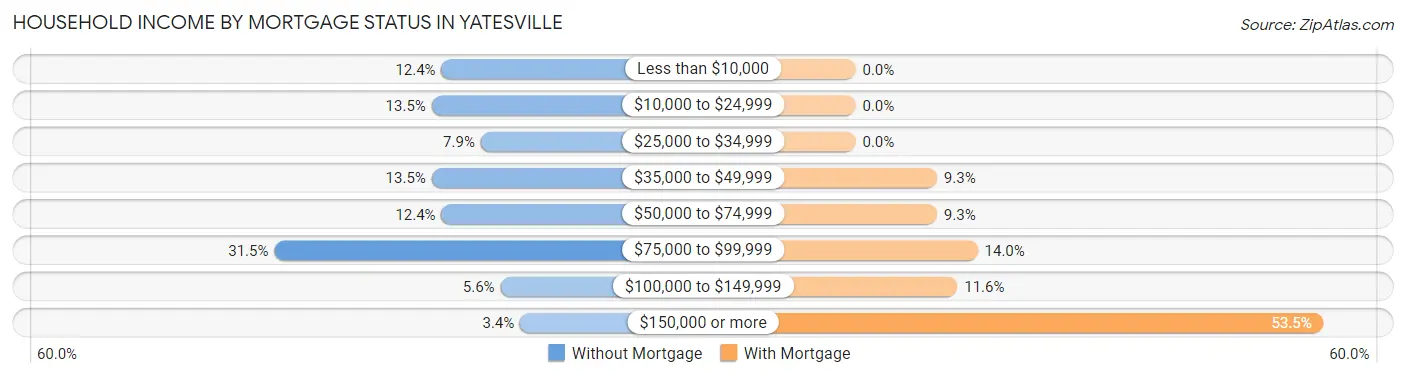
| Household Income | Without Mortgage | With Mortgage |
| Less than $10,000 | 11 (12.4%) | 0 (0.0%) |
| $10,000 to $24,999 | 12 (13.5%) | 0 (0.0%) |
| $25,000 to $34,999 | 7 (7.9%) | 0 (0.0%) |
| $35,000 to $49,999 | 12 (13.5%) | 4 (9.3%) |
| $50,000 to $74,999 | 11 (12.4%) | 4 (9.3%) |
| $75,000 to $99,999 | 28 (31.5%) | 6 (14.0%) |
| $100,000 to $149,999 | 5 (5.6%) | 5 (11.6%) |
| $150,000 or more | 3 (3.4%) | 23 (53.5%) |
| Total | 89 (100.0%) | 43 (100.0%) |
Property Value to Household Income Ratio in Yatesville
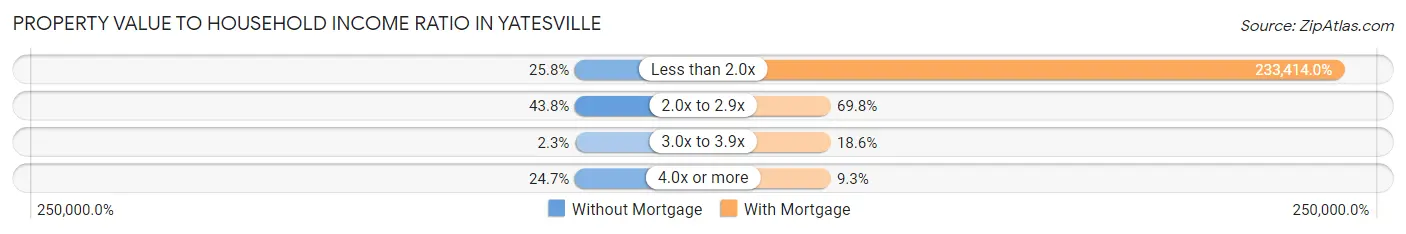
| Value-to-Income Ratio | Without Mortgage | With Mortgage |
| Less than 2.0x | 23 (25.8%) | 100,368 (233,414.0%) |
| 2.0x to 2.9x | 39 (43.8%) | 30 (69.8%) |
| 3.0x to 3.9x | 2 (2.2%) | 8 (18.6%) |
| 4.0x or more | 22 (24.7%) | 4 (9.3%) |
| Total | 89 (100.0%) | 43 (100.0%) |
Real Estate Taxes by Mortgage Status in Yatesville
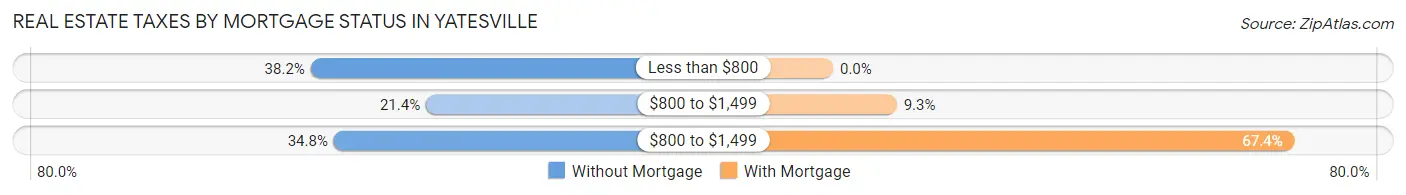
| Property Taxes | Without Mortgage | With Mortgage |
| Less than $800 | 34 (38.2%) | 0 (0.0%) |
| $800 to $1,499 | 19 (21.3%) | 4 (9.3%) |
| $800 to $1,499 | 31 (34.8%) | 29 (67.4%) |
| Total | 89 (100.0%) | 43 (100.0%) |
Health & Disability in Yatesville
Health Insurance Coverage by Age in Yatesville
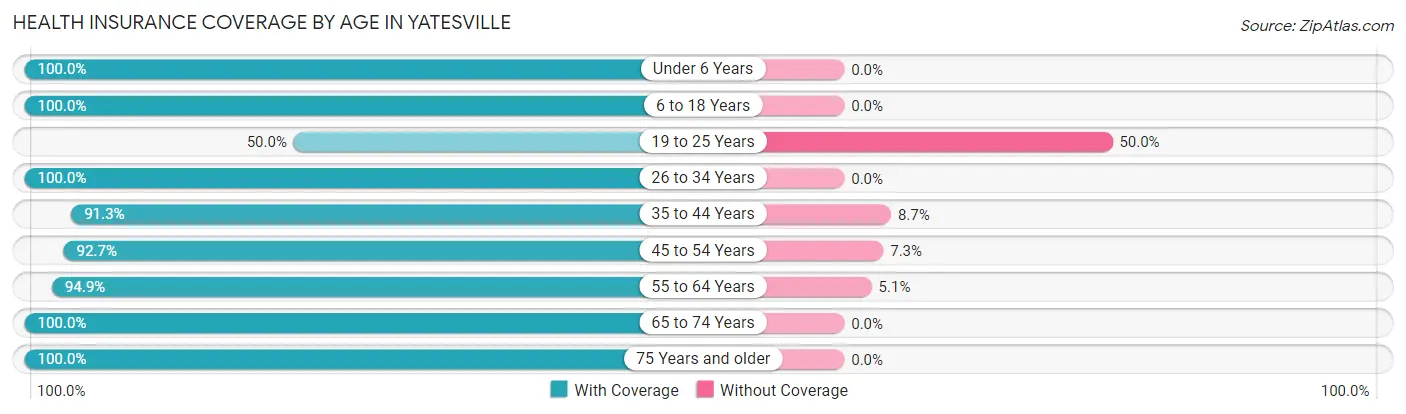
| Age Bracket | With Coverage | Without Coverage |
| Under 6 Years | 22 (100.0%) | 0 (0.0%) |
| 6 to 18 Years | 30 (100.0%) | 0 (0.0%) |
| 19 to 25 Years | 12 (50.0%) | 12 (50.0%) |
| 26 to 34 Years | 35 (100.0%) | 0 (0.0%) |
| 35 to 44 Years | 21 (91.3%) | 2 (8.7%) |
| 45 to 54 Years | 51 (92.7%) | 4 (7.3%) |
| 55 to 64 Years | 93 (94.9%) | 5 (5.1%) |
| 65 to 74 Years | 41 (100.0%) | 0 (0.0%) |
| 75 Years and older | 30 (100.0%) | 0 (0.0%) |
| Total | 335 (93.6%) | 23 (6.4%) |
Health Insurance Coverage by Citizenship Status in Yatesville
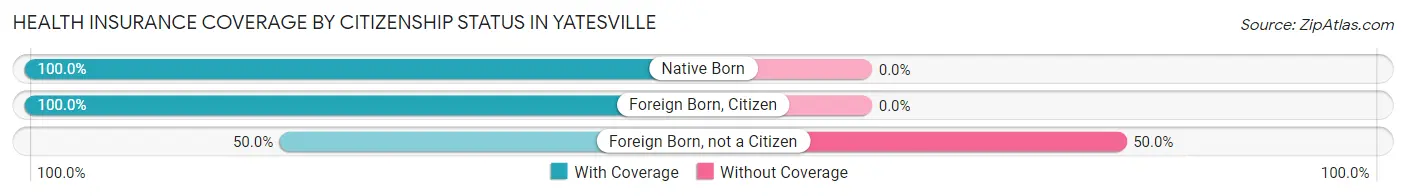
| Citizenship Status | With Coverage | Without Coverage |
| Native Born | 22 (100.0%) | 0 (0.0%) |
| Foreign Born, Citizen | 30 (100.0%) | 0 (0.0%) |
| Foreign Born, not a Citizen | 12 (50.0%) | 12 (50.0%) |
Health Insurance Coverage by Household Income in Yatesville
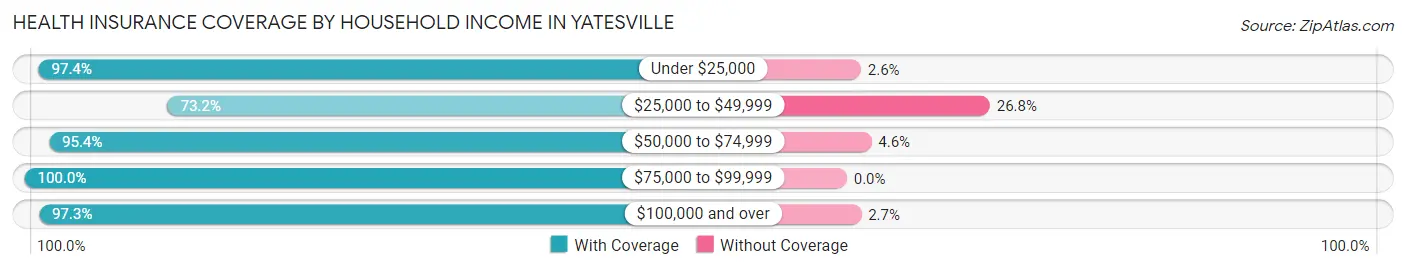
| Household Income | With Coverage | Without Coverage |
| Under $25,000 | 37 (97.4%) | 1 (2.6%) |
| $25,000 to $49,999 | 41 (73.2%) | 15 (26.8%) |
| $50,000 to $74,999 | 83 (95.4%) | 4 (4.6%) |
| $75,000 to $99,999 | 66 (100.0%) | 0 (0.0%) |
| $100,000 and over | 108 (97.3%) | 3 (2.7%) |
Public vs Private Health Insurance Coverage by Age in Yatesville
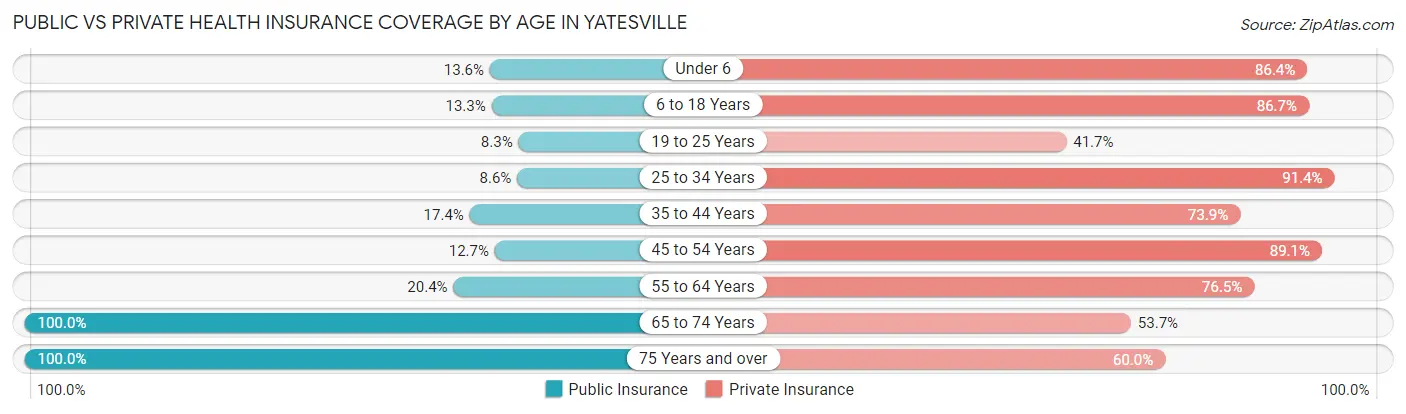
| Age Bracket | Public Insurance | Private Insurance |
| Under 6 | 3 (13.6%) | 19 (86.4%) |
| 6 to 18 Years | 4 (13.3%) | 26 (86.7%) |
| 19 to 25 Years | 2 (8.3%) | 10 (41.7%) |
| 25 to 34 Years | 3 (8.6%) | 32 (91.4%) |
| 35 to 44 Years | 4 (17.4%) | 17 (73.9%) |
| 45 to 54 Years | 7 (12.7%) | 49 (89.1%) |
| 55 to 64 Years | 20 (20.4%) | 75 (76.5%) |
| 65 to 74 Years | 41 (100.0%) | 22 (53.7%) |
| 75 Years and over | 30 (100.0%) | 18 (60.0%) |
| Total | 114 (31.8%) | 268 (74.9%) |
Disability Status by Sex by Age in Yatesville
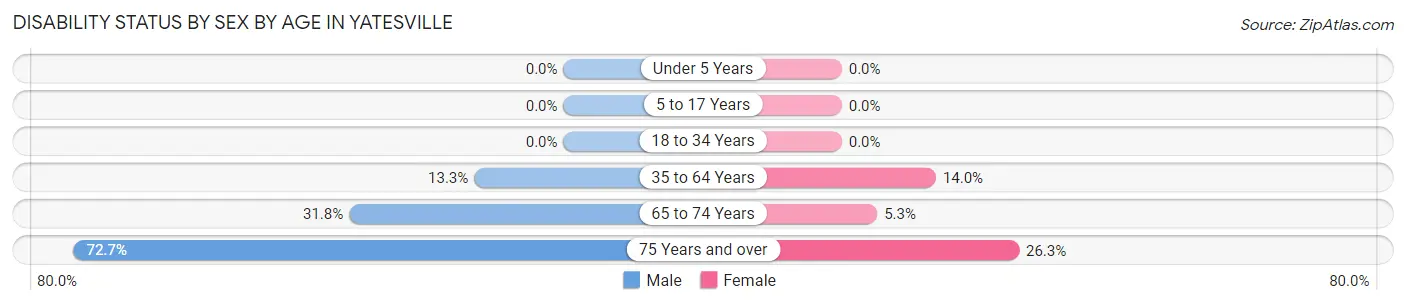
| Age Bracket | Male | Female |
| Under 5 Years | 0 (0.0%) | 0 (0.0%) |
| 5 to 17 Years | 0 (0.0%) | 0 (0.0%) |
| 18 to 34 Years | 0 (0.0%) | 0 (0.0%) |
| 35 to 64 Years | 11 (13.3%) | 13 (14.0%) |
| 65 to 74 Years | 7 (31.8%) | 1 (5.3%) |
| 75 Years and over | 8 (72.7%) | 5 (26.3%) |
Disability Class by Sex by Age in Yatesville
Disability Class: Hearing Difficulty
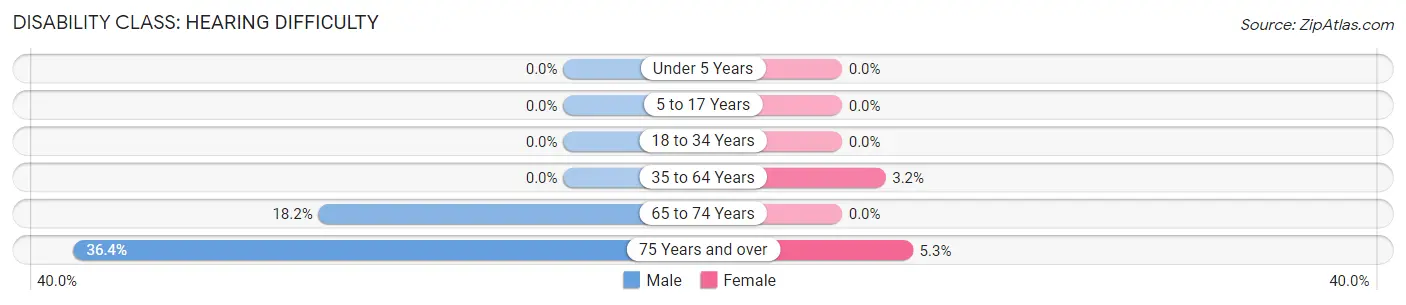
| Age Bracket | Male | Female |
| Under 5 Years | 0 (0.0%) | 0 (0.0%) |
| 5 to 17 Years | 0 (0.0%) | 0 (0.0%) |
| 18 to 34 Years | 0 (0.0%) | 0 (0.0%) |
| 35 to 64 Years | 0 (0.0%) | 3 (3.2%) |
| 65 to 74 Years | 4 (18.2%) | 0 (0.0%) |
| 75 Years and over | 4 (36.4%) | 1 (5.3%) |
Disability Class: Vision Difficulty
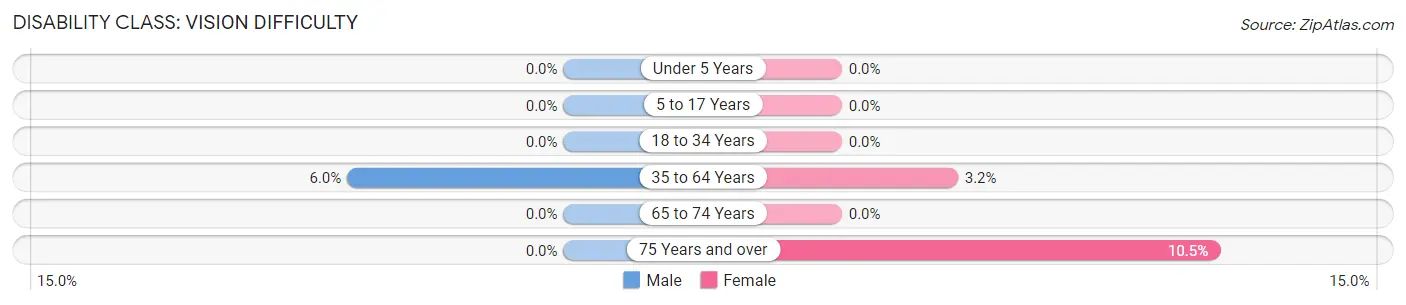
| Age Bracket | Male | Female |
| Under 5 Years | 0 (0.0%) | 0 (0.0%) |
| 5 to 17 Years | 0 (0.0%) | 0 (0.0%) |
| 18 to 34 Years | 0 (0.0%) | 0 (0.0%) |
| 35 to 64 Years | 5 (6.0%) | 3 (3.2%) |
| 65 to 74 Years | 0 (0.0%) | 0 (0.0%) |
| 75 Years and over | 0 (0.0%) | 2 (10.5%) |
Disability Class: Cognitive Difficulty
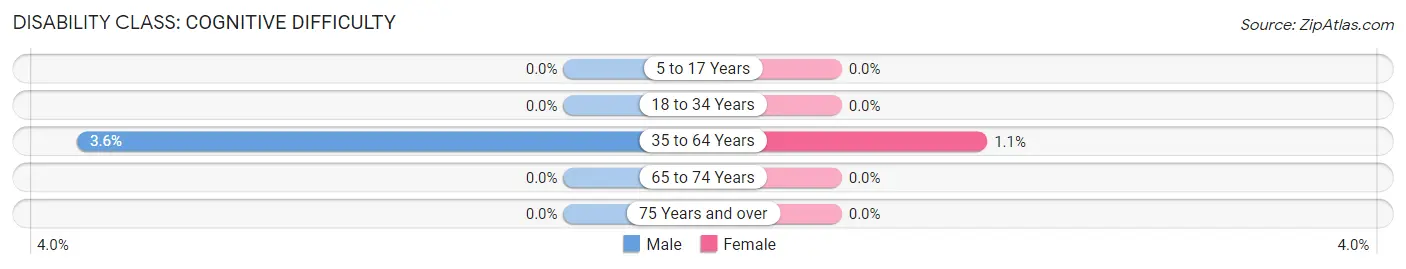
| Age Bracket | Male | Female |
| 5 to 17 Years | 0 (0.0%) | 0 (0.0%) |
| 18 to 34 Years | 0 (0.0%) | 0 (0.0%) |
| 35 to 64 Years | 3 (3.6%) | 1 (1.1%) |
| 65 to 74 Years | 0 (0.0%) | 0 (0.0%) |
| 75 Years and over | 0 (0.0%) | 0 (0.0%) |
Disability Class: Ambulatory Difficulty
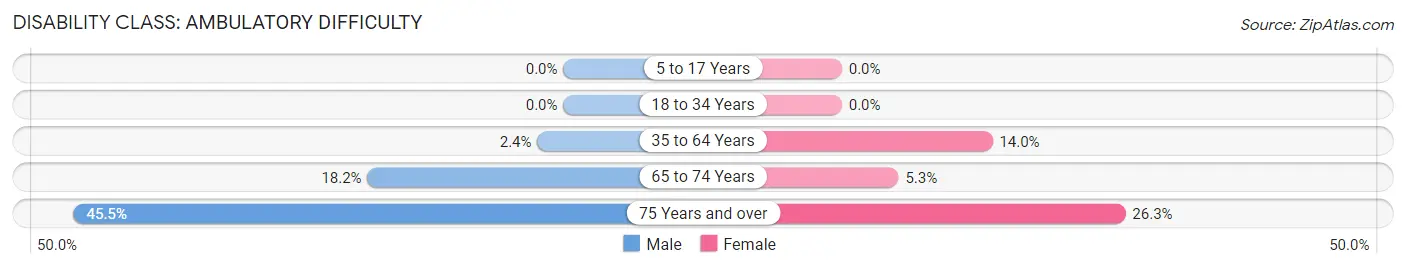
| Age Bracket | Male | Female |
| 5 to 17 Years | 0 (0.0%) | 0 (0.0%) |
| 18 to 34 Years | 0 (0.0%) | 0 (0.0%) |
| 35 to 64 Years | 2 (2.4%) | 13 (14.0%) |
| 65 to 74 Years | 4 (18.2%) | 1 (5.3%) |
| 75 Years and over | 5 (45.5%) | 5 (26.3%) |
Disability Class: Self-Care Difficulty
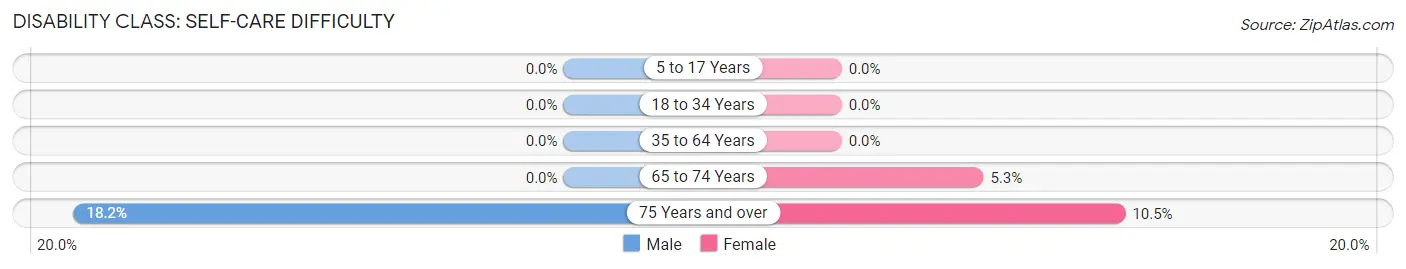
| Age Bracket | Male | Female |
| 5 to 17 Years | 0 (0.0%) | 0 (0.0%) |
| 18 to 34 Years | 0 (0.0%) | 0 (0.0%) |
| 35 to 64 Years | 0 (0.0%) | 0 (0.0%) |
| 65 to 74 Years | 0 (0.0%) | 1 (5.3%) |
| 75 Years and over | 2 (18.2%) | 2 (10.5%) |
Technology Access in Yatesville
Computing Device Access in Yatesville
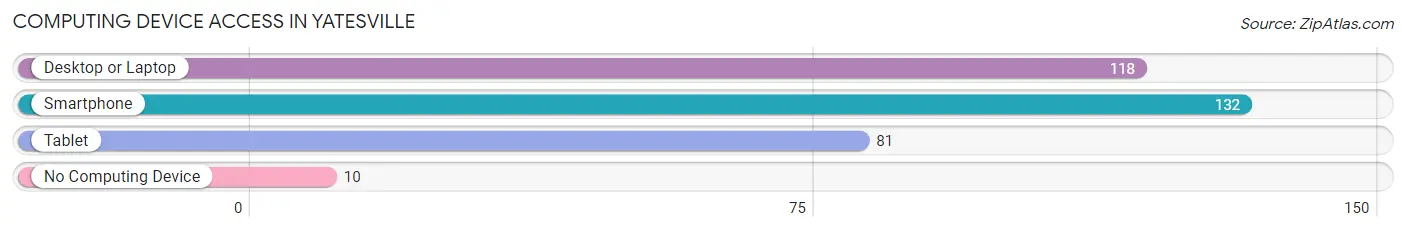
| Device Type | # Households | % Households |
| Desktop or Laptop | 118 | 73.3% |
| Smartphone | 132 | 82.0% |
| Tablet | 81 | 50.3% |
| No Computing Device | 10 | 6.2% |
| Total | 161 | 100.0% |
Internet Access in Yatesville
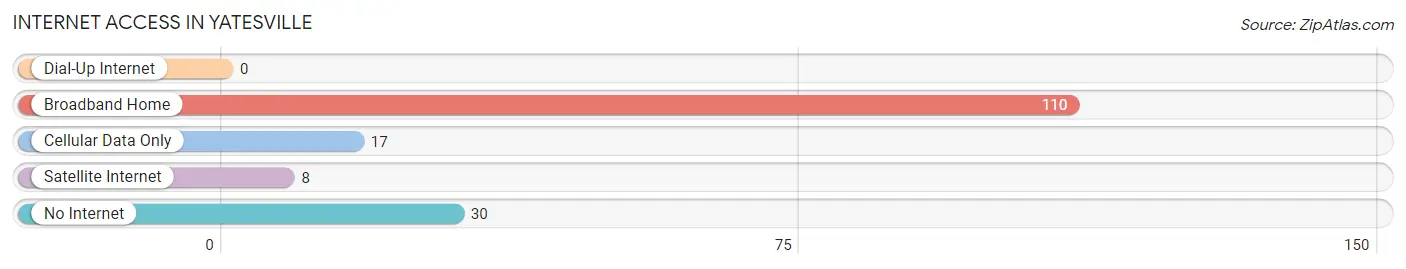
| Internet Type | # Households | % Households |
| Dial-Up Internet | 0 | 0.0% |
| Broadband Home | 110 | 68.3% |
| Cellular Data Only | 17 | 10.6% |
| Satellite Internet | 8 | 5.0% |
| No Internet | 30 | 18.6% |
| Total | 161 | 100.0% |
Yatesville Summary
Yatesville is a small town located in Upson County, Georgia, United States. It is situated in the southwestern part of the state, about 50 miles south of Atlanta. The town was founded in 1820 and named after William Yates, a prominent local landowner. The population of Yatesville was estimated to be 1,072 in 2019.
Geography
Yatesville is located in the southwestern part of Upson County, Georgia, at the intersection of Georgia State Route 36 and Georgia State Route 74. The town is situated on the banks of the Flint River, which flows through the area. The town is surrounded by rolling hills and forests, and is located about 50 miles south of Atlanta.
Climate
Yatesville has a humid subtropical climate, with hot, humid summers and mild winters. The average annual temperature is around 70°F (21°C), with an average high of around 90°F (32°C) in the summer and an average low of around 50°F (10°C) in the winter. The area receives an average of 48 inches (122 cm) of precipitation per year, with most of it falling in the summer months.
Demographics
As of the 2010 census, the population of Yatesville was 1,072. The racial makeup of the town was 79.2% White, 17.3% African American, 0.3% Native American, 0.3% Asian, 0.1% Pacific Islander, 1.2% from other races, and 1.7% from two or more races. Hispanic or Latino of any race were 2.7% of the population.
Economy
Yatesville’s economy is largely based on agriculture and forestry. The town is home to several farms, as well as a sawmill and a lumber mill. The town also has a few small businesses, including a grocery store, a hardware store, and a few restaurants.
History
Yatesville was founded in 1820 and named after William Yates, a prominent local landowner. The town was originally a small farming community, but it grew in size and importance in the late 19th century when the railroad was built through the area. The town was incorporated in 1891 and has remained relatively unchanged since then.
In the early 20th century, Yatesville was a popular destination for tourists, who came to enjoy the area’s natural beauty and outdoor activities. The town was also home to several resorts, which attracted visitors from all over the country.
Today, Yatesville is a quiet, rural town with a strong sense of community. The town is home to several churches, a library, and a few small businesses. The town is also home to the Yatesville Historical Society, which works to preserve the town’s history and culture.
Common Questions
What is Per Capita Income in Yatesville?
Per Capita income in Yatesville is $29,561.
What is the Median Family Income in Yatesville?
Median Family Income in Yatesville is $82,583.
What is the Median Household income in Yatesville?
Median Household Income in Yatesville is $62,019.
What is Income or Wage Gap in Yatesville?
Income or Wage Gap in Yatesville is 38.7%.
Women in Yatesville earn 61.3 cents for every dollar earned by a man.
What is Inequality or Gini Index in Yatesville?
Inequality or Gini Index in Yatesville is 0.35.
What is the Total Population of Yatesville?
Total Population of Yatesville is 358.
What is the Total Male Population of Yatesville?
Total Male Population of Yatesville is 158.
What is the Total Female Population of Yatesville?
Total Female Population of Yatesville is 200.
What is the Ratio of Males per 100 Females in Yatesville?
There are 79.00 Males per 100 Females in Yatesville.
What is the Ratio of Females per 100 Males in Yatesville?
There are 126.58 Females per 100 Males in Yatesville.
What is the Median Population Age in Yatesville?
Median Population Age in Yatesville is 52.8 Years.
What is the Average Family Size in Yatesville
Average Family Size in Yatesville is 2.6 People.
What is the Average Household Size in Yatesville
Average Household Size in Yatesville is 2.2 People.
How Large is the Labor Force in Yatesville?
There are 190 People in the Labor Forcein in Yatesville.
What is the Percentage of People in the Labor Force in Yatesville?
59.9% of People are in the Labor Force in Yatesville.
What is the Unemployment Rate in Yatesville?
Unemployment Rate in Yatesville is 1.1%.