Sandersville, GA Map & Demographics
Sandersville Map
Sandersville Overview
$21,959
PER CAPITA INCOME
$56,981
AVG FAMILY INCOME
$45,502
AVG HOUSEHOLD INCOME
39.6%
WAGE / INCOME GAP [ % ]
60.4¢/ $1
WAGE / INCOME GAP [ $ ]
0.43
INEQUALITY / GINI INDEX
5,727
TOTAL POPULATION
2,574
MALE POPULATION
3,153
FEMALE POPULATION
81.64
MALES / 100 FEMALES
122.49
FEMALES / 100 MALES
36.1
MEDIAN AGE
3.3
AVG FAMILY SIZE
2.6
AVG HOUSEHOLD SIZE
2,354
LABOR FORCE [ PEOPLE ]
52.9%
PERCENT IN LABOR FORCE
7.9%
UNEMPLOYMENT RATE
Sandersville Zip Codes
Sandersville Area Codes
Income in Sandersville
Income Overview in Sandersville
Per Capita Income in Sandersville is $21,959, while median incomes of families and households are $56,981 and $45,502 respectively.
| Characteristic | Number | Measure |
| Per Capita Income | 5,727 | $21,959 |
| Median Family Income | 1,383 | $56,981 |
| Mean Family Income | 1,383 | $70,549 |
| Median Household Income | 2,083 | $45,502 |
| Mean Household Income | 2,083 | $57,341 |
| Income Deficit | 1,383 | $0 |
| Wage / Income Gap (%) | 5,727 | 39.57% |
| Wage / Income Gap ($) | 5,727 | 60.43¢ per $1 |
| Gini / Inequality Index | 5,727 | 0.43 |
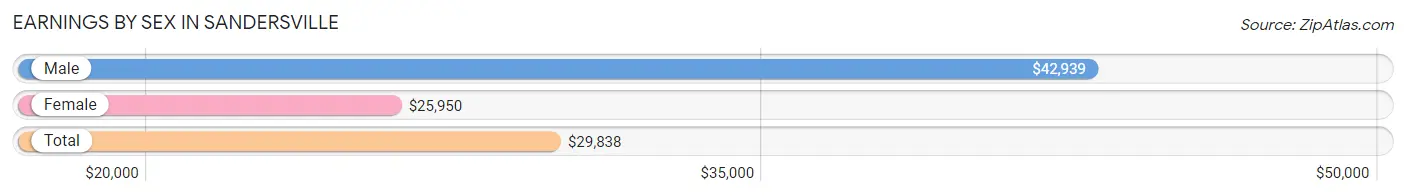
Earnings by Sex in Sandersville
Average Earnings in Sandersville are $29,838, $42,939 for men and $25,950 for women, a difference of 39.6%.
| Sex | Number | Average Earnings |
| Male | 902 (34.9%) | $42,939 |
| Female | 1,680 (65.1%) | $25,950 |
| Total | 2,582 (100.0%) | $29,838 |
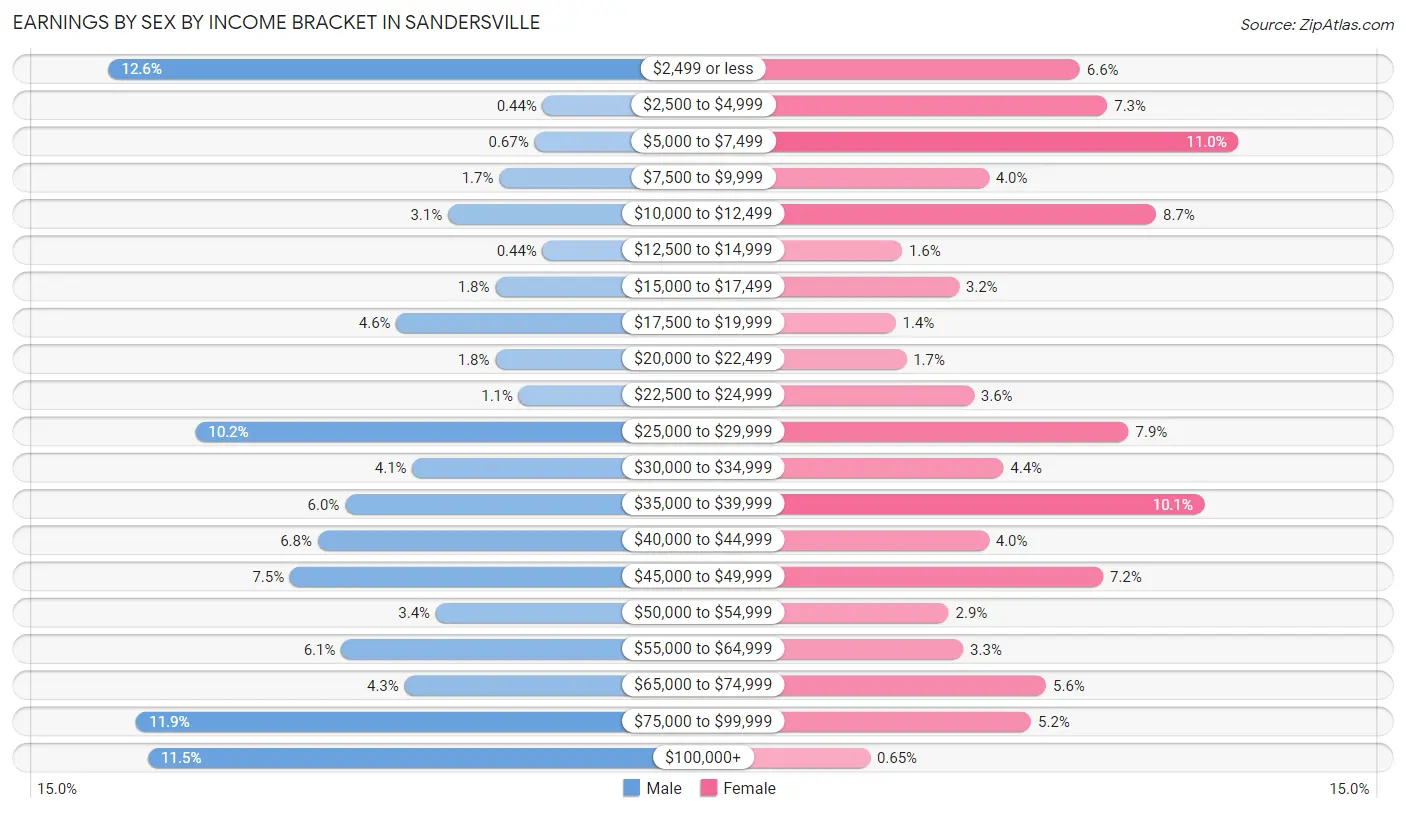
Earnings by Sex by Income Bracket in Sandersville
The most common earnings brackets in Sandersville are $2,499 or less for men (114 | 12.6%) and $5,000 to $7,499 for women (185 | 11.0%).
| Income | Male | Female |
| $2,499 or less | 114 (12.6%) | 110 (6.6%) |
| $2,500 to $4,999 | 4 (0.4%) | 123 (7.3%) |
| $5,000 to $7,499 | 6 (0.7%) | 185 (11.0%) |
| $7,500 to $9,999 | 15 (1.7%) | 67 (4.0%) |
| $10,000 to $12,499 | 28 (3.1%) | 146 (8.7%) |
| $12,500 to $14,999 | 4 (0.4%) | 26 (1.5%) |
| $15,000 to $17,499 | 16 (1.8%) | 53 (3.2%) |
| $17,500 to $19,999 | 41 (4.5%) | 23 (1.4%) |
| $20,000 to $22,499 | 16 (1.8%) | 28 (1.7%) |
| $22,500 to $24,999 | 10 (1.1%) | 60 (3.6%) |
| $25,000 to $29,999 | 92 (10.2%) | 133 (7.9%) |
| $30,000 to $34,999 | 37 (4.1%) | 74 (4.4%) |
| $35,000 to $39,999 | 54 (6.0%) | 169 (10.1%) |
| $40,000 to $44,999 | 61 (6.8%) | 67 (4.0%) |
| $45,000 to $49,999 | 68 (7.5%) | 121 (7.2%) |
| $50,000 to $54,999 | 31 (3.4%) | 48 (2.9%) |
| $55,000 to $64,999 | 55 (6.1%) | 55 (3.3%) |
| $65,000 to $74,999 | 39 (4.3%) | 94 (5.6%) |
| $75,000 to $99,999 | 107 (11.9%) | 87 (5.2%) |
| $100,000+ | 104 (11.5%) | 11 (0.6%) |
| Total | 902 (100.0%) | 1,680 (100.0%) |
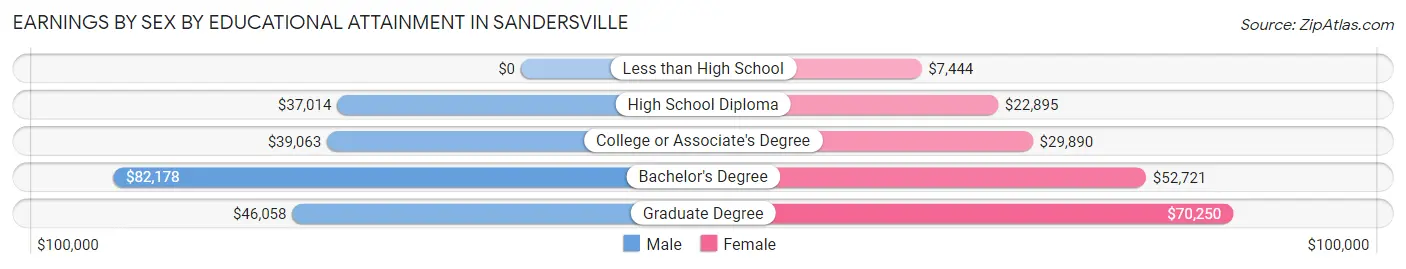
Earnings by Sex by Educational Attainment in Sandersville
Average earnings in Sandersville are $48,325 for men and $28,524 for women, a difference of 41.0%. Men with an educational attainment of bachelor's degree enjoy the highest average annual earnings of $82,178, while those with high school diploma education earn the least with $37,014. Women with an educational attainment of graduate degree earn the most with the average annual earnings of $70,250, while those with less than high school education have the smallest earnings of $7,444.
| Educational Attainment | Male Income | Female Income |
| Less than High School | - | - |
| High School Diploma | $37,014 | $22,895 |
| College or Associate's Degree | $39,063 | $29,890 |
| Bachelor's Degree | $82,178 | $52,721 |
| Graduate Degree | $46,058 | $70,250 |
| Total | $48,325 | $28,524 |
Family Income in Sandersville
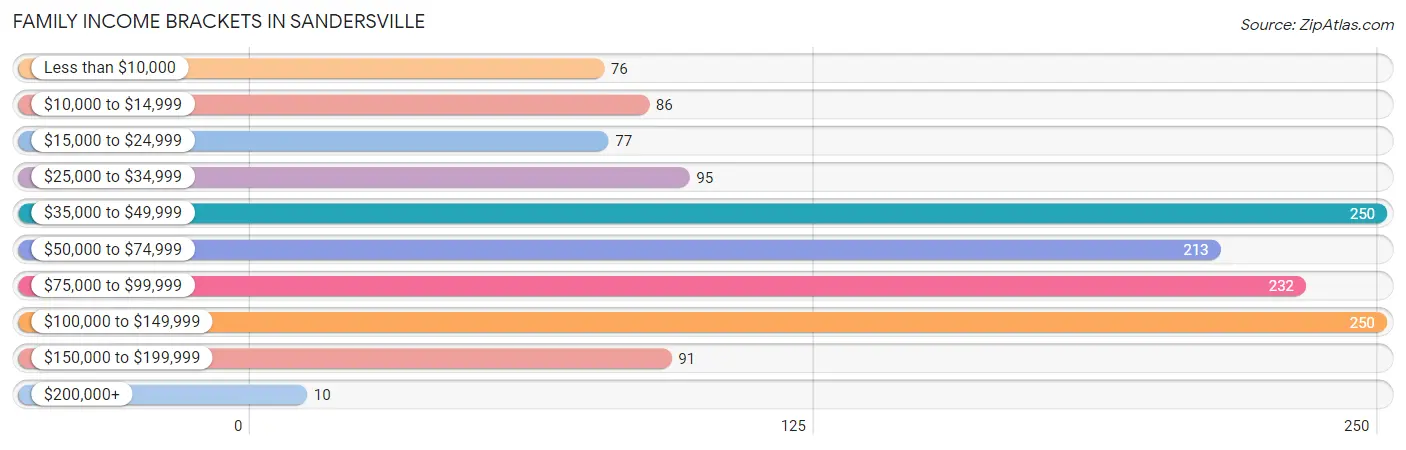
Family Income Brackets in Sandersville
According to the Sandersville family income data, there are 250 families falling into the $35,000 to $49,999 income range, which is the most common income bracket and makes up 18.1% of all families. Conversely, the $200,000+ income bracket is the least frequent group with only 10 families (0.7%) belonging to this category.
| Income Bracket | # Families | % Families |
| Less than $10,000 | 76 | 5.5% |
| $10,000 to $14,999 | 86 | 6.2% |
| $15,000 to $24,999 | 77 | 5.6% |
| $25,000 to $34,999 | 95 | 6.9% |
| $35,000 to $49,999 | 250 | 18.1% |
| $50,000 to $74,999 | 213 | 15.4% |
| $75,000 to $99,999 | 232 | 16.8% |
| $100,000 to $149,999 | 250 | 18.1% |
| $150,000 to $199,999 | 91 | 6.6% |
| $200,000+ | 10 | 0.7% |
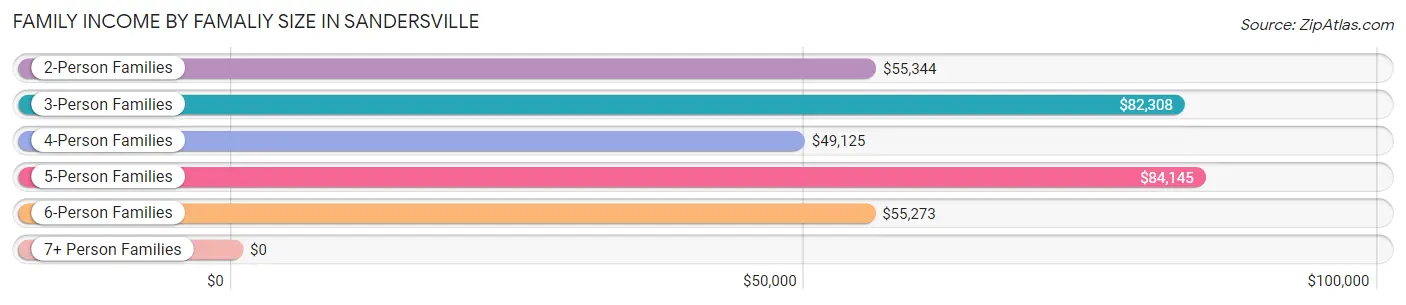
Family Income by Famaliy Size in Sandersville
5-person families (55 | 4.0%) account for the highest median family income in Sandersville with $84,145 per family, while 2-person families (601 | 43.5%) have the highest median income of $27,672 per family member.
| Income Bracket | # Families | Median Income |
| 2-Person Families | 601 (43.5%) | $55,344 |
| 3-Person Families | 334 (24.1%) | $82,308 |
| 4-Person Families | 296 (21.4%) | $49,125 |
| 5-Person Families | 55 (4.0%) | $84,145 |
| 6-Person Families | 73 (5.3%) | $55,273 |
| 7+ Person Families | 24 (1.7%) | $0 |
| Total | 1,383 (100.0%) | $56,981 |
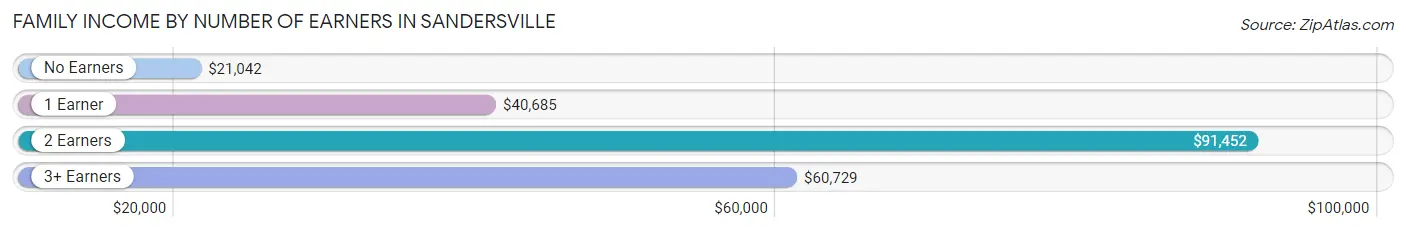
Family Income by Number of Earners in Sandersville
The median family income in Sandersville is $56,981, with families comprising 2 earners (592) having the highest median family income of $91,452, while families with no earners (206) have the lowest median family income of $21,042, accounting for 42.8% and 14.9% of families, respectively.
| Number of Earners | # Families | Median Income |
| No Earners | 206 (14.9%) | $21,042 |
| 1 Earner | 483 (34.9%) | $40,685 |
| 2 Earners | 592 (42.8%) | $91,452 |
| 3+ Earners | 102 (7.4%) | $60,729 |
| Total | 1,383 (100.0%) | $56,981 |
Household Income in Sandersville
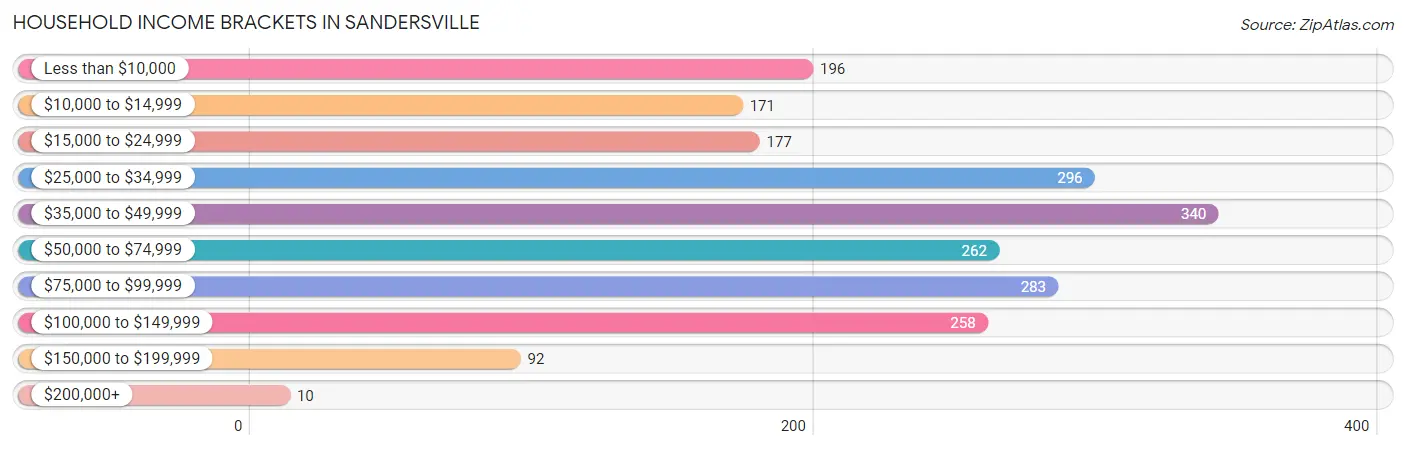
Household Income Brackets in Sandersville
With 340 households falling in the category, the $35,000 to $49,999 income range is the most frequent in Sandersville, accounting for 16.3% of all households. In contrast, only 10 households (0.5%) fall into the $200,000+ income bracket, making it the least populous group.
| Income Bracket | # Households | % Households |
| Less than $10,000 | 196 | 9.4% |
| $10,000 to $14,999 | 171 | 8.2% |
| $15,000 to $24,999 | 177 | 8.5% |
| $25,000 to $34,999 | 296 | 14.2% |
| $35,000 to $49,999 | 340 | 16.3% |
| $50,000 to $74,999 | 262 | 12.6% |
| $75,000 to $99,999 | 283 | 13.6% |
| $100,000 to $149,999 | 258 | 12.4% |
| $150,000 to $199,999 | 92 | 4.4% |
| $200,000+ | 10 | 0.5% |
Household Income by Householder Age in Sandersville
The median household income in Sandersville is $45,502, with the highest median household income of $49,188 found in the 25 to 44 years age bracket for the primary householder. A total of 619 households (29.7%) fall into this category. Meanwhile, the 15 to 24 years age bracket for the primary householder has the lowest median household income of $0, with 65 households (3.1%) in this group.
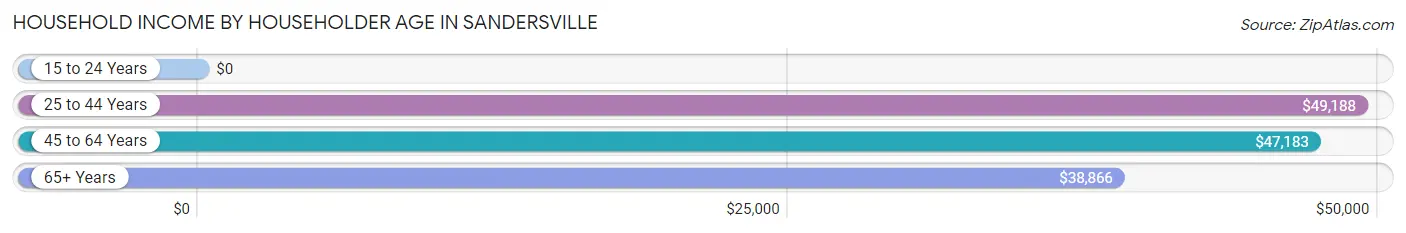
| Income Bracket | # Households | Median Income |
| 15 to 24 Years | 65 (3.1%) | $0 |
| 25 to 44 Years | 619 (29.7%) | $49,188 |
| 45 to 64 Years | 772 (37.1%) | $47,183 |
| 65+ Years | 627 (30.1%) | $38,866 |
| Total | 2,083 (100.0%) | $45,502 |
Poverty in Sandersville
Income Below Poverty by Sex and Age in Sandersville
With 16.1% poverty level for males and 22.9% for females among the residents of Sandersville, under 5 year old males and 6 to 11 year old females are the most vulnerable to poverty, with 157 males (77.0%) and 104 females (52.8%) in their respective age groups living below the poverty level.
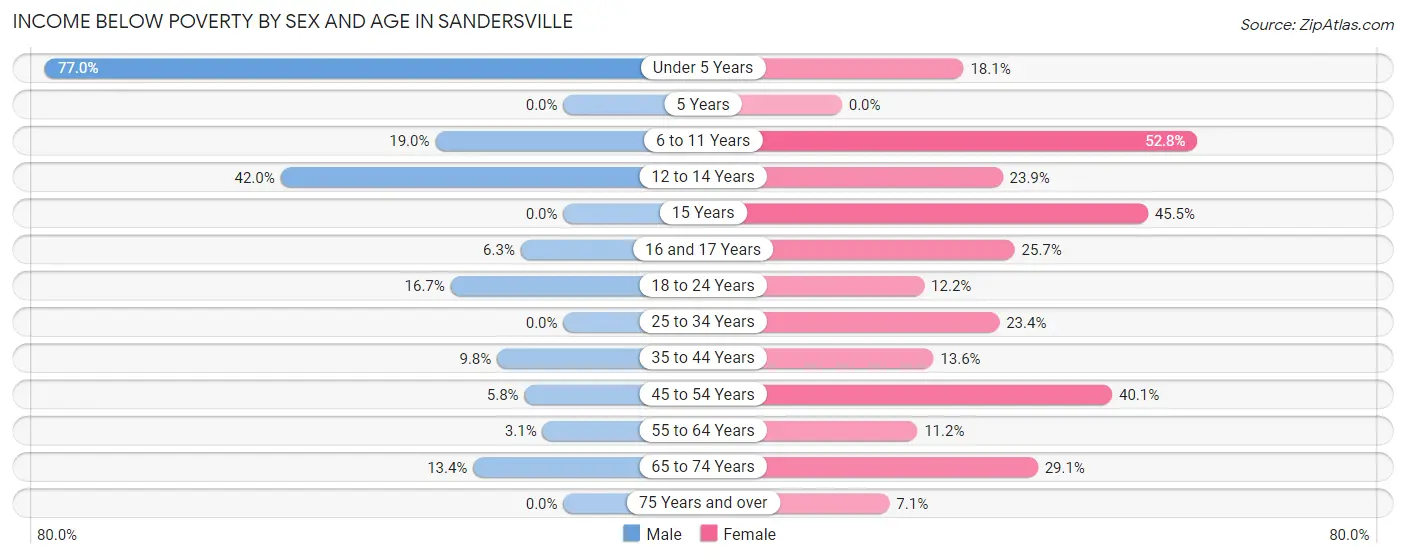
| Age Bracket | Male | Female |
| Under 5 Years | 157 (77.0%) | 30 (18.1%) |
| 5 Years | 0 (0.0%) | 0 (0.0%) |
| 6 to 11 Years | 69 (19.0%) | 104 (52.8%) |
| 12 to 14 Years | 42 (42.0%) | 32 (23.9%) |
| 15 Years | 0 (0.0%) | 15 (45.5%) |
| 16 and 17 Years | 10 (6.3%) | 39 (25.7%) |
| 18 to 24 Years | 38 (16.7%) | 39 (12.2%) |
| 25 to 34 Years | 0 (0.0%) | 101 (23.4%) |
| 35 to 44 Years | 19 (9.8%) | 51 (13.6%) |
| 45 to 54 Years | 16 (5.8%) | 126 (40.1%) |
| 55 to 64 Years | 12 (3.1%) | 40 (11.2%) |
| 65 to 74 Years | 34 (13.4%) | 96 (29.1%) |
| 75 Years and over | 0 (0.0%) | 13 (7.1%) |
| Total | 397 (16.1%) | 686 (22.9%) |
Income Above Poverty by Sex and Age in Sandersville
According to the poverty statistics in Sandersville, males aged 5 years and females aged 75 years and over are the age groups that are most secure financially, with 100.0% of males and 92.9% of females in these age groups living above the poverty line.
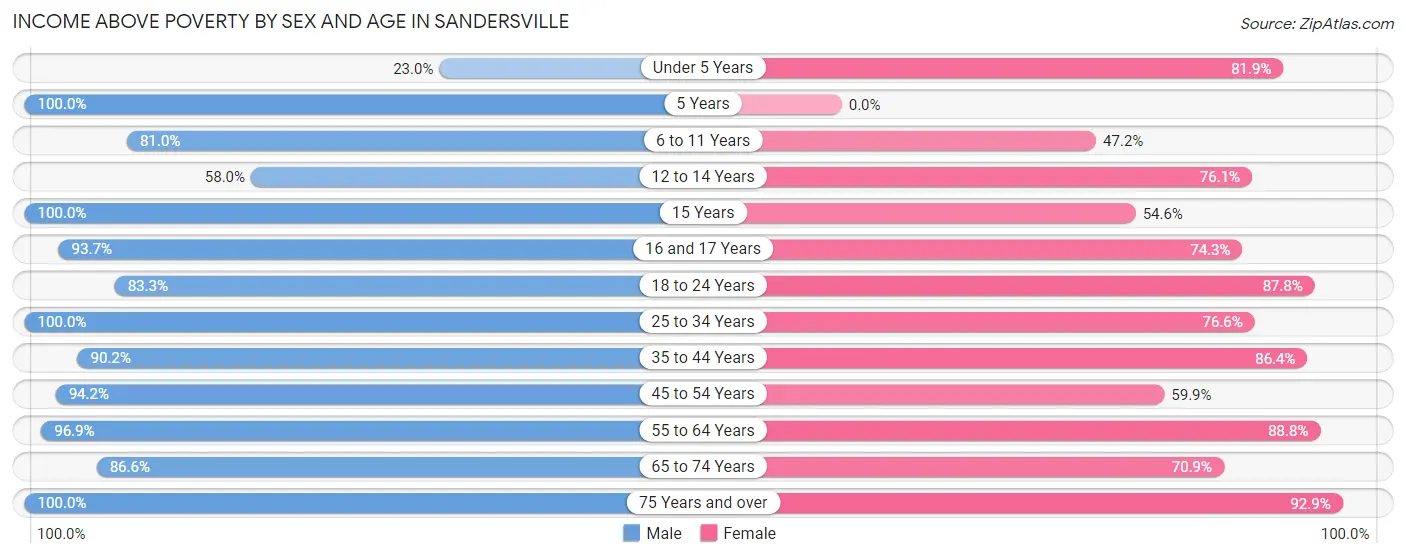
| Age Bracket | Male | Female |
| Under 5 Years | 47 (23.0%) | 136 (81.9%) |
| 5 Years | 41 (100.0%) | 0 (0.0%) |
| 6 to 11 Years | 294 (81.0%) | 93 (47.2%) |
| 12 to 14 Years | 58 (58.0%) | 102 (76.1%) |
| 15 Years | 35 (100.0%) | 18 (54.5%) |
| 16 and 17 Years | 148 (93.7%) | 113 (74.3%) |
| 18 to 24 Years | 189 (83.3%) | 280 (87.8%) |
| 25 to 34 Years | 156 (100.0%) | 331 (76.6%) |
| 35 to 44 Years | 174 (90.2%) | 324 (86.4%) |
| 45 to 54 Years | 261 (94.2%) | 188 (59.9%) |
| 55 to 64 Years | 375 (96.9%) | 317 (88.8%) |
| 65 to 74 Years | 220 (86.6%) | 234 (70.9%) |
| 75 Years and over | 76 (100.0%) | 171 (92.9%) |
| Total | 2,074 (83.9%) | 2,307 (77.1%) |
Income Below Poverty Among Married-Couple Families in Sandersville
The poverty statistics for married-couple families in Sandersville show that 7.4% or 50 of the total 676 families live below the poverty line. Families with 1 or 2 children have the highest poverty rate of 10.9%, comprising of 32 families. On the other hand, families with 3 or 4 children have the lowest poverty rate of 0.0%, which includes 0 families.
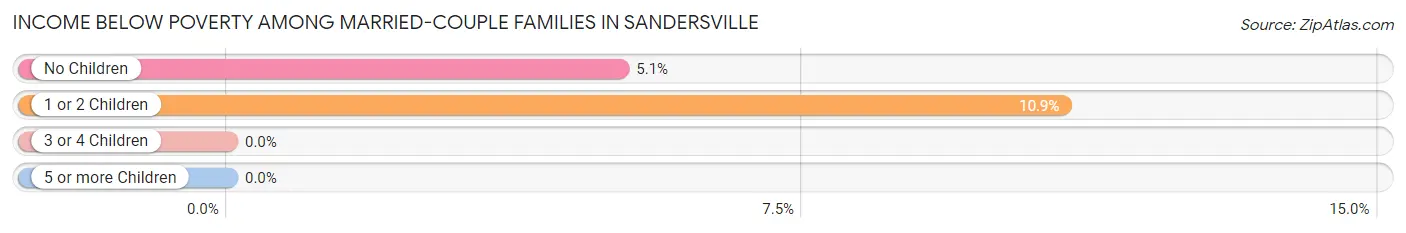
| Children | Above Poverty | Below Poverty |
| No Children | 334 (94.9%) | 18 (5.1%) |
| 1 or 2 Children | 262 (89.1%) | 32 (10.9%) |
| 3 or 4 Children | 30 (100.0%) | 0 (0.0%) |
| 5 or more Children | 0 (0.0%) | 0 (0.0%) |
| Total | 626 (92.6%) | 50 (7.4%) |
Income Below Poverty Among Single-Parent Households in Sandersville
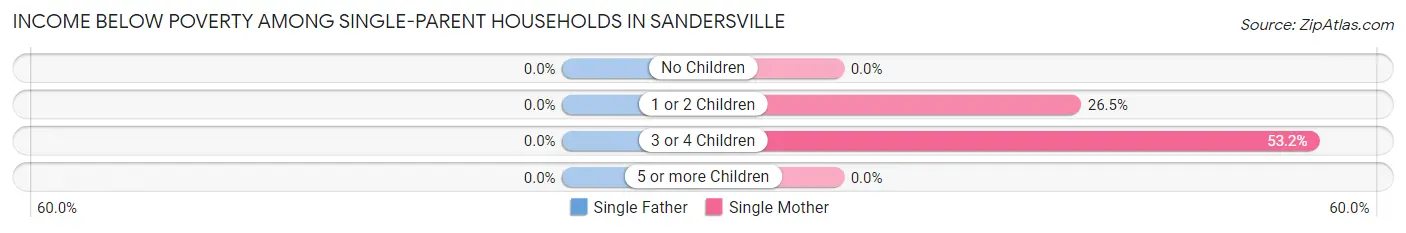
| Children | Single Father | Single Mother |
| No Children | 0 (0.0%) | 0 (0.0%) |
| 1 or 2 Children | 0 (0.0%) | 93 (26.5%) |
| 3 or 4 Children | 0 (0.0%) | 76 (53.1%) |
| 5 or more Children | 0 (0.0%) | 0 (0.0%) |
| Total | 0 (0.0%) | 169 (26.2%) |
Income Below Poverty Among Married-Couple vs Single-Parent Households in Sandersville
The poverty data for Sandersville shows that 50 of the married-couple family households (7.4%) and 169 of the single-parent households (23.9%) are living below the poverty level. Within the married-couple family households, those with 1 or 2 children have the highest poverty rate, with 32 households (10.9%) falling below the poverty line. Among the single-parent households, those with 3 or 4 children have the highest poverty rate, with 76 household (53.1%) living below poverty.
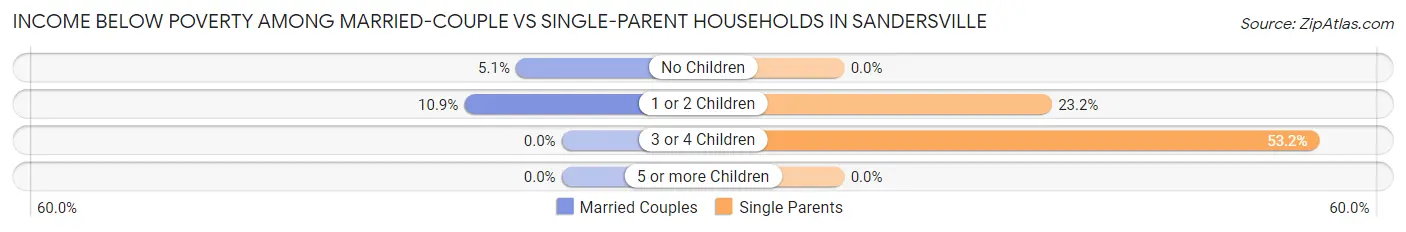
| Children | Married-Couple Families | Single-Parent Households |
| No Children | 18 (5.1%) | 0 (0.0%) |
| 1 or 2 Children | 32 (10.9%) | 93 (23.2%) |
| 3 or 4 Children | 0 (0.0%) | 76 (53.1%) |
| 5 or more Children | 0 (0.0%) | 0 (0.0%) |
| Total | 50 (7.4%) | 169 (23.9%) |
Race in Sandersville
The most populous races in Sandersville are Black / African American (3,252 | 56.8%), White / Caucasian (1,997 | 34.9%), and Two or more Races (360 | 6.3%).
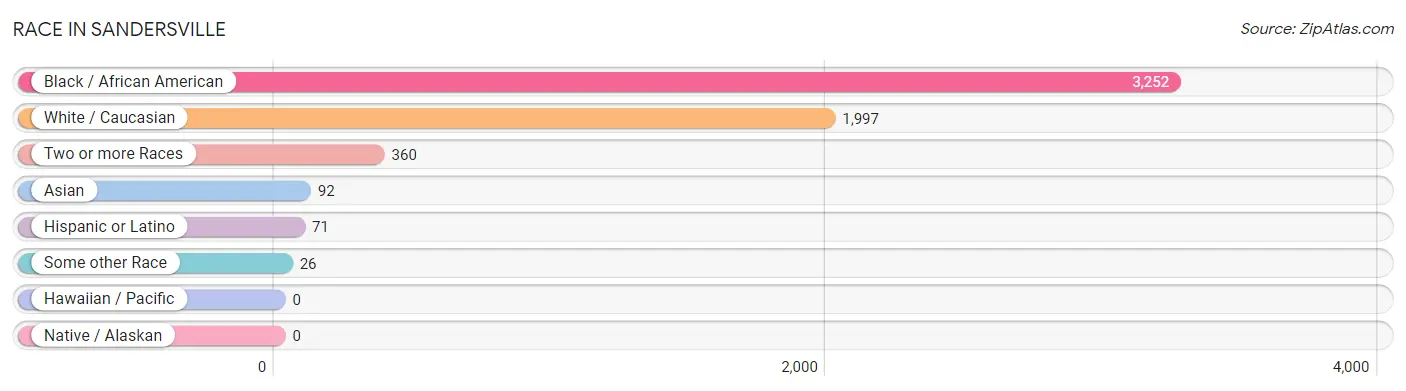
| Race | # Population | % Population |
| Asian | 92 | 1.6% |
| Black / African American | 3,252 | 56.8% |
| Hawaiian / Pacific | 0 | 0.0% |
| Hispanic or Latino | 71 | 1.2% |
| Native / Alaskan | 0 | 0.0% |
| White / Caucasian | 1,997 | 34.9% |
| Two or more Races | 360 | 6.3% |
| Some other Race | 26 | 0.4% |
| Total | 5,727 | 100.0% |
Ancestry in Sandersville
The most populous ancestries reported in Sandersville are American (314 | 5.5%), English (291 | 5.1%), Irish (170 | 3.0%), German (95 | 1.7%), and Thai (92 | 1.6%), together accounting for 16.8% of all Sandersville residents.
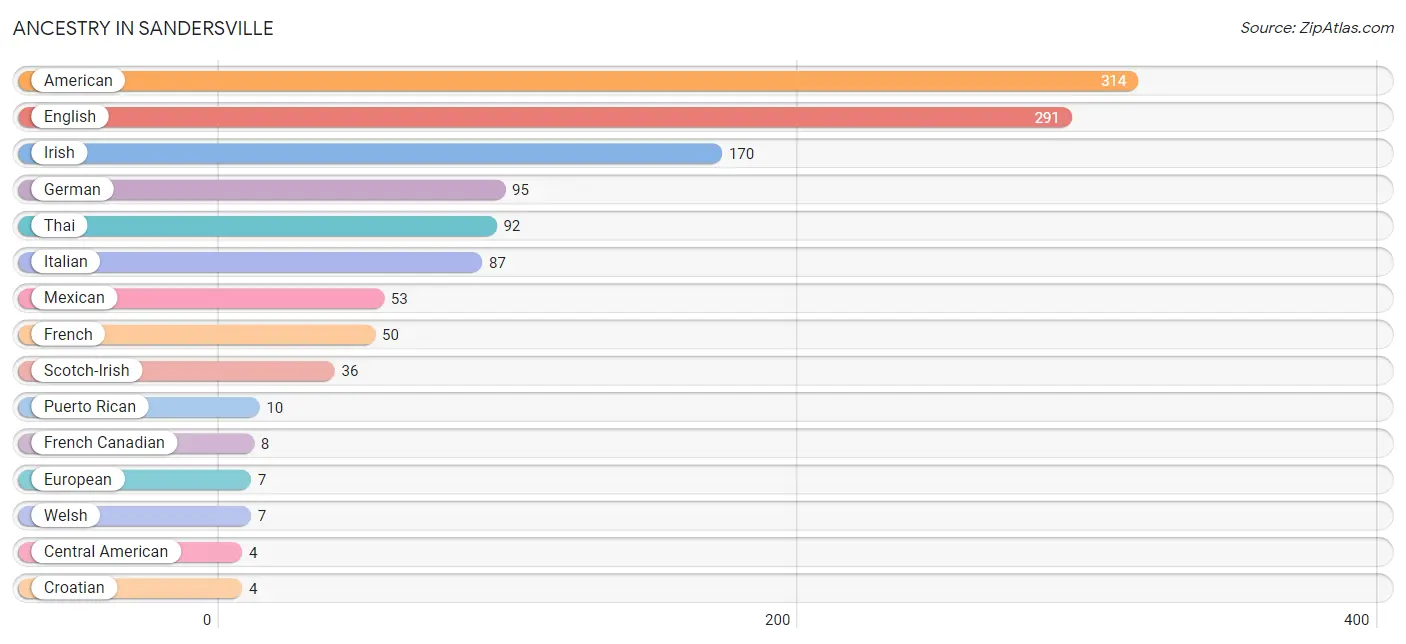
| Ancestry | # Population | % Population |
| American | 314 | 5.5% |
| Central American | 4 | 0.1% |
| Choctaw | 1 | 0.0% |
| Croatian | 4 | 0.1% |
| Cuban | 4 | 0.1% |
| English | 291 | 5.1% |
| European | 7 | 0.1% |
| French | 50 | 0.9% |
| French Canadian | 8 | 0.1% |
| German | 95 | 1.7% |
| Irish | 170 | 3.0% |
| Italian | 87 | 1.5% |
| Mexican | 53 | 0.9% |
| Panamanian | 4 | 0.1% |
| Polish | 3 | 0.1% |
| Puerto Rican | 10 | 0.2% |
| Scandinavian | 4 | 0.1% |
| Scotch-Irish | 36 | 0.6% |
| Scottish | 4 | 0.1% |
| Thai | 92 | 1.6% |
| Welsh | 7 | 0.1% | View All 21 Rows |
Immigrants in Sandersville
The most numerous immigrant groups reported in Sandersville came from Asia (60 | 1.1%), India (60 | 1.1%), South Central Asia (60 | 1.1%), Central America (4 | 0.1%), and Latin America (4 | 0.1%), together accounting for 3.3% of all Sandersville residents.
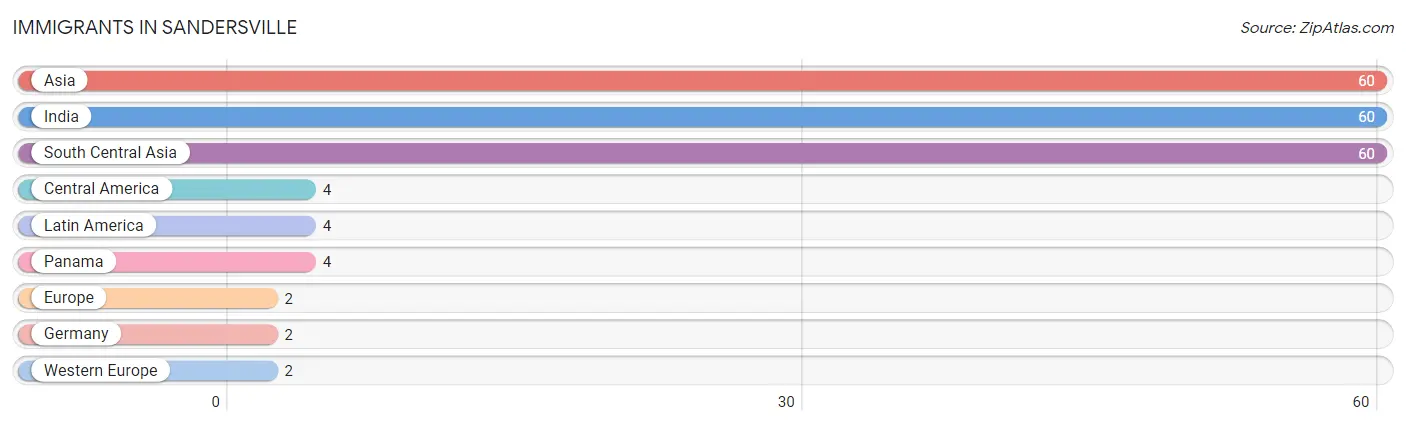
| Immigration Origin | # Population | % Population |
| Asia | 60 | 1.1% |
| Central America | 4 | 0.1% |
| Europe | 2 | 0.0% |
| Germany | 2 | 0.0% |
| India | 60 | 1.1% |
| Latin America | 4 | 0.1% |
| Panama | 4 | 0.1% |
| South Central Asia | 60 | 1.1% |
| Western Europe | 2 | 0.0% | View All 9 Rows |
Sex and Age in Sandersville
Sex and Age in Sandersville
The most populous age groups in Sandersville are 5 to 9 Years (299 | 11.6%) for men and 15 to 19 Years (322 | 10.2%) for women.
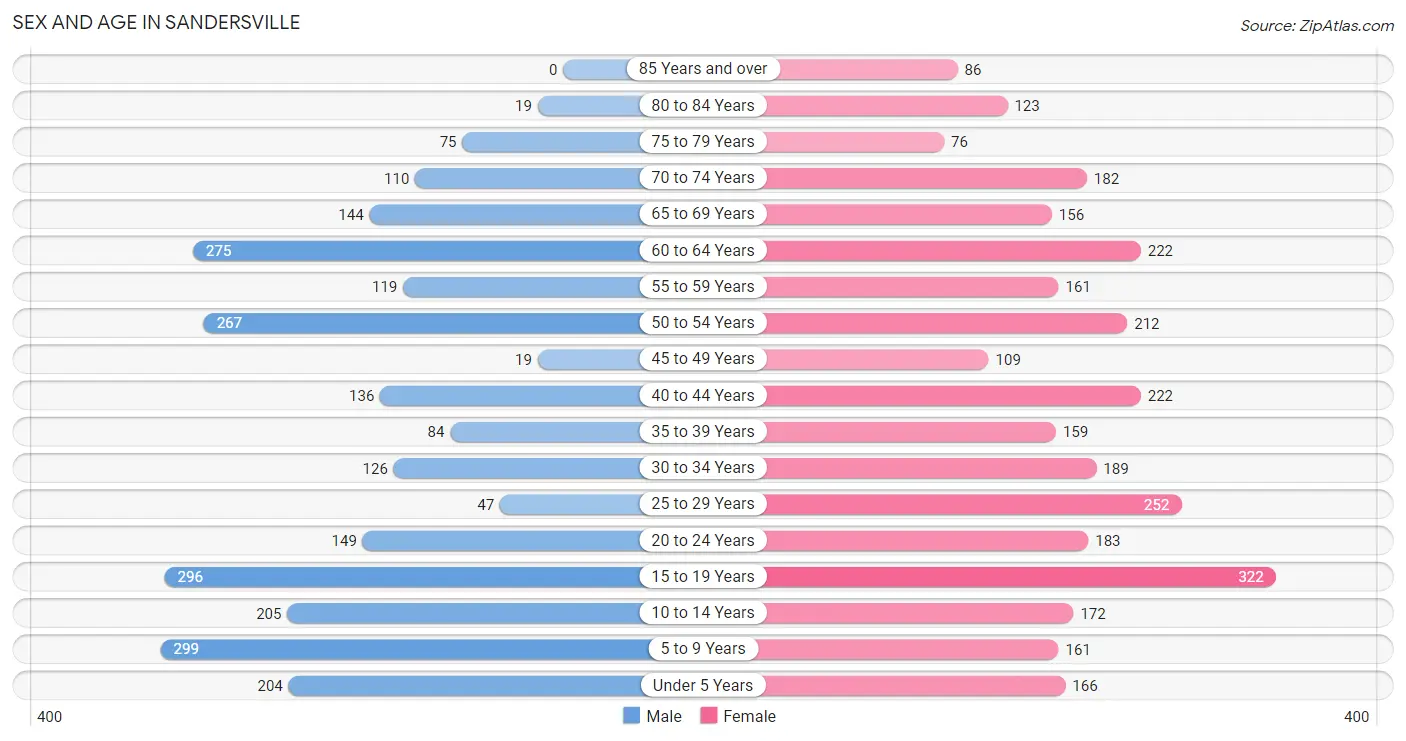
| Age Bracket | Male | Female |
| Under 5 Years | 204 (7.9%) | 166 (5.3%) |
| 5 to 9 Years | 299 (11.6%) | 161 (5.1%) |
| 10 to 14 Years | 205 (8.0%) | 172 (5.5%) |
| 15 to 19 Years | 296 (11.5%) | 322 (10.2%) |
| 20 to 24 Years | 149 (5.8%) | 183 (5.8%) |
| 25 to 29 Years | 47 (1.8%) | 252 (8.0%) |
| 30 to 34 Years | 126 (4.9%) | 189 (6.0%) |
| 35 to 39 Years | 84 (3.3%) | 159 (5.0%) |
| 40 to 44 Years | 136 (5.3%) | 222 (7.0%) |
| 45 to 49 Years | 19 (0.7%) | 109 (3.5%) |
| 50 to 54 Years | 267 (10.4%) | 212 (6.7%) |
| 55 to 59 Years | 119 (4.6%) | 161 (5.1%) |
| 60 to 64 Years | 275 (10.7%) | 222 (7.0%) |
| 65 to 69 Years | 144 (5.6%) | 156 (5.0%) |
| 70 to 74 Years | 110 (4.3%) | 182 (5.8%) |
| 75 to 79 Years | 75 (2.9%) | 76 (2.4%) |
| 80 to 84 Years | 19 (0.7%) | 123 (3.9%) |
| 85 Years and over | 0 (0.0%) | 86 (2.7%) |
| Total | 2,574 (100.0%) | 3,153 (100.0%) |
Families and Households in Sandersville
Median Family Size in Sandersville
The median family size in Sandersville is 3.33 persons per family, with single female/mother families (645 | 46.6%) accounting for the largest median family size of 3.96 persons per family. On the other hand, single male/father families (62 | 4.5%) represent the smallest median family size with 2.76 persons per family.
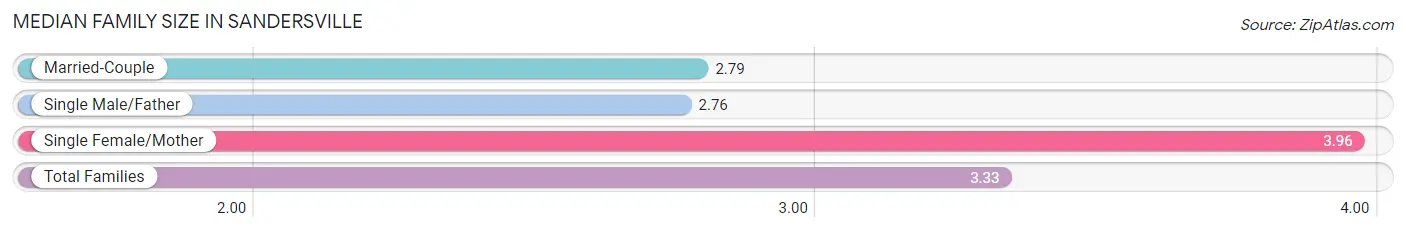
| Family Type | # Families | Family Size |
| Married-Couple | 676 (48.9%) | 2.79 |
| Single Male/Father | 62 (4.5%) | 2.76 |
| Single Female/Mother | 645 (46.6%) | 3.96 |
| Total Families | 1,383 (100.0%) | 3.33 |
Median Household Size in Sandersville
The median household size in Sandersville is 2.62 persons per household, with single female/mother households (645 | 31.0%) accounting for the largest median household size of 4.14 persons per household. non-family households (700 | 33.6%) represent the smallest median household size with 1.06 persons per household.
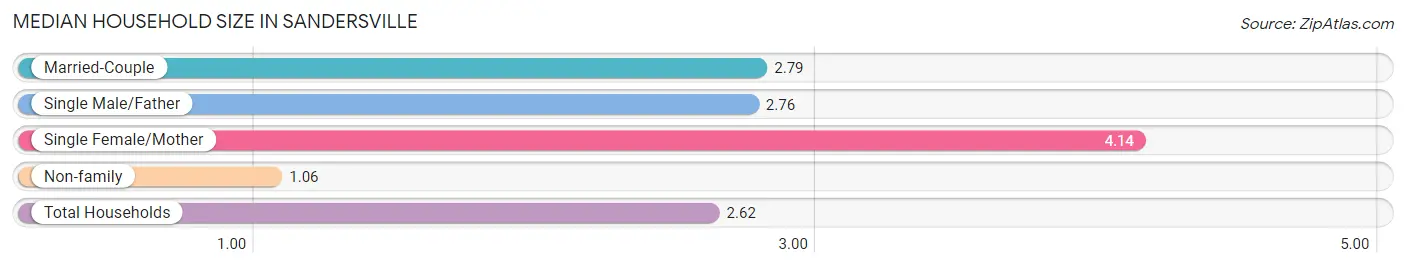
| Household Type | # Households | Household Size |
| Married-Couple | 676 (32.5%) | 2.79 |
| Single Male/Father | 62 (3.0%) | 2.76 |
| Single Female/Mother | 645 (31.0%) | 4.14 |
| Non-family | 700 (33.6%) | 1.06 |
| Total Households | 2,083 (100.0%) | 2.62 |
Household Size by Marriage Status in Sandersville
Out of a total of 2,083 households in Sandersville, 1,383 (66.4%) are family households, while 700 (33.6%) are nonfamily households. The most numerous type of family households are 2-person households, comprising 585, and the most common type of nonfamily households are 1-person households, comprising 649.
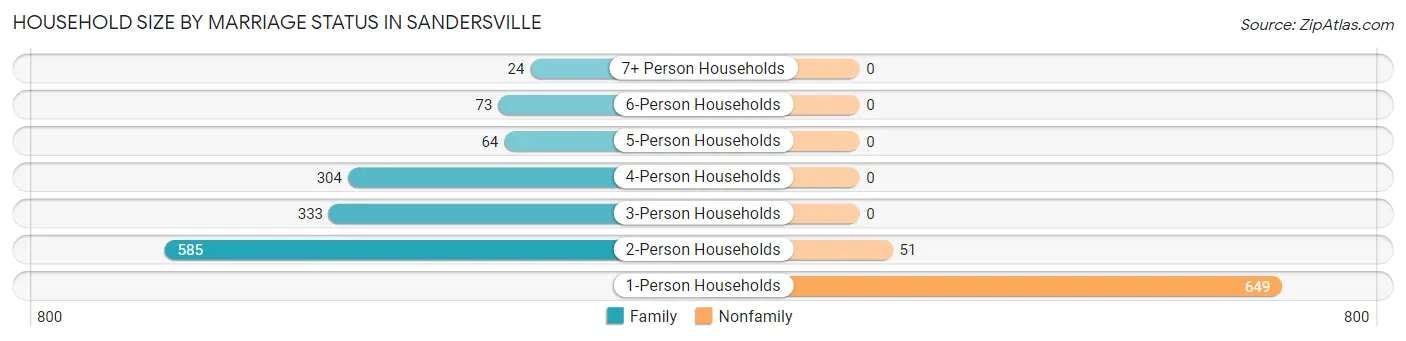
| Household Size | Family Households | Nonfamily Households |
| 1-Person Households | - | 649 (31.2%) |
| 2-Person Households | 585 (28.1%) | 51 (2.5%) |
| 3-Person Households | 333 (16.0%) | 0 (0.0%) |
| 4-Person Households | 304 (14.6%) | 0 (0.0%) |
| 5-Person Households | 64 (3.1%) | 0 (0.0%) |
| 6-Person Households | 73 (3.5%) | 0 (0.0%) |
| 7+ Person Households | 24 (1.1%) | 0 (0.0%) |
| Total | 1,383 (66.4%) | 700 (33.6%) |
Female Fertility in Sandersville
Fertility by Age in Sandersville
| Age Bracket | Women with Births | Births / 1,000 Women |
| 15 to 19 years | 0 (0.0%) | 0.0 |
| 20 to 34 years | 0 (0.0%) | 0.0 |
| 35 to 50 years | 0 (0.0%) | 0.0 |
| Total | 0 (0.0%) | 0.0 |
Fertility by Age by Marriage Status in Sandersville
| Age Bracket | Married | Unmarried |
| 15 to 19 years | 0 (0.0%) | 0 (0.0%) |
| 20 to 34 years | 0 (0.0%) | 0 (0.0%) |
| 35 to 50 years | 0 (0.0%) | 0 (0.0%) |
| Total | 0 (0.0%) | 0 (0.0%) |
Fertility by Education in Sandersville
| Educational Attainment | Women with Births | Births / 1,000 Women |
| Less than High School | 0 (0.0%) | 0.0 |
| High School Diploma | 0 (0.0%) | 0.0 |
| College or Associate's Degree | 0 (0.0%) | 0.0 |
| Bachelor's Degree | 0 (0.0%) | 0.0 |
| Graduate Degree | 0 (0.0%) | 0.0 |
| Total | 0 (0.0%) | 0.0 |
Fertility by Education by Marriage Status in Sandersville
| Educational Attainment | Married | Unmarried |
| Less than High School | 0 (0.0%) | 0 (0.0%) |
| High School Diploma | 0 (0.0%) | 0 (0.0%) |
| College or Associate's Degree | 0 (0.0%) | 0 (0.0%) |
| Bachelor's Degree | 0 (0.0%) | 0 (0.0%) |
| Graduate Degree | 0 (0.0%) | 0 (0.0%) |
| Total | 0 (0.0%) | 0 (0.0%) |
Employment Characteristics in Sandersville
Employment by Class of Employer in Sandersville
Among the 2,134 employed individuals in Sandersville, private company employees (1,224 | 57.4%), state government employees (364 | 17.1%), and local government employees (151 | 7.1%) make up the most common classes of employment.
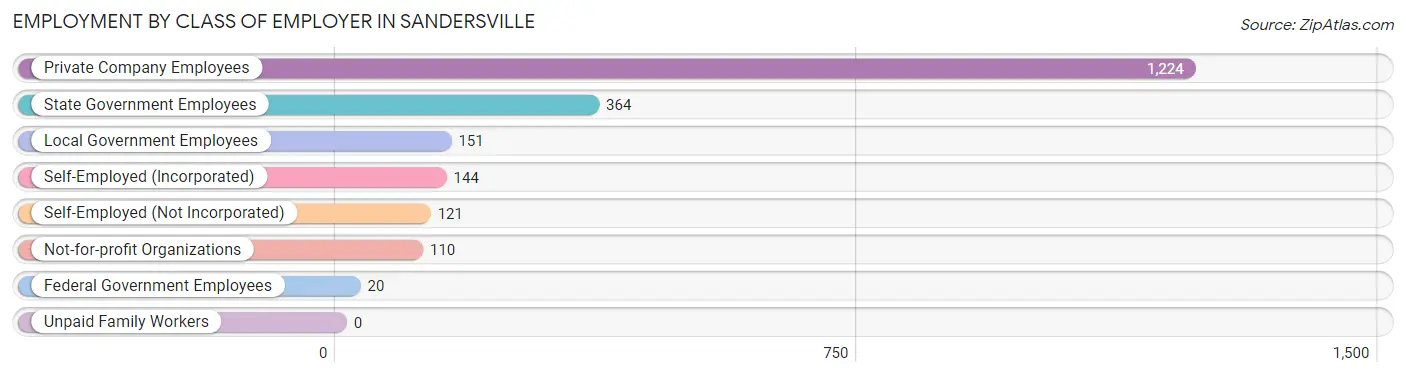
| Employer Class | # Employees | % Employees |
| Private Company Employees | 1,224 | 57.4% |
| Self-Employed (Incorporated) | 144 | 6.8% |
| Self-Employed (Not Incorporated) | 121 | 5.7% |
| Not-for-profit Organizations | 110 | 5.1% |
| Local Government Employees | 151 | 7.1% |
| State Government Employees | 364 | 17.1% |
| Federal Government Employees | 20 | 0.9% |
| Unpaid Family Workers | 0 | 0.0% |
| Total | 2,134 | 100.0% |
Employment Status by Age in Sandersville
According to the labor force statistics for Sandersville, out of the total population over 16 years of age (4,450), 52.9% or 2,354 individuals are in the labor force, with 7.9% or 186 of them unemployed. The age group with the highest labor force participation rate is 30 to 34 years, with 91.7% or 289 individuals in the labor force. Within the labor force, the 20 to 24 years age range has the highest percentage of unemployed individuals, with 34.8% or 72 of them being unemployed.
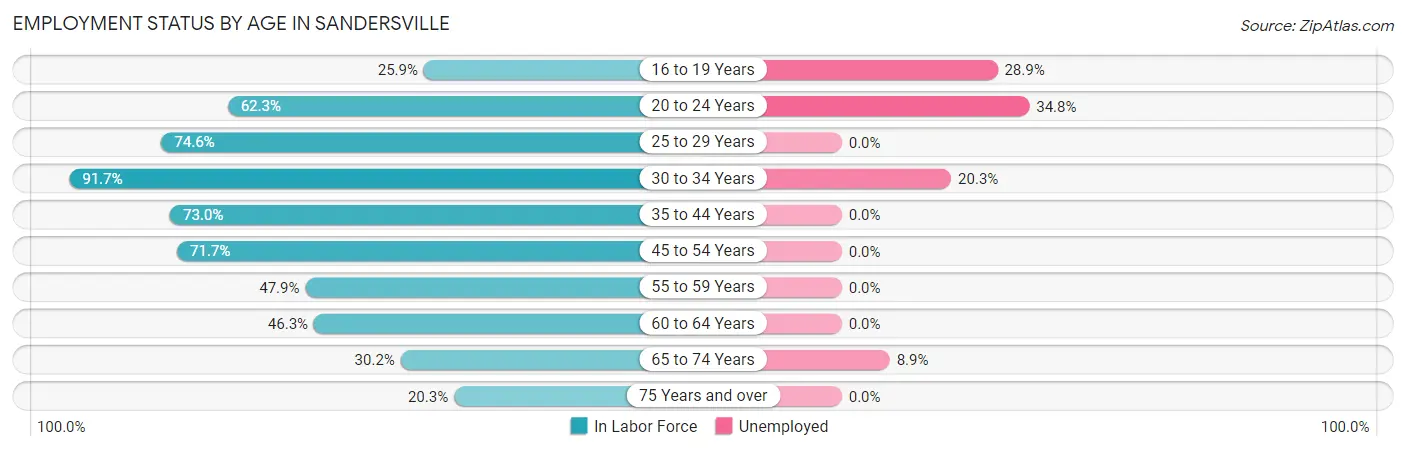
| Age Bracket | In Labor Force | Unemployed |
| 16 to 19 Years | 142 (25.9%) | 41 (28.9%) |
| 20 to 24 Years | 207 (62.3%) | 72 (34.8%) |
| 25 to 29 Years | 223 (74.6%) | 0 (0.0%) |
| 30 to 34 Years | 289 (91.7%) | 59 (20.3%) |
| 35 to 44 Years | 439 (73.0%) | 0 (0.0%) |
| 45 to 54 Years | 435 (71.7%) | 0 (0.0%) |
| 55 to 59 Years | 134 (47.9%) | 0 (0.0%) |
| 60 to 64 Years | 230 (46.3%) | 0 (0.0%) |
| 65 to 74 Years | 179 (30.2%) | 16 (8.9%) |
| 75 Years and over | 77 (20.3%) | 0 (0.0%) |
| Total | 2,354 (52.9%) | 186 (7.9%) |
Employment Status by Educational Attainment in Sandersville
According to labor force statistics for Sandersville, 67.3% of individuals (1,749) out of the total population between 25 and 64 years of age (2,599) are in the labor force, with 3.2% or 56 of them being unemployed. The group with the highest labor force participation rate are those with the educational attainment of bachelor's degree or higher, with 88.9% or 519 individuals in the labor force. Within the labor force, individuals with less than high school education have the highest percentage of unemployment, with 19.9% or 45 of them being unemployed.
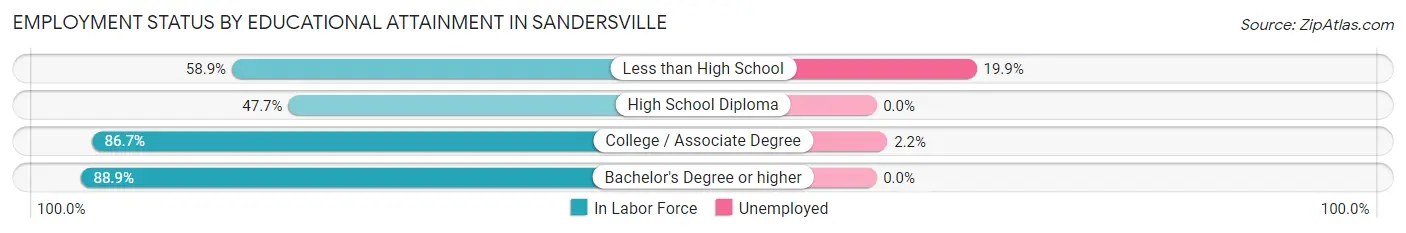
| Educational Attainment | In Labor Force | Unemployed |
| Less than High School | 226 (58.9%) | 76 (19.9%) |
| High School Diploma | 501 (47.7%) | 0 (0.0%) |
| College / Associate Degree | 504 (86.7%) | 13 (2.2%) |
| Bachelor's Degree or higher | 519 (88.9%) | 0 (0.0%) |
| Total | 1,749 (67.3%) | 83 (3.2%) |
Employment Occupations by Sex in Sandersville
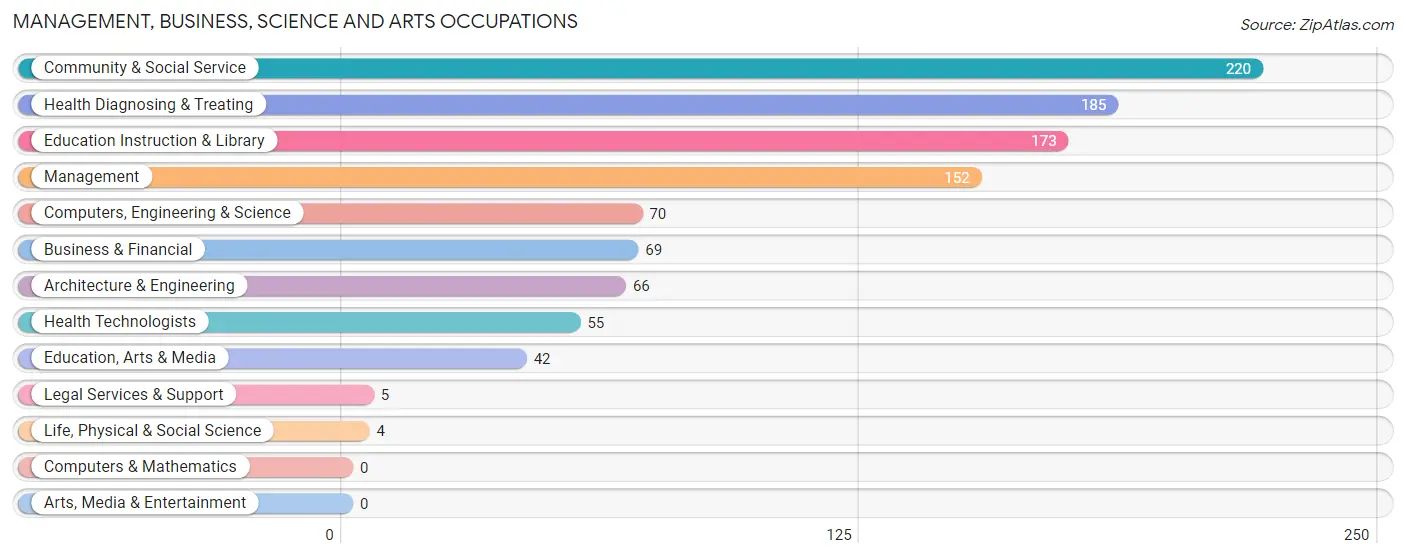
Management, Business, Science and Arts Occupations
The most common Management, Business, Science and Arts occupations in Sandersville are Community & Social Service (220 | 10.2%), Health Diagnosing & Treating (185 | 8.6%), Education Instruction & Library (173 | 8.0%), Management (152 | 7.0%), and Computers, Engineering & Science (70 | 3.3%).
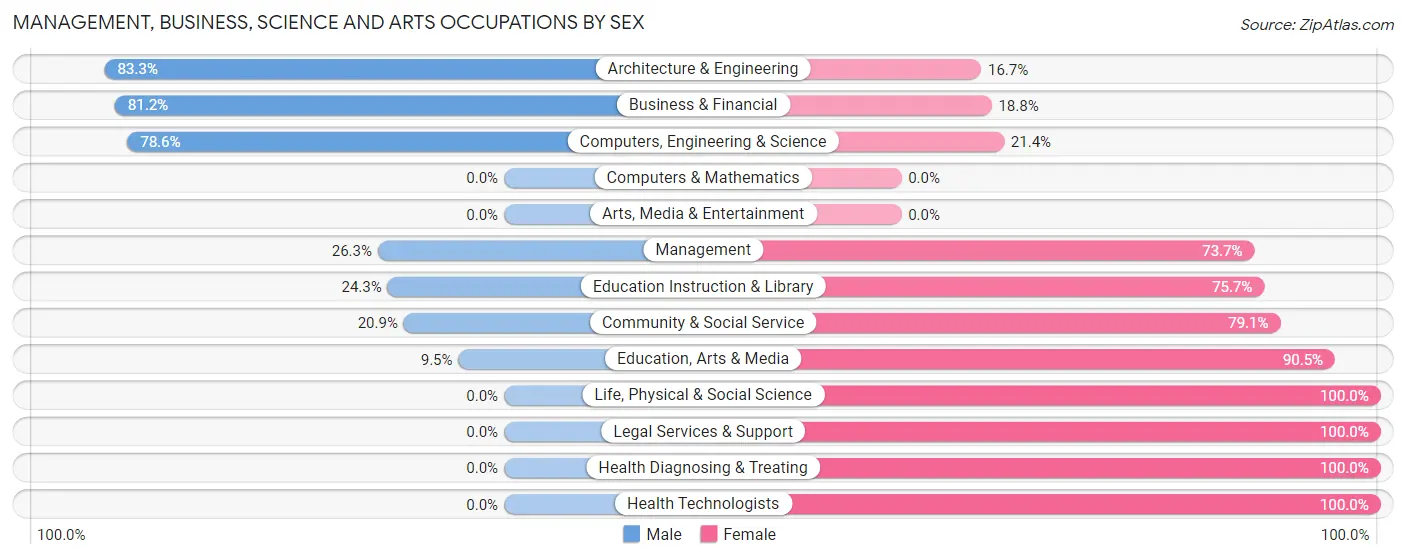
Management, Business, Science and Arts Occupations by Sex
Within the Management, Business, Science and Arts occupations in Sandersville, the most male-oriented occupations are Architecture & Engineering (83.3%), Business & Financial (81.2%), and Computers, Engineering & Science (78.6%), while the most female-oriented occupations are Life, Physical & Social Science (100.0%), Legal Services & Support (100.0%), and Health Diagnosing & Treating (100.0%).
| Occupation | Male | Female |
| Management | 40 (26.3%) | 112 (73.7%) |
| Business & Financial | 56 (81.2%) | 13 (18.8%) |
| Computers, Engineering & Science | 55 (78.6%) | 15 (21.4%) |
| Computers & Mathematics | 0 (0.0%) | 0 (0.0%) |
| Architecture & Engineering | 55 (83.3%) | 11 (16.7%) |
| Life, Physical & Social Science | 0 (0.0%) | 4 (100.0%) |
| Community & Social Service | 46 (20.9%) | 174 (79.1%) |
| Education, Arts & Media | 4 (9.5%) | 38 (90.5%) |
| Legal Services & Support | 0 (0.0%) | 5 (100.0%) |
| Education Instruction & Library | 42 (24.3%) | 131 (75.7%) |
| Arts, Media & Entertainment | 0 (0.0%) | 0 (0.0%) |
| Health Diagnosing & Treating | 0 (0.0%) | 185 (100.0%) |
| Health Technologists | 0 (0.0%) | 55 (100.0%) |
| Total (Category) | 197 (28.3%) | 499 (71.7%) |
| Total (Overall) | 673 (31.2%) | 1,484 (68.8%) |
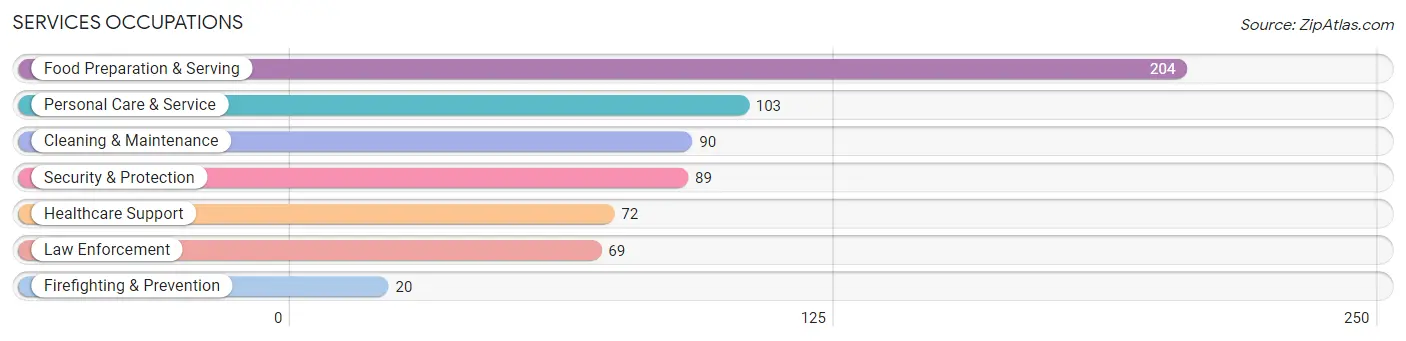
Services Occupations
The most common Services occupations in Sandersville are Food Preparation & Serving (204 | 9.5%), Personal Care & Service (103 | 4.8%), Cleaning & Maintenance (90 | 4.2%), Security & Protection (89 | 4.1%), and Healthcare Support (72 | 3.3%).
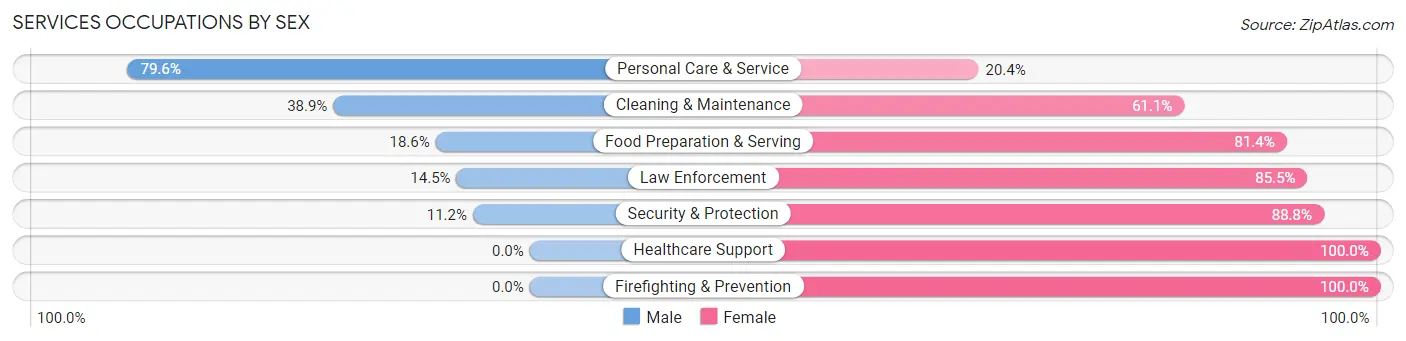
Services Occupations by Sex
Within the Services occupations in Sandersville, the most male-oriented occupations are Personal Care & Service (79.6%), Cleaning & Maintenance (38.9%), and Food Preparation & Serving (18.6%), while the most female-oriented occupations are Healthcare Support (100.0%), Firefighting & Prevention (100.0%), and Security & Protection (88.8%).
| Occupation | Male | Female |
| Healthcare Support | 0 (0.0%) | 72 (100.0%) |
| Security & Protection | 10 (11.2%) | 79 (88.8%) |
| Firefighting & Prevention | 0 (0.0%) | 20 (100.0%) |
| Law Enforcement | 10 (14.5%) | 59 (85.5%) |
| Food Preparation & Serving | 38 (18.6%) | 166 (81.4%) |
| Cleaning & Maintenance | 35 (38.9%) | 55 (61.1%) |
| Personal Care & Service | 82 (79.6%) | 21 (20.4%) |
| Total (Category) | 165 (29.6%) | 393 (70.4%) |
| Total (Overall) | 673 (31.2%) | 1,484 (68.8%) |
Sales and Office Occupations
The most common Sales and Office occupations in Sandersville are Office & Administration (353 | 16.4%), and Sales & Related (185 | 8.6%).
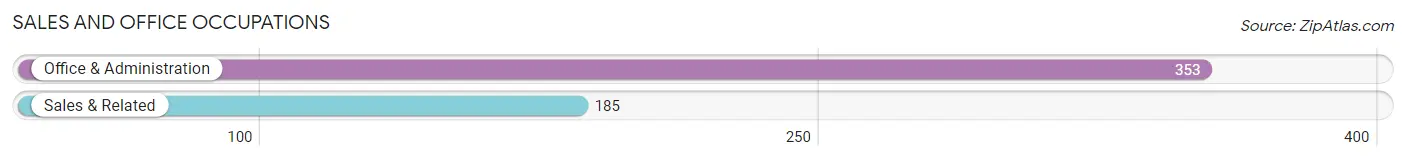
Sales and Office Occupations by Sex

| Occupation | Male | Female |
| Sales & Related | 42 (22.7%) | 143 (77.3%) |
| Office & Administration | 55 (15.6%) | 298 (84.4%) |
| Total (Category) | 97 (18.0%) | 441 (82.0%) |
| Total (Overall) | 673 (31.2%) | 1,484 (68.8%) |
Natural Resources, Construction and Maintenance Occupations
The most common Natural Resources, Construction and Maintenance occupations in Sandersville are Installation, Maintenance & Repair (58 | 2.7%), Construction & Extraction (42 | 1.9%), and Farming, Fishing & Forestry (14 | 0.6%).
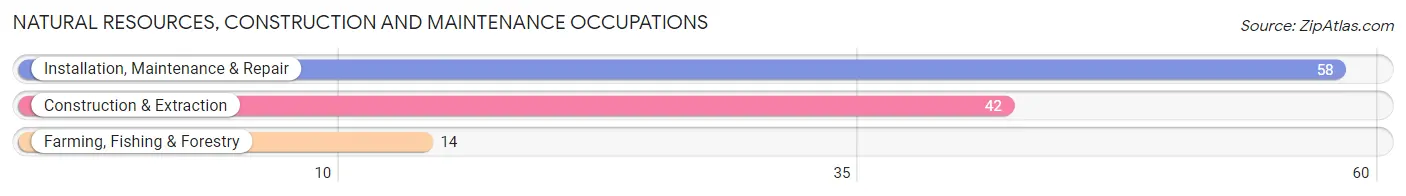
Natural Resources, Construction and Maintenance Occupations by Sex

| Occupation | Male | Female |
| Farming, Fishing & Forestry | 0 (0.0%) | 14 (100.0%) |
| Construction & Extraction | 25 (59.5%) | 17 (40.5%) |
| Installation, Maintenance & Repair | 51 (87.9%) | 7 (12.1%) |
| Total (Category) | 76 (66.7%) | 38 (33.3%) |
| Total (Overall) | 673 (31.2%) | 1,484 (68.8%) |
Production, Transportation and Moving Occupations
The most common Production, Transportation and Moving occupations in Sandersville are Production (114 | 5.3%), Material Moving (84 | 3.9%), and Transportation (53 | 2.5%).
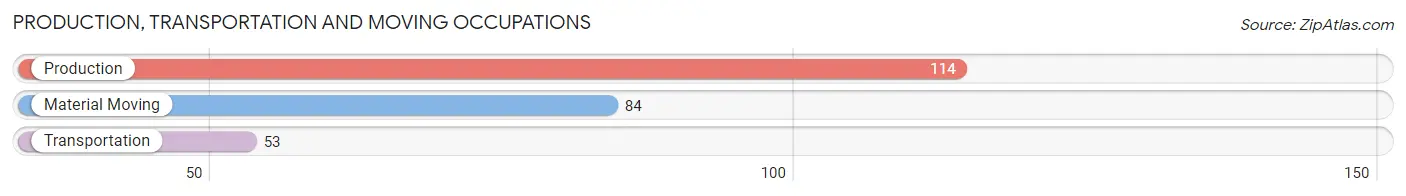
Production, Transportation and Moving Occupations by Sex
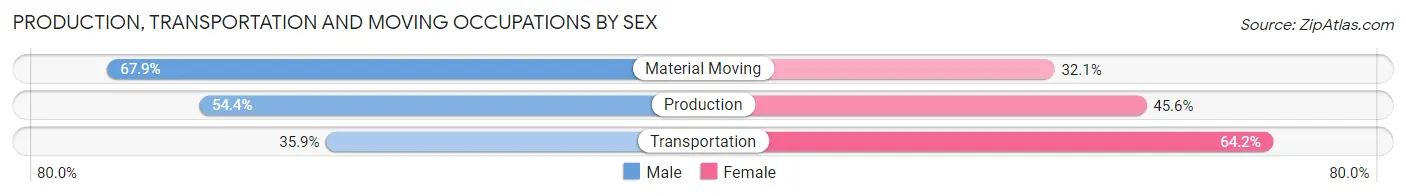
| Occupation | Male | Female |
| Production | 62 (54.4%) | 52 (45.6%) |
| Transportation | 19 (35.8%) | 34 (64.1%) |
| Material Moving | 57 (67.9%) | 27 (32.1%) |
| Total (Category) | 138 (55.0%) | 113 (45.0%) |
| Total (Overall) | 673 (31.2%) | 1,484 (68.8%) |
Employment Industries by Sex in Sandersville
Employment Industries in Sandersville
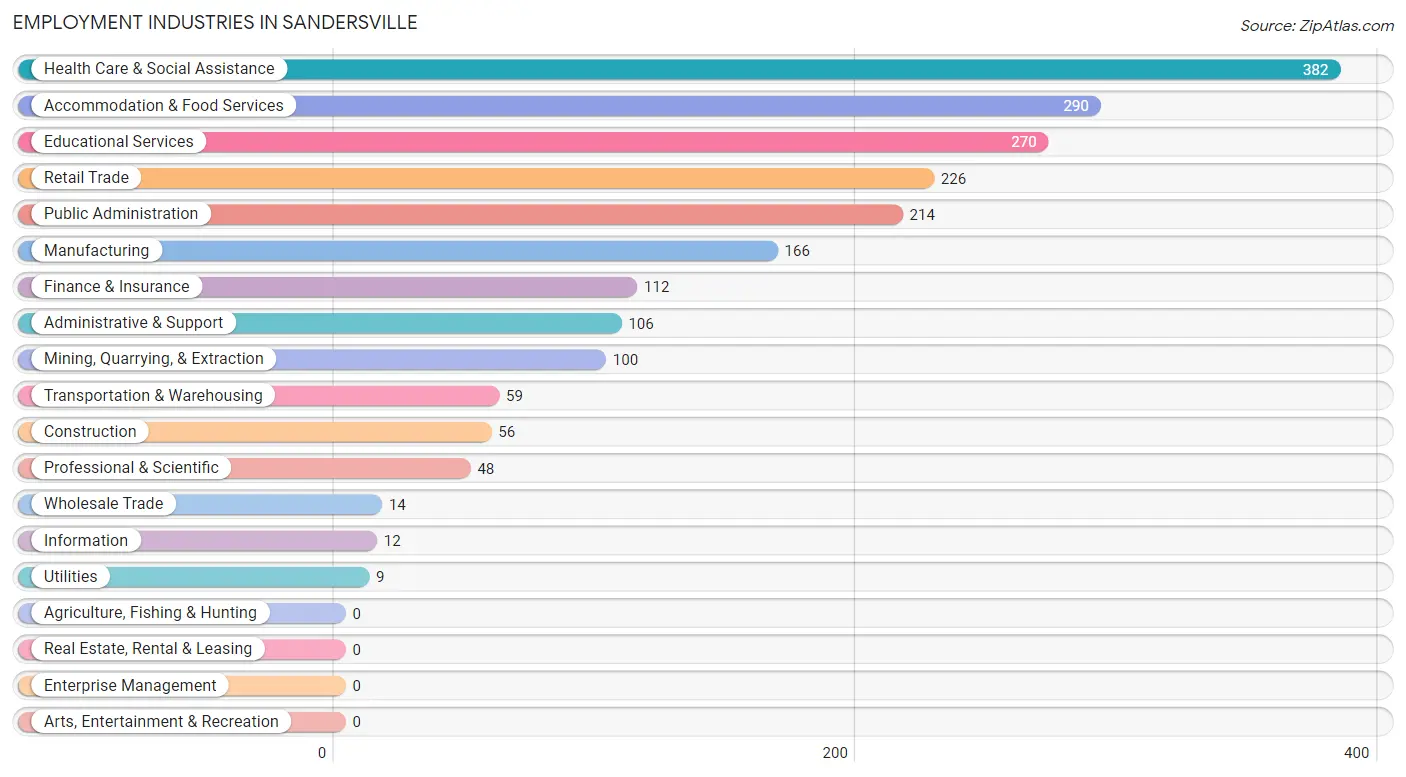
The major employment industries in Sandersville include Health Care & Social Assistance (382 | 17.7%), Accommodation & Food Services (290 | 13.4%), Educational Services (270 | 12.5%), Retail Trade (226 | 10.5%), and Public Administration (214 | 9.9%).
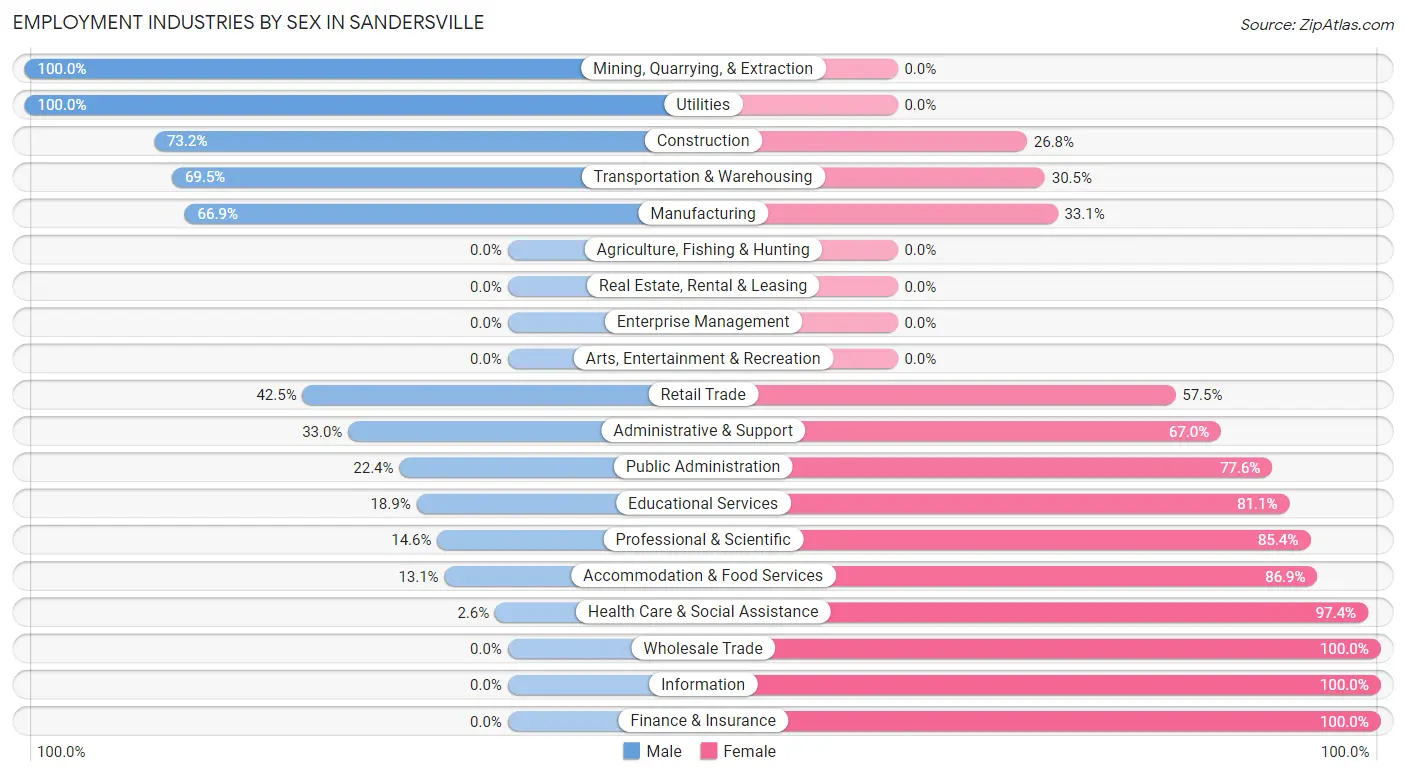
Employment Industries by Sex in Sandersville
The Sandersville industries that see more men than women are Mining, Quarrying, & Extraction (100.0%), Utilities (100.0%), and Construction (73.2%), whereas the industries that tend to have a higher number of women are Wholesale Trade (100.0%), Information (100.0%), and Finance & Insurance (100.0%).
| Industry | Male | Female |
| Agriculture, Fishing & Hunting | 0 (0.0%) | 0 (0.0%) |
| Mining, Quarrying, & Extraction | 100 (100.0%) | 0 (0.0%) |
| Construction | 41 (73.2%) | 15 (26.8%) |
| Manufacturing | 111 (66.9%) | 55 (33.1%) |
| Wholesale Trade | 0 (0.0%) | 14 (100.0%) |
| Retail Trade | 96 (42.5%) | 130 (57.5%) |
| Transportation & Warehousing | 41 (69.5%) | 18 (30.5%) |
| Utilities | 9 (100.0%) | 0 (0.0%) |
| Information | 0 (0.0%) | 12 (100.0%) |
| Finance & Insurance | 0 (0.0%) | 112 (100.0%) |
| Real Estate, Rental & Leasing | 0 (0.0%) | 0 (0.0%) |
| Professional & Scientific | 7 (14.6%) | 41 (85.4%) |
| Enterprise Management | 0 (0.0%) | 0 (0.0%) |
| Administrative & Support | 35 (33.0%) | 71 (67.0%) |
| Educational Services | 51 (18.9%) | 219 (81.1%) |
| Health Care & Social Assistance | 10 (2.6%) | 372 (97.4%) |
| Arts, Entertainment & Recreation | 0 (0.0%) | 0 (0.0%) |
| Accommodation & Food Services | 38 (13.1%) | 252 (86.9%) |
| Public Administration | 48 (22.4%) | 166 (77.6%) |
| Total | 673 (31.2%) | 1,484 (68.8%) |
Education in Sandersville
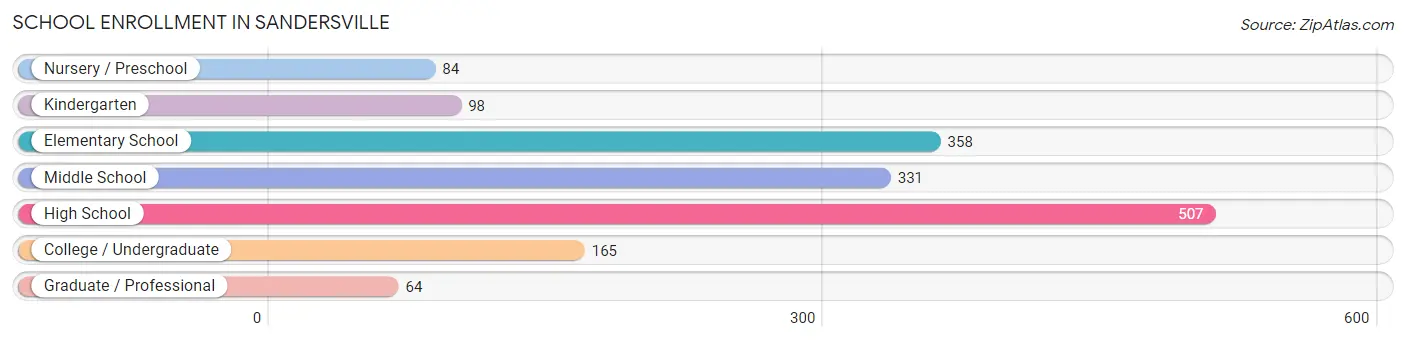
School Enrollment in Sandersville
The most common levels of schooling among the 1,607 students in Sandersville are high school (507 | 31.6%), elementary school (358 | 22.3%), and middle school (331 | 20.6%).
| School Level | # Students | % Students |
| Nursery / Preschool | 84 | 5.2% |
| Kindergarten | 98 | 6.1% |
| Elementary School | 358 | 22.3% |
| Middle School | 331 | 20.6% |
| High School | 507 | 31.6% |
| College / Undergraduate | 165 | 10.3% |
| Graduate / Professional | 64 | 4.0% |
| Total | 1,607 | 100.0% |
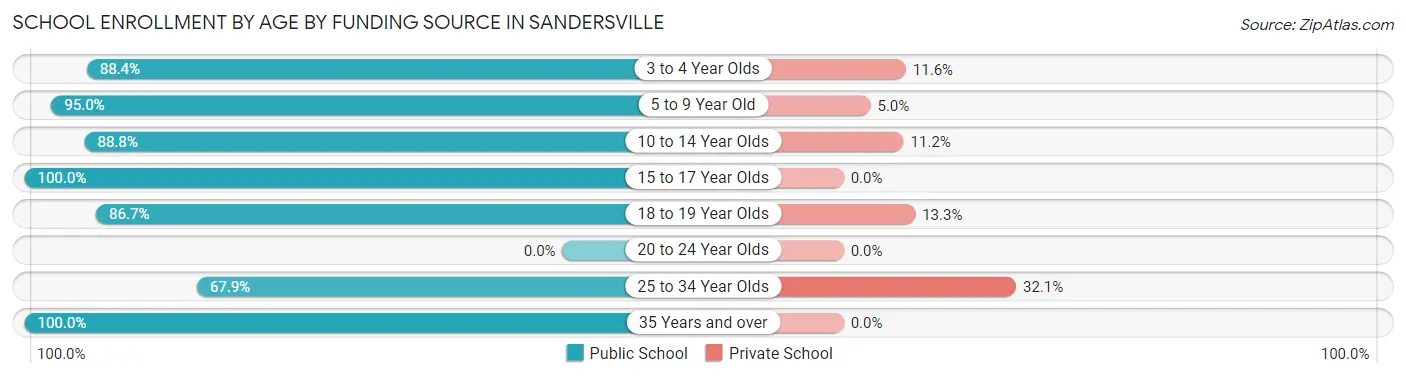
School Enrollment by Age by Funding Source in Sandersville
Out of a total of 1,607 students who are enrolled in schools in Sandersville, 129 (8.0%) attend a private institution, while the remaining 1,478 (92.0%) are enrolled in public schools. The age group of 25 to 34 year olds has the highest likelihood of being enrolled in private schools, with 35 (32.1% in the age bracket) enrolled. Conversely, the age group of 15 to 17 year olds has the lowest likelihood of being enrolled in a private school, with 369 (100.0% in the age bracket) attending a public institution.
| Age Bracket | Public School | Private School |
| 3 to 4 Year Olds | 61 (88.4%) | 8 (11.6%) |
| 5 to 9 Year Old | 437 (95.0%) | 23 (5.0%) |
| 10 to 14 Year Olds | 334 (88.8%) | 42 (11.2%) |
| 15 to 17 Year Olds | 369 (100.0%) | 0 (0.0%) |
| 18 to 19 Year Olds | 130 (86.7%) | 20 (13.3%) |
| 20 to 24 Year Olds | 0 (0.0%) | 0 (0.0%) |
| 25 to 34 Year Olds | 74 (67.9%) | 35 (32.1%) |
| 35 Years and over | 74 (100.0%) | 0 (0.0%) |
| Total | 1,478 (92.0%) | 129 (8.0%) |
Educational Attainment by Field of Study in Sandersville
Business (189 | 25.1%), science & technology (145 | 19.3%), education (128 | 17.0%), bio, nature & agricultural (64 | 8.5%), and arts & humanities (61 | 8.1%) are the most common fields of study among 753 individuals in Sandersville who have obtained a bachelor's degree or higher.
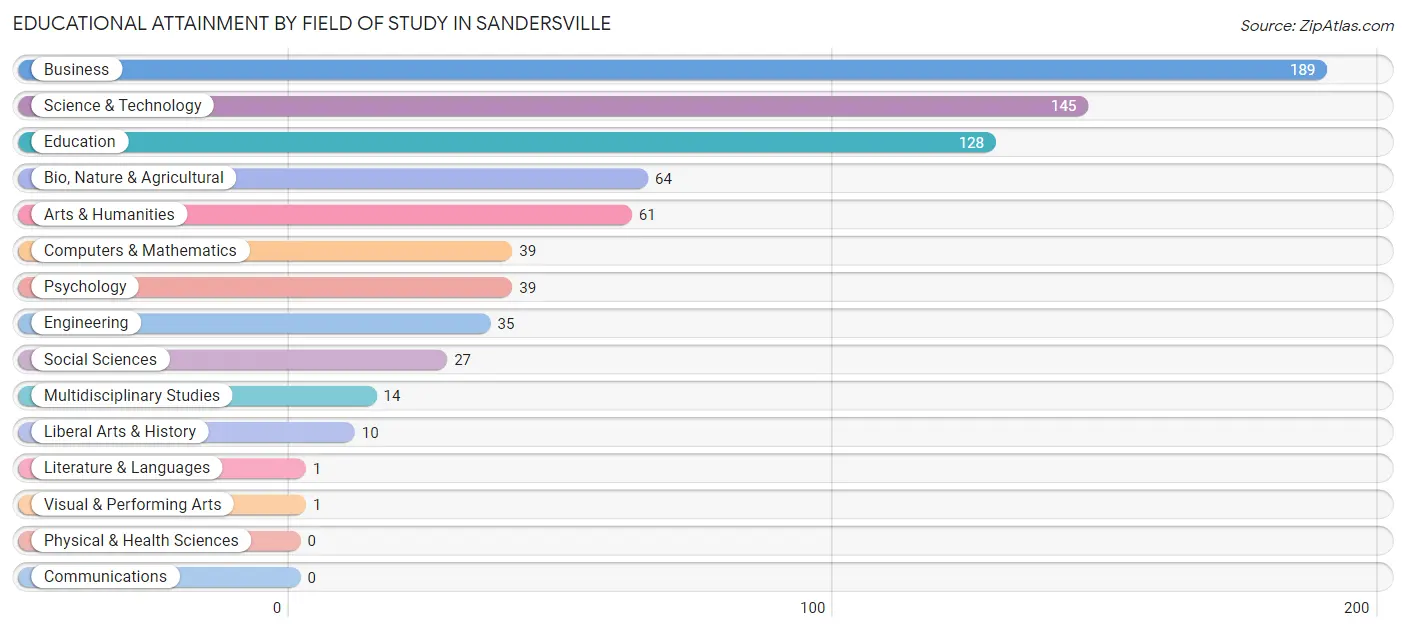
| Field of Study | # Graduates | % Graduates |
| Computers & Mathematics | 39 | 5.2% |
| Bio, Nature & Agricultural | 64 | 8.5% |
| Physical & Health Sciences | 0 | 0.0% |
| Psychology | 39 | 5.2% |
| Social Sciences | 27 | 3.6% |
| Engineering | 35 | 4.6% |
| Multidisciplinary Studies | 14 | 1.9% |
| Science & Technology | 145 | 19.3% |
| Business | 189 | 25.1% |
| Education | 128 | 17.0% |
| Literature & Languages | 1 | 0.1% |
| Liberal Arts & History | 10 | 1.3% |
| Visual & Performing Arts | 1 | 0.1% |
| Communications | 0 | 0.0% |
| Arts & Humanities | 61 | 8.1% |
| Total | 753 | 100.0% |
Transportation & Commute in Sandersville
Vehicle Availability by Sex in Sandersville
The most prevalent vehicle ownership categories in Sandersville are males with 2 vehicles (277, accounting for 41.6%) and females with 2 vehicles (315, making up 18.9%).
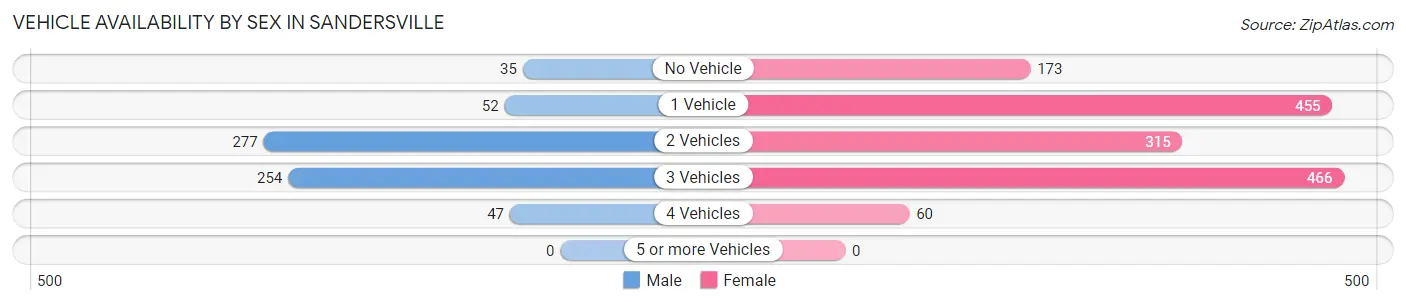
| Vehicles Available | Male | Female |
| No Vehicle | 35 (5.3%) | 173 (11.8%) |
| 1 Vehicle | 52 (7.8%) | 455 (31.0%) |
| 2 Vehicles | 277 (41.6%) | 315 (21.4%) |
| 3 Vehicles | 254 (38.2%) | 466 (31.7%) |
| 4 Vehicles | 47 (7.1%) | 60 (4.1%) |
| 5 or more Vehicles | 0 (0.0%) | 0 (0.0%) |
| Total | 665 (100.0%) | 1,469 (100.0%) |
Commute Time in Sandersville
The most frequently occuring commute durations in Sandersville are 5 to 9 minutes (616 commuters, 29.1%), 10 to 14 minutes (356 commuters, 16.8%), and 15 to 19 minutes (315 commuters, 14.9%).
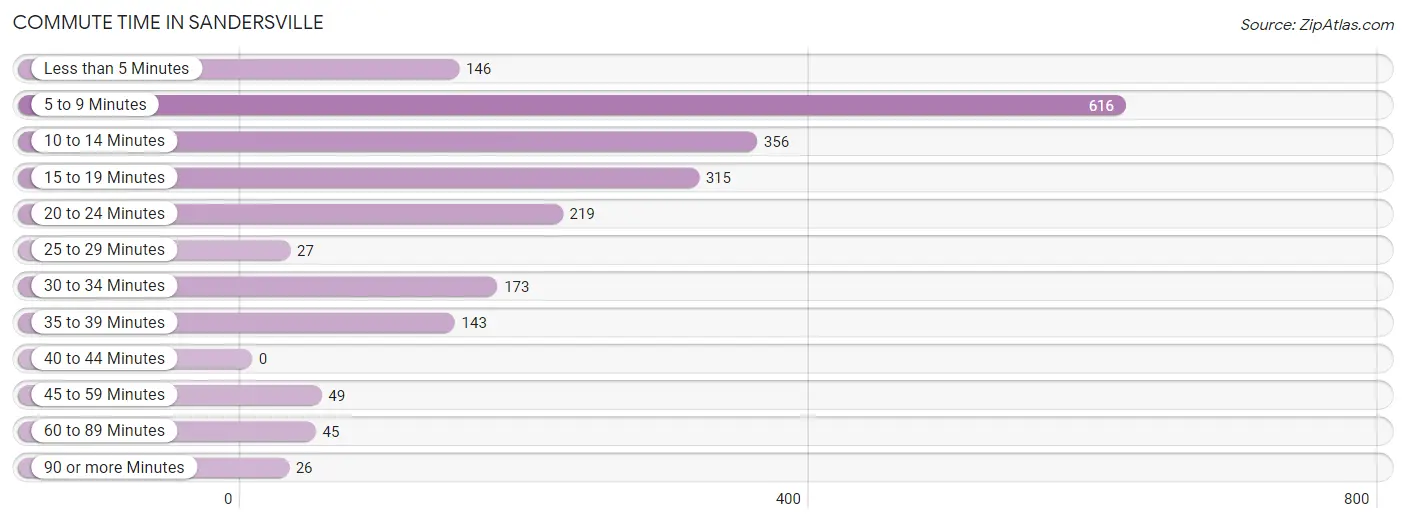
| Commute Time | # Commuters | % Commuters |
| Less than 5 Minutes | 146 | 6.9% |
| 5 to 9 Minutes | 616 | 29.1% |
| 10 to 14 Minutes | 356 | 16.8% |
| 15 to 19 Minutes | 315 | 14.9% |
| 20 to 24 Minutes | 219 | 10.3% |
| 25 to 29 Minutes | 27 | 1.3% |
| 30 to 34 Minutes | 173 | 8.2% |
| 35 to 39 Minutes | 143 | 6.8% |
| 40 to 44 Minutes | 0 | 0.0% |
| 45 to 59 Minutes | 49 | 2.3% |
| 60 to 89 Minutes | 45 | 2.1% |
| 90 or more Minutes | 26 | 1.2% |
Commute Time by Sex in Sandersville
The most common commute times in Sandersville are 5 to 9 minutes (243 commuters, 37.1%) for males and 5 to 9 minutes (373 commuters, 25.6%) for females.
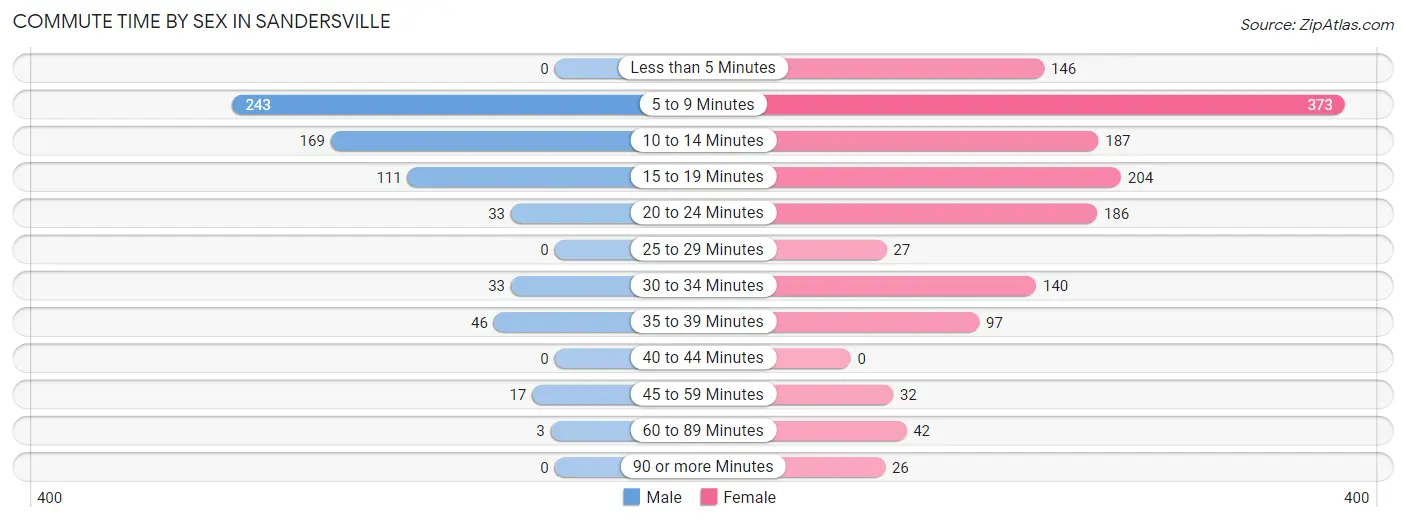
| Commute Time | Male | Female |
| Less than 5 Minutes | 0 (0.0%) | 146 (10.0%) |
| 5 to 9 Minutes | 243 (37.1%) | 373 (25.6%) |
| 10 to 14 Minutes | 169 (25.8%) | 187 (12.8%) |
| 15 to 19 Minutes | 111 (17.0%) | 204 (14.0%) |
| 20 to 24 Minutes | 33 (5.0%) | 186 (12.7%) |
| 25 to 29 Minutes | 0 (0.0%) | 27 (1.8%) |
| 30 to 34 Minutes | 33 (5.0%) | 140 (9.6%) |
| 35 to 39 Minutes | 46 (7.0%) | 97 (6.6%) |
| 40 to 44 Minutes | 0 (0.0%) | 0 (0.0%) |
| 45 to 59 Minutes | 17 (2.6%) | 32 (2.2%) |
| 60 to 89 Minutes | 3 (0.5%) | 42 (2.9%) |
| 90 or more Minutes | 0 (0.0%) | 26 (1.8%) |
Time of Departure to Work by Sex in Sandersville
The most frequent times of departure to work in Sandersville are 7:30 AM to 7:59 AM (182, 27.8%) for males and 7:30 AM to 7:59 AM (301, 20.6%) for females.
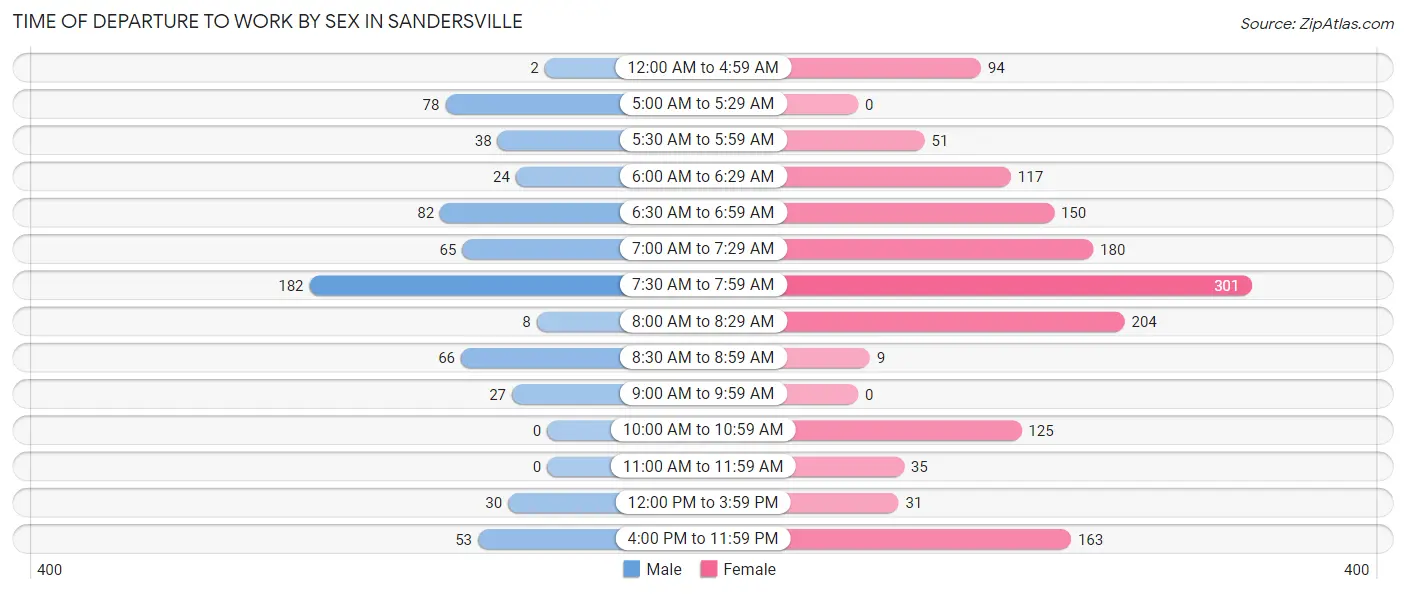
| Time of Departure | Male | Female |
| 12:00 AM to 4:59 AM | 2 (0.3%) | 94 (6.4%) |
| 5:00 AM to 5:29 AM | 78 (11.9%) | 0 (0.0%) |
| 5:30 AM to 5:59 AM | 38 (5.8%) | 51 (3.5%) |
| 6:00 AM to 6:29 AM | 24 (3.7%) | 117 (8.0%) |
| 6:30 AM to 6:59 AM | 82 (12.5%) | 150 (10.3%) |
| 7:00 AM to 7:29 AM | 65 (9.9%) | 180 (12.3%) |
| 7:30 AM to 7:59 AM | 182 (27.8%) | 301 (20.6%) |
| 8:00 AM to 8:29 AM | 8 (1.2%) | 204 (14.0%) |
| 8:30 AM to 8:59 AM | 66 (10.1%) | 9 (0.6%) |
| 9:00 AM to 9:59 AM | 27 (4.1%) | 0 (0.0%) |
| 10:00 AM to 10:59 AM | 0 (0.0%) | 125 (8.6%) |
| 11:00 AM to 11:59 AM | 0 (0.0%) | 35 (2.4%) |
| 12:00 PM to 3:59 PM | 30 (4.6%) | 31 (2.1%) |
| 4:00 PM to 11:59 PM | 53 (8.1%) | 163 (11.2%) |
| Total | 655 (100.0%) | 1,460 (100.0%) |
Housing Occupancy in Sandersville
Occupancy by Ownership in Sandersville
Of the total 2,083 dwellings in Sandersville, owner-occupied units account for 1,130 (54.2%), while renter-occupied units make up 953 (45.8%).
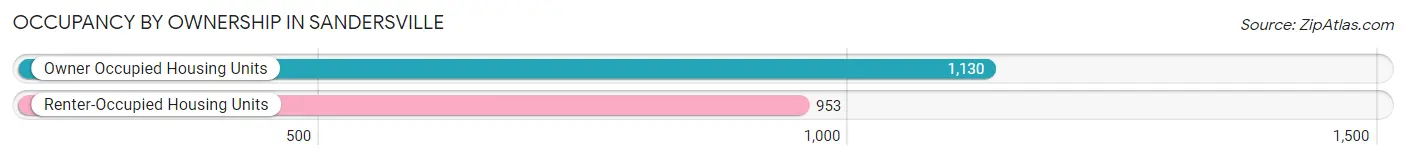
| Occupancy | # Housing Units | % Housing Units |
| Owner Occupied Housing Units | 1,130 | 54.2% |
| Renter-Occupied Housing Units | 953 | 45.8% |
| Total Occupied Housing Units | 2,083 | 100.0% |
Occupancy by Household Size in Sandersville
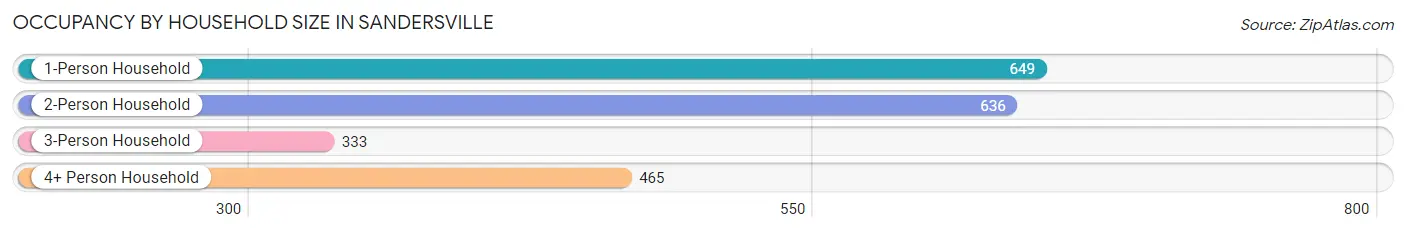
| Household Size | # Housing Units | % Housing Units |
| 1-Person Household | 649 | 31.2% |
| 2-Person Household | 636 | 30.5% |
| 3-Person Household | 333 | 16.0% |
| 4+ Person Household | 465 | 22.3% |
| Total Housing Units | 2,083 | 100.0% |
Occupancy by Ownership by Household Size in Sandersville
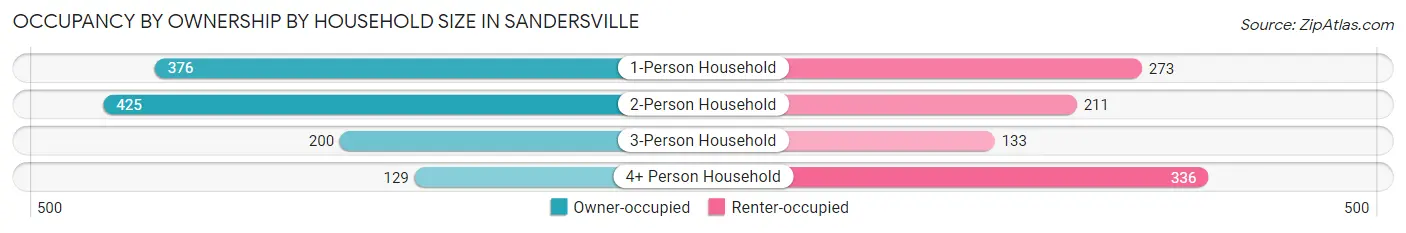
| Household Size | Owner-occupied | Renter-occupied |
| 1-Person Household | 376 (57.9%) | 273 (42.1%) |
| 2-Person Household | 425 (66.8%) | 211 (33.2%) |
| 3-Person Household | 200 (60.1%) | 133 (39.9%) |
| 4+ Person Household | 129 (27.7%) | 336 (72.3%) |
| Total Housing Units | 1,130 (54.2%) | 953 (45.8%) |
Occupancy by Educational Attainment in Sandersville
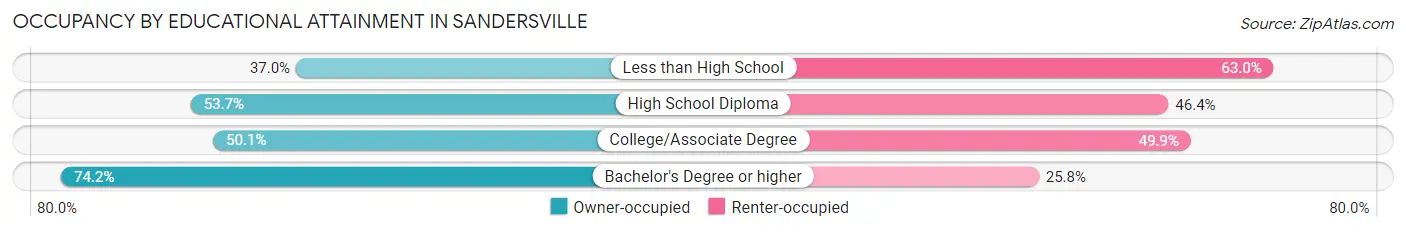
| Household Size | Owner-occupied | Renter-occupied |
| Less than High School | 119 (37.0%) | 203 (63.0%) |
| High School Diploma | 448 (53.6%) | 387 (46.4%) |
| College/Associate Degree | 258 (50.1%) | 257 (49.9%) |
| Bachelor's Degree or higher | 305 (74.2%) | 106 (25.8%) |
Occupancy by Age of Householder in Sandersville
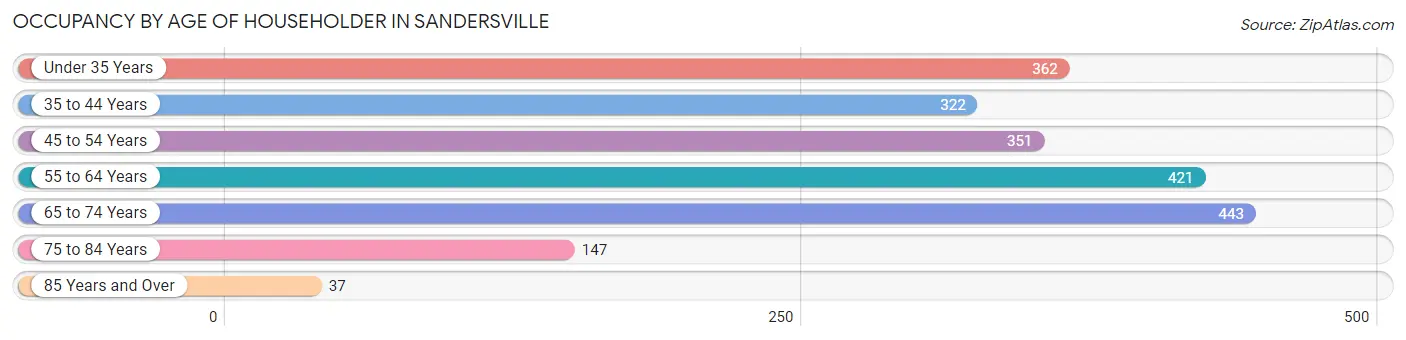
| Age Bracket | # Households | % Households |
| Under 35 Years | 362 | 17.4% |
| 35 to 44 Years | 322 | 15.5% |
| 45 to 54 Years | 351 | 16.9% |
| 55 to 64 Years | 421 | 20.2% |
| 65 to 74 Years | 443 | 21.3% |
| 75 to 84 Years | 147 | 7.1% |
| 85 Years and Over | 37 | 1.8% |
| Total | 2,083 | 100.0% |
Housing Finances in Sandersville
Median Income by Occupancy in Sandersville
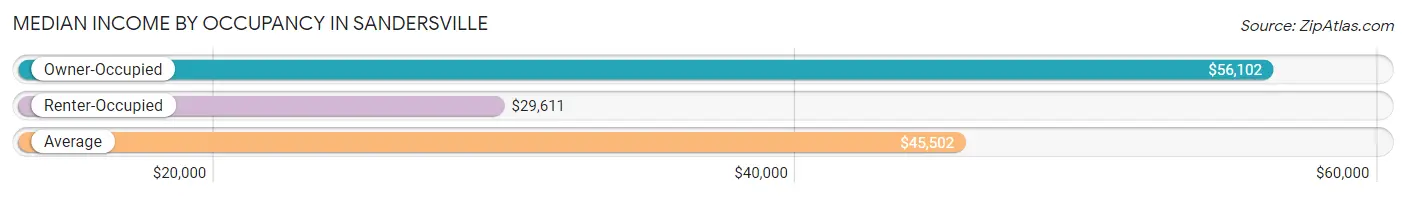
| Occupancy Type | # Households | Median Income |
| Owner-Occupied | 1,130 (54.2%) | $56,102 |
| Renter-Occupied | 953 (45.8%) | $29,611 |
| Average | 2,083 (100.0%) | $45,502 |
Occupancy by Householder Income Bracket in Sandersville
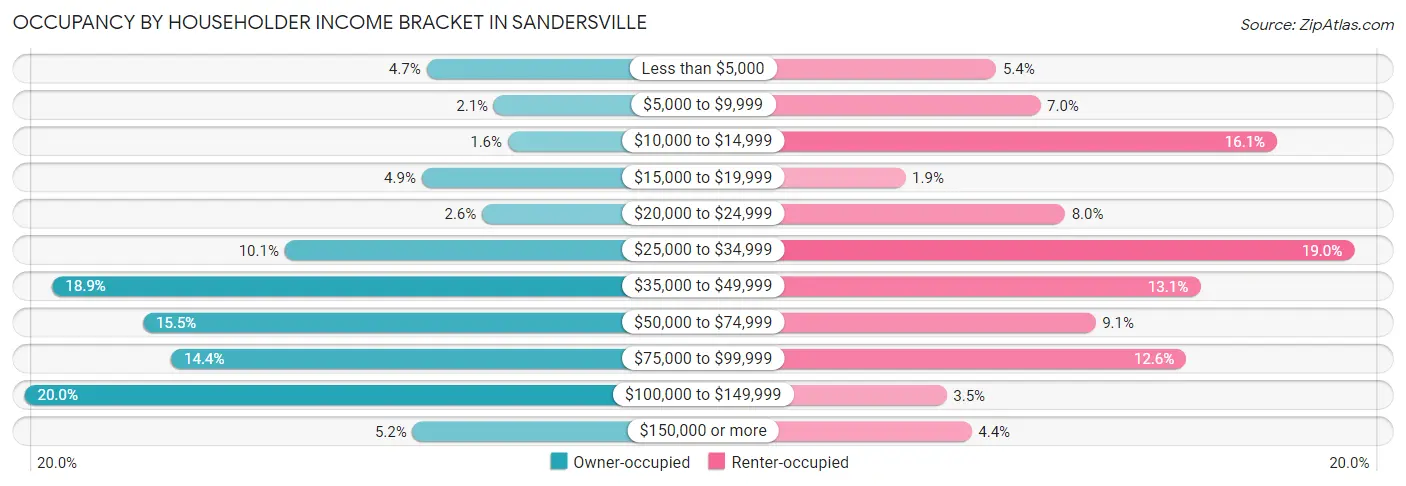
| Income Bracket | Owner-occupied | Renter-occupied |
| Less than $5,000 | 53 (4.7%) | 51 (5.3%) |
| $5,000 to $9,999 | 24 (2.1%) | 67 (7.0%) |
| $10,000 to $14,999 | 18 (1.6%) | 153 (16.1%) |
| $15,000 to $19,999 | 55 (4.9%) | 18 (1.9%) |
| $20,000 to $24,999 | 29 (2.6%) | 76 (8.0%) |
| $25,000 to $34,999 | 114 (10.1%) | 181 (19.0%) |
| $35,000 to $49,999 | 214 (18.9%) | 125 (13.1%) |
| $50,000 to $74,999 | 175 (15.5%) | 87 (9.1%) |
| $75,000 to $99,999 | 163 (14.4%) | 120 (12.6%) |
| $100,000 to $149,999 | 226 (20.0%) | 33 (3.5%) |
| $150,000 or more | 59 (5.2%) | 42 (4.4%) |
| Total | 1,130 (100.0%) | 953 (100.0%) |
Monthly Housing Cost Tiers in Sandersville
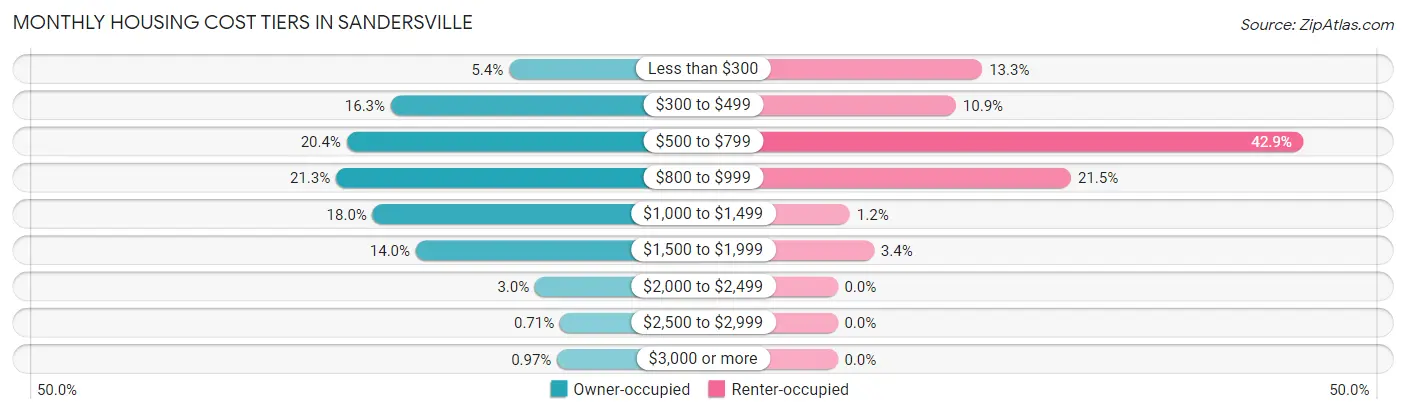
| Monthly Cost | Owner-occupied | Renter-occupied |
| Less than $300 | 61 (5.4%) | 127 (13.3%) |
| $300 to $499 | 184 (16.3%) | 104 (10.9%) |
| $500 to $799 | 230 (20.3%) | 409 (42.9%) |
| $800 to $999 | 241 (21.3%) | 205 (21.5%) |
| $1,000 to $1,499 | 203 (18.0%) | 11 (1.1%) |
| $1,500 to $1,999 | 158 (14.0%) | 32 (3.4%) |
| $2,000 to $2,499 | 34 (3.0%) | 0 (0.0%) |
| $2,500 to $2,999 | 8 (0.7%) | 0 (0.0%) |
| $3,000 or more | 11 (1.0%) | 0 (0.0%) |
| Total | 1,130 (100.0%) | 953 (100.0%) |
Physical Housing Characteristics in Sandersville
Housing Structures in Sandersville
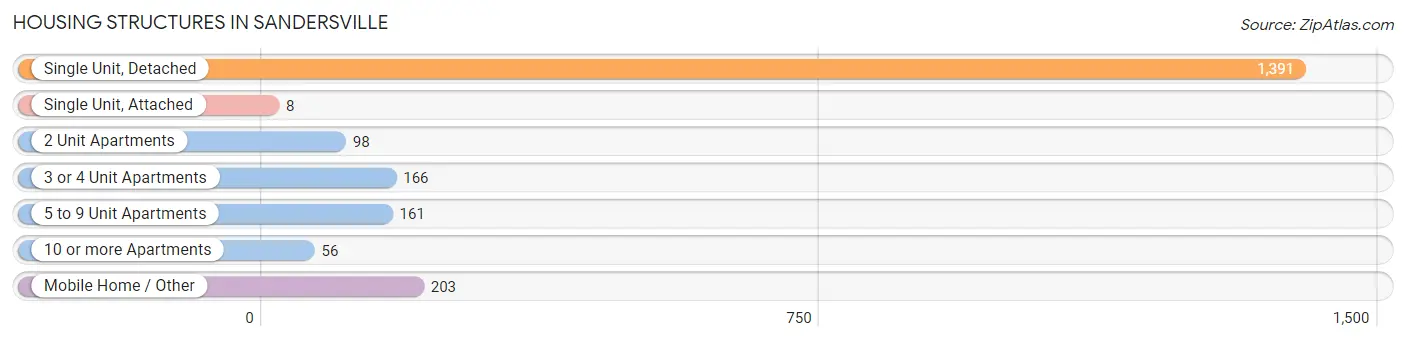
| Structure Type | # Housing Units | % Housing Units |
| Single Unit, Detached | 1,391 | 66.8% |
| Single Unit, Attached | 8 | 0.4% |
| 2 Unit Apartments | 98 | 4.7% |
| 3 or 4 Unit Apartments | 166 | 8.0% |
| 5 to 9 Unit Apartments | 161 | 7.7% |
| 10 or more Apartments | 56 | 2.7% |
| Mobile Home / Other | 203 | 9.8% |
| Total | 2,083 | 100.0% |
Housing Structures by Occupancy in Sandersville
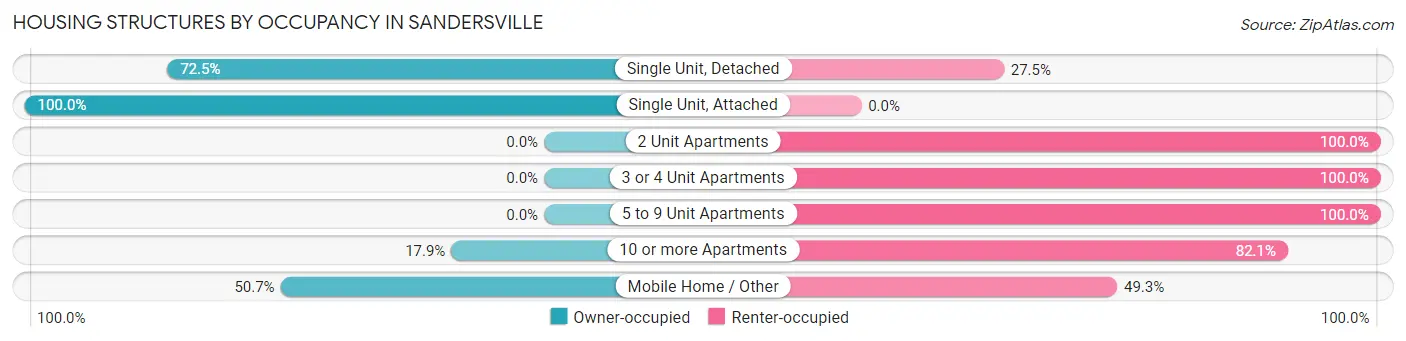
| Structure Type | Owner-occupied | Renter-occupied |
| Single Unit, Detached | 1,009 (72.5%) | 382 (27.5%) |
| Single Unit, Attached | 8 (100.0%) | 0 (0.0%) |
| 2 Unit Apartments | 0 (0.0%) | 98 (100.0%) |
| 3 or 4 Unit Apartments | 0 (0.0%) | 166 (100.0%) |
| 5 to 9 Unit Apartments | 0 (0.0%) | 161 (100.0%) |
| 10 or more Apartments | 10 (17.9%) | 46 (82.1%) |
| Mobile Home / Other | 103 (50.7%) | 100 (49.3%) |
| Total | 1,130 (54.2%) | 953 (45.8%) |
Housing Structures by Number of Rooms in Sandersville
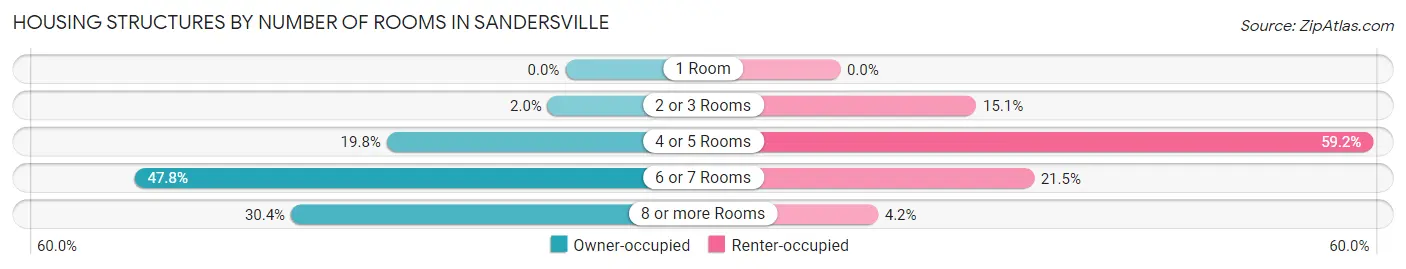
| Number of Rooms | Owner-occupied | Renter-occupied |
| 1 Room | 0 (0.0%) | 0 (0.0%) |
| 2 or 3 Rooms | 22 (1.9%) | 144 (15.1%) |
| 4 or 5 Rooms | 224 (19.8%) | 564 (59.2%) |
| 6 or 7 Rooms | 540 (47.8%) | 205 (21.5%) |
| 8 or more Rooms | 344 (30.4%) | 40 (4.2%) |
| Total | 1,130 (100.0%) | 953 (100.0%) |
Housing Structure by Heating Type in Sandersville
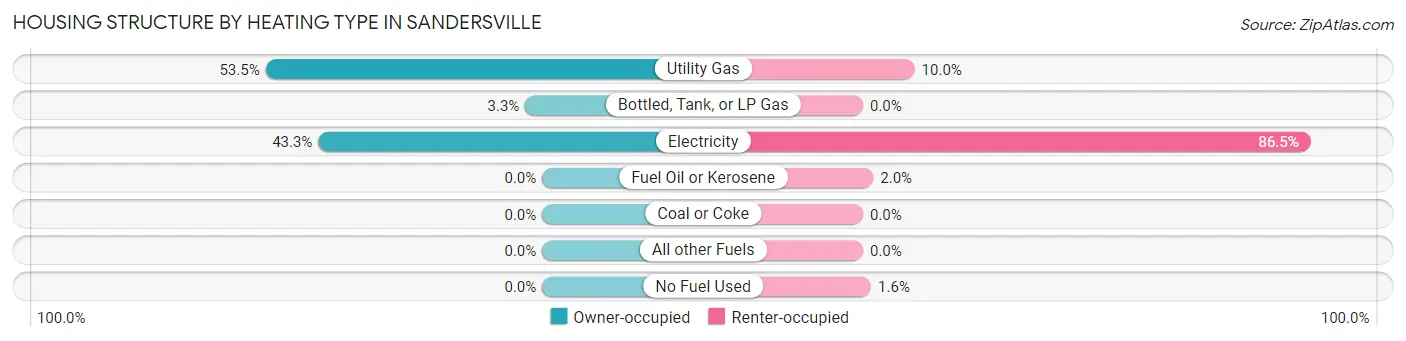
| Heating Type | Owner-occupied | Renter-occupied |
| Utility Gas | 604 (53.4%) | 95 (10.0%) |
| Bottled, Tank, or LP Gas | 37 (3.3%) | 0 (0.0%) |
| Electricity | 489 (43.3%) | 824 (86.5%) |
| Fuel Oil or Kerosene | 0 (0.0%) | 19 (2.0%) |
| Coal or Coke | 0 (0.0%) | 0 (0.0%) |
| All other Fuels | 0 (0.0%) | 0 (0.0%) |
| No Fuel Used | 0 (0.0%) | 15 (1.6%) |
| Total | 1,130 (100.0%) | 953 (100.0%) |
Household Vehicle Usage in Sandersville
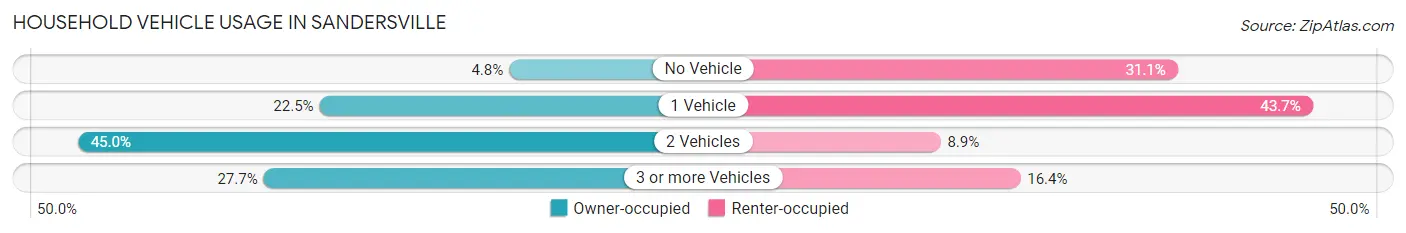
| Vehicles per Household | Owner-occupied | Renter-occupied |
| No Vehicle | 54 (4.8%) | 296 (31.1%) |
| 1 Vehicle | 254 (22.5%) | 416 (43.6%) |
| 2 Vehicles | 509 (45.0%) | 85 (8.9%) |
| 3 or more Vehicles | 313 (27.7%) | 156 (16.4%) |
| Total | 1,130 (100.0%) | 953 (100.0%) |
Real Estate & Mortgages in Sandersville
Real Estate and Mortgage Overview in Sandersville
| Characteristic | Without Mortgage | With Mortgage |
| Housing Units | 632 | 498 |
| Median Property Value | $101,800 | $124,800 |
| Median Household Income | $46,374 | $26 |
| Monthly Housing Costs | $584 | $0 |
| Real Estate Taxes | $1,380 | $0 |
Property Value by Mortgage Status in Sandersville
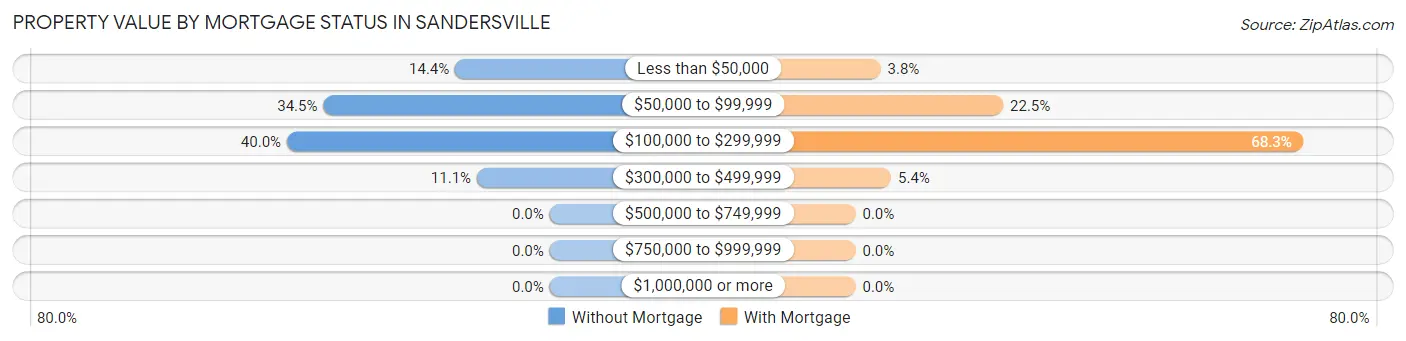
| Property Value | Without Mortgage | With Mortgage |
| Less than $50,000 | 91 (14.4%) | 19 (3.8%) |
| $50,000 to $99,999 | 218 (34.5%) | 112 (22.5%) |
| $100,000 to $299,999 | 253 (40.0%) | 340 (68.3%) |
| $300,000 to $499,999 | 70 (11.1%) | 27 (5.4%) |
| $500,000 to $749,999 | 0 (0.0%) | 0 (0.0%) |
| $750,000 to $999,999 | 0 (0.0%) | 0 (0.0%) |
| $1,000,000 or more | 0 (0.0%) | 0 (0.0%) |
| Total | 632 (100.0%) | 498 (100.0%) |
Household Income by Mortgage Status in Sandersville
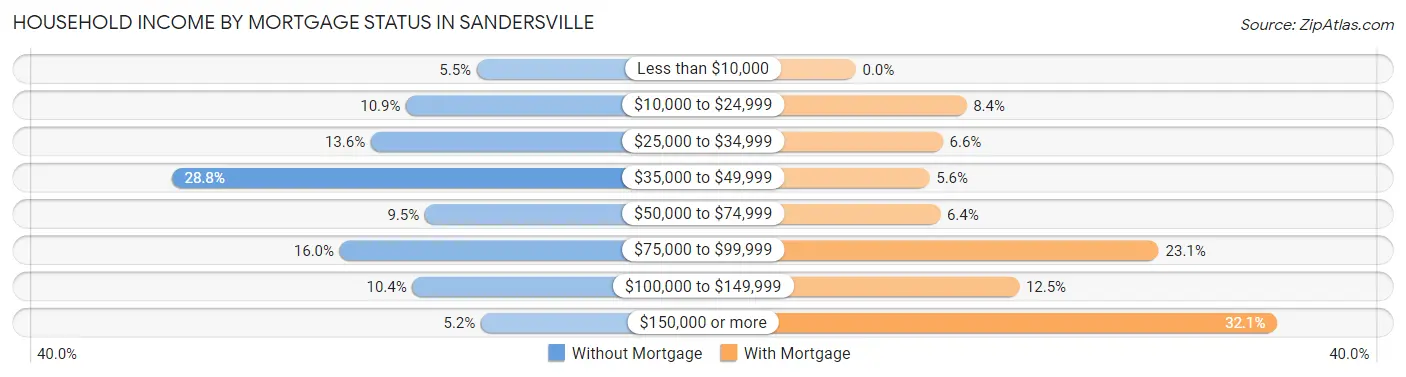
| Household Income | Without Mortgage | With Mortgage |
| Less than $10,000 | 35 (5.5%) | 0 (0.0%) |
| $10,000 to $24,999 | 69 (10.9%) | 42 (8.4%) |
| $25,000 to $34,999 | 86 (13.6%) | 33 (6.6%) |
| $35,000 to $49,999 | 182 (28.8%) | 28 (5.6%) |
| $50,000 to $74,999 | 60 (9.5%) | 32 (6.4%) |
| $75,000 to $99,999 | 101 (16.0%) | 115 (23.1%) |
| $100,000 to $149,999 | 66 (10.4%) | 62 (12.4%) |
| $150,000 or more | 33 (5.2%) | 160 (32.1%) |
| Total | 632 (100.0%) | 498 (100.0%) |
Property Value to Household Income Ratio in Sandersville
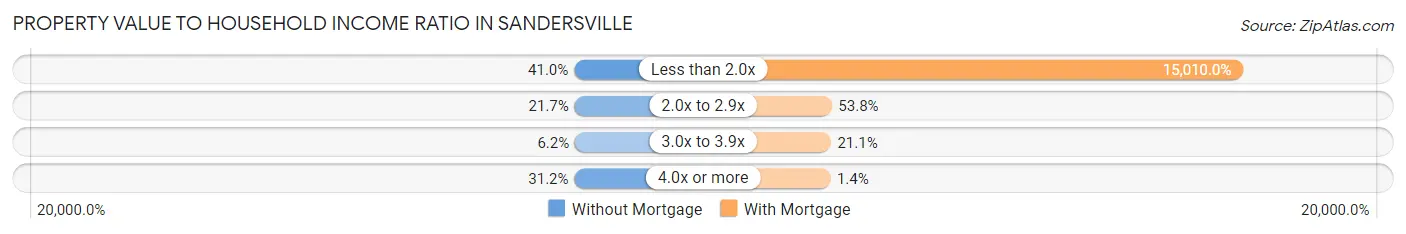
| Value-to-Income Ratio | Without Mortgage | With Mortgage |
| Less than 2.0x | 259 (41.0%) | 74,750 (15,010.0%) |
| 2.0x to 2.9x | 137 (21.7%) | 268 (53.8%) |
| 3.0x to 3.9x | 39 (6.2%) | 105 (21.1%) |
| 4.0x or more | 197 (31.2%) | 7 (1.4%) |
| Total | 632 (100.0%) | 498 (100.0%) |
Real Estate Taxes by Mortgage Status in Sandersville
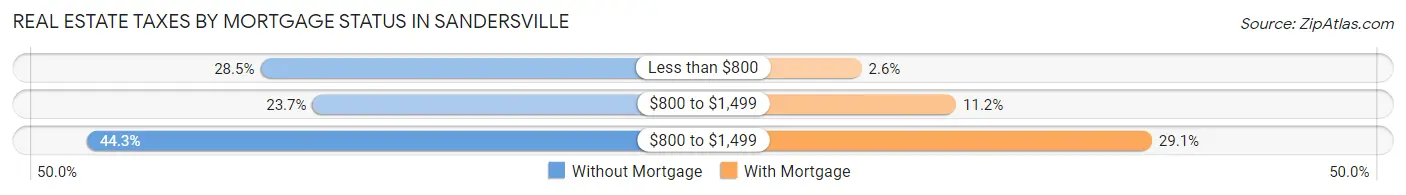
| Property Taxes | Without Mortgage | With Mortgage |
| Less than $800 | 180 (28.5%) | 13 (2.6%) |
| $800 to $1,499 | 150 (23.7%) | 56 (11.2%) |
| $800 to $1,499 | 280 (44.3%) | 145 (29.1%) |
| Total | 632 (100.0%) | 498 (100.0%) |
Health & Disability in Sandersville
Health Insurance Coverage by Age in Sandersville
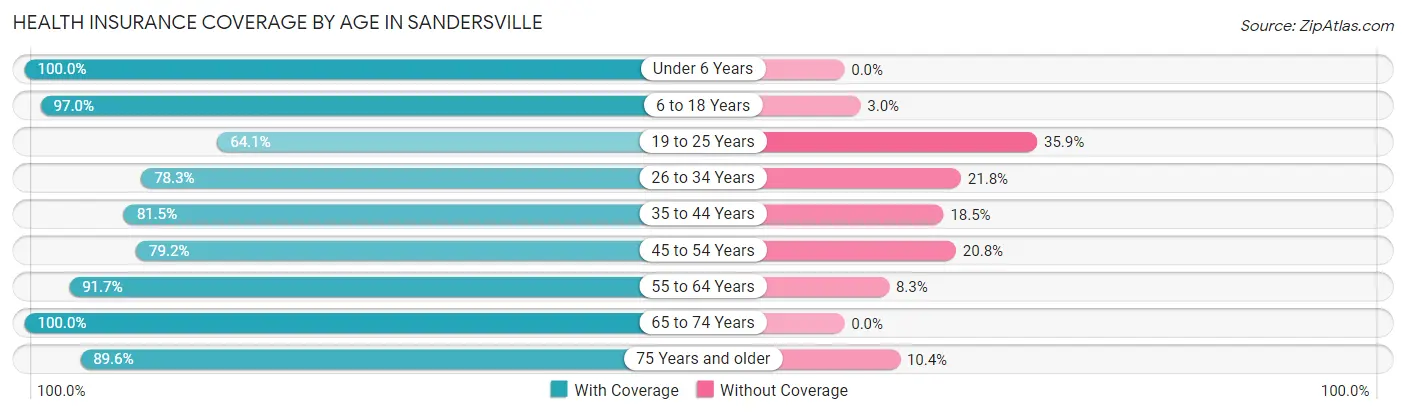
| Age Bracket | With Coverage | Without Coverage |
| Under 6 Years | 411 (100.0%) | 0 (0.0%) |
| 6 to 18 Years | 1,266 (97.0%) | 39 (3.0%) |
| 19 to 25 Years | 303 (64.1%) | 170 (35.9%) |
| 26 to 34 Years | 403 (78.2%) | 112 (21.7%) |
| 35 to 44 Years | 463 (81.5%) | 105 (18.5%) |
| 45 to 54 Years | 468 (79.2%) | 123 (20.8%) |
| 55 to 64 Years | 682 (91.7%) | 62 (8.3%) |
| 65 to 74 Years | 584 (100.0%) | 0 (0.0%) |
| 75 Years and older | 233 (89.6%) | 27 (10.4%) |
| Total | 4,813 (88.3%) | 638 (11.7%) |
Health Insurance Coverage by Citizenship Status in Sandersville
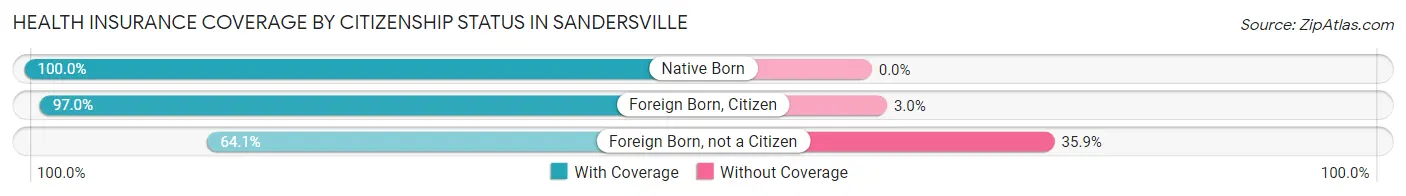
| Citizenship Status | With Coverage | Without Coverage |
| Native Born | 411 (100.0%) | 0 (0.0%) |
| Foreign Born, Citizen | 1,266 (97.0%) | 39 (3.0%) |
| Foreign Born, not a Citizen | 303 (64.1%) | 170 (35.9%) |
Health Insurance Coverage by Household Income in Sandersville
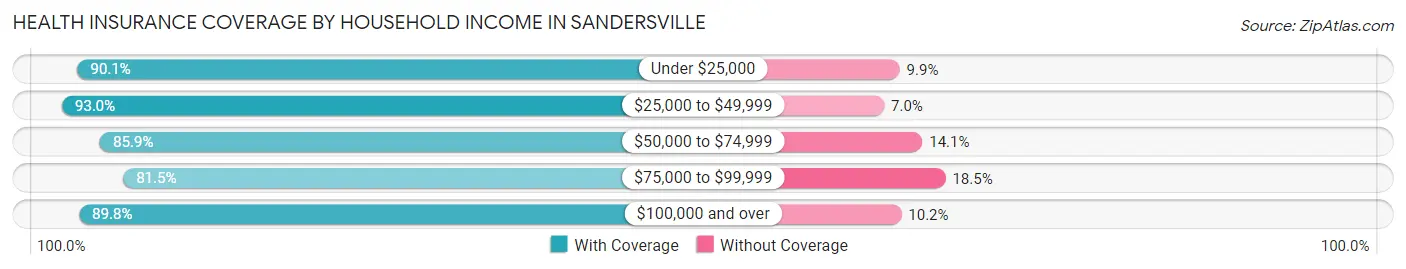
| Household Income | With Coverage | Without Coverage |
| Under $25,000 | 1,047 (90.1%) | 115 (9.9%) |
| $25,000 to $49,999 | 1,184 (93.0%) | 89 (7.0%) |
| $50,000 to $74,999 | 765 (85.9%) | 126 (14.1%) |
| $75,000 to $99,999 | 895 (81.5%) | 203 (18.5%) |
| $100,000 and over | 922 (89.8%) | 105 (10.2%) |
Public vs Private Health Insurance Coverage by Age in Sandersville
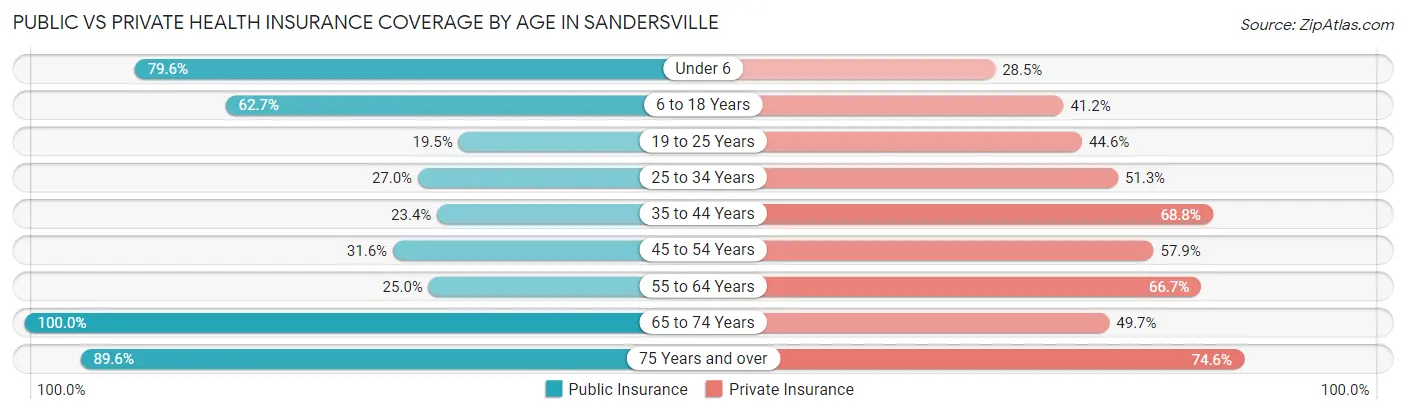
| Age Bracket | Public Insurance | Private Insurance |
| Under 6 | 327 (79.6%) | 117 (28.5%) |
| 6 to 18 Years | 818 (62.7%) | 537 (41.1%) |
| 19 to 25 Years | 92 (19.5%) | 211 (44.6%) |
| 25 to 34 Years | 139 (27.0%) | 264 (51.3%) |
| 35 to 44 Years | 133 (23.4%) | 391 (68.8%) |
| 45 to 54 Years | 187 (31.6%) | 342 (57.9%) |
| 55 to 64 Years | 186 (25.0%) | 496 (66.7%) |
| 65 to 74 Years | 584 (100.0%) | 290 (49.7%) |
| 75 Years and over | 233 (89.6%) | 194 (74.6%) |
| Total | 2,699 (49.5%) | 2,842 (52.1%) |
Disability Status by Sex by Age in Sandersville
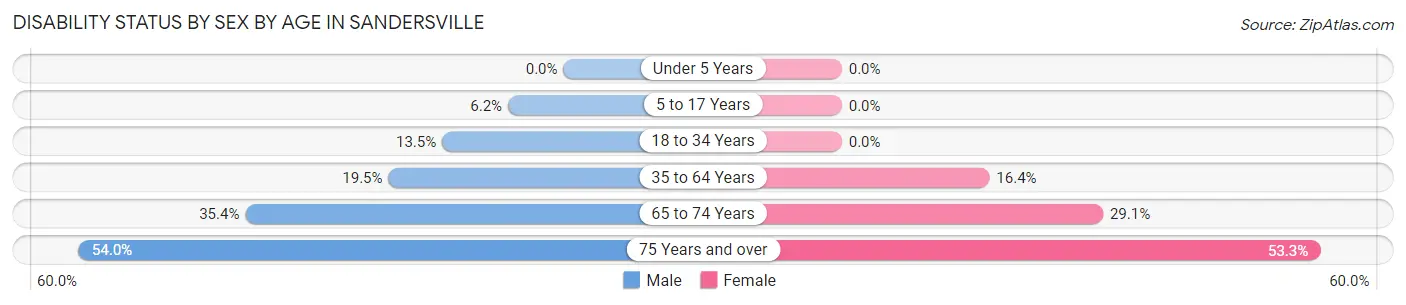
| Age Bracket | Male | Female |
| Under 5 Years | 0 (0.0%) | 0 (0.0%) |
| 5 to 17 Years | 43 (6.2%) | 0 (0.0%) |
| 18 to 34 Years | 50 (13.5%) | 0 (0.0%) |
| 35 to 64 Years | 167 (19.5%) | 172 (16.4%) |
| 65 to 74 Years | 90 (35.4%) | 96 (29.1%) |
| 75 Years and over | 41 (53.9%) | 98 (53.3%) |
Disability Class by Sex by Age in Sandersville
Disability Class: Hearing Difficulty
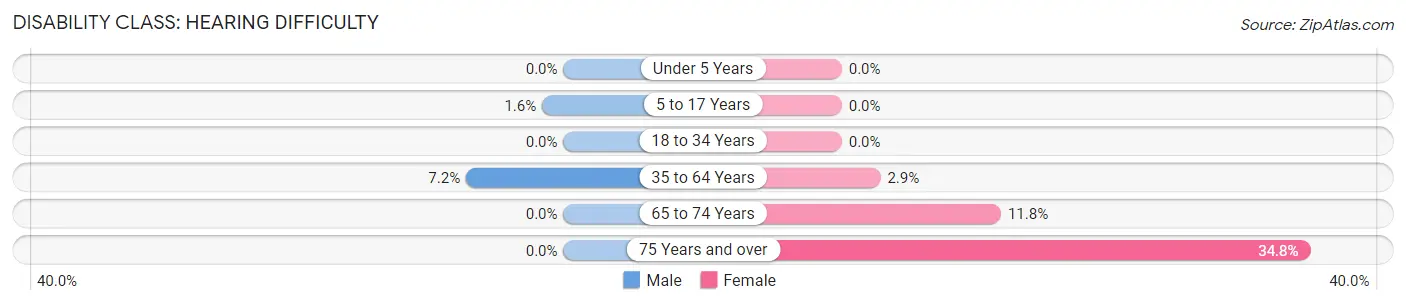
| Age Bracket | Male | Female |
| Under 5 Years | 0 (0.0%) | 0 (0.0%) |
| 5 to 17 Years | 11 (1.6%) | 0 (0.0%) |
| 18 to 34 Years | 0 (0.0%) | 0 (0.0%) |
| 35 to 64 Years | 62 (7.2%) | 30 (2.9%) |
| 65 to 74 Years | 0 (0.0%) | 39 (11.8%) |
| 75 Years and over | 0 (0.0%) | 64 (34.8%) |
Disability Class: Vision Difficulty
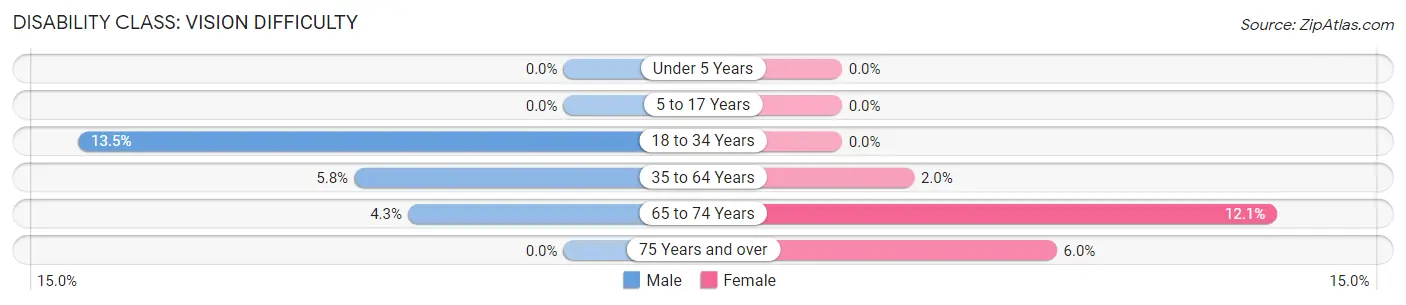
| Age Bracket | Male | Female |
| Under 5 Years | 0 (0.0%) | 0 (0.0%) |
| 5 to 17 Years | 0 (0.0%) | 0 (0.0%) |
| 18 to 34 Years | 50 (13.5%) | 0 (0.0%) |
| 35 to 64 Years | 50 (5.8%) | 21 (2.0%) |
| 65 to 74 Years | 11 (4.3%) | 40 (12.1%) |
| 75 Years and over | 0 (0.0%) | 11 (6.0%) |
Disability Class: Cognitive Difficulty
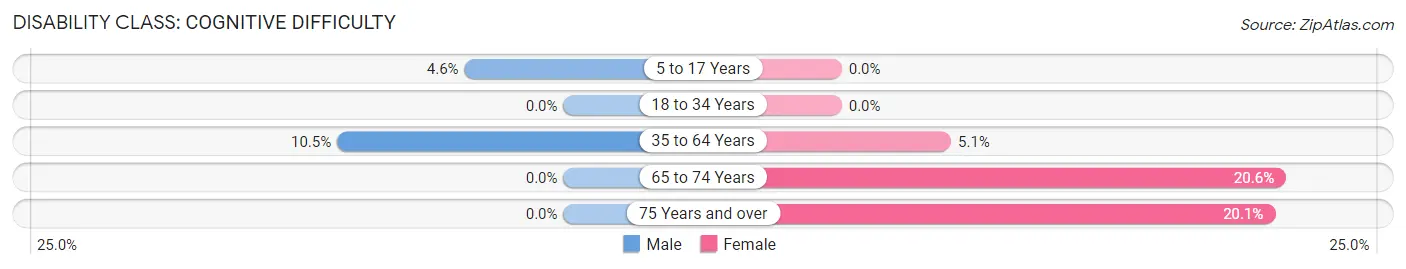
| Age Bracket | Male | Female |
| 5 to 17 Years | 32 (4.6%) | 0 (0.0%) |
| 18 to 34 Years | 0 (0.0%) | 0 (0.0%) |
| 35 to 64 Years | 90 (10.5%) | 53 (5.1%) |
| 65 to 74 Years | 0 (0.0%) | 68 (20.6%) |
| 75 Years and over | 0 (0.0%) | 37 (20.1%) |
Disability Class: Ambulatory Difficulty
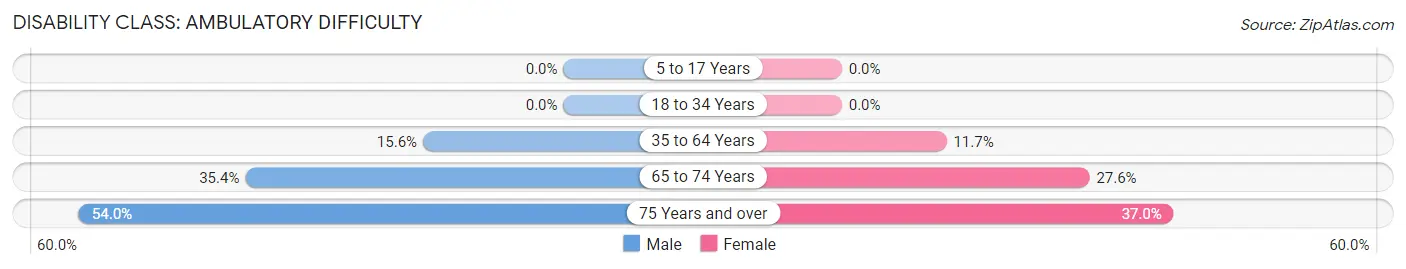
| Age Bracket | Male | Female |
| 5 to 17 Years | 0 (0.0%) | 0 (0.0%) |
| 18 to 34 Years | 0 (0.0%) | 0 (0.0%) |
| 35 to 64 Years | 134 (15.6%) | 122 (11.7%) |
| 65 to 74 Years | 90 (35.4%) | 91 (27.6%) |
| 75 Years and over | 41 (53.9%) | 68 (37.0%) |
Disability Class: Self-Care Difficulty
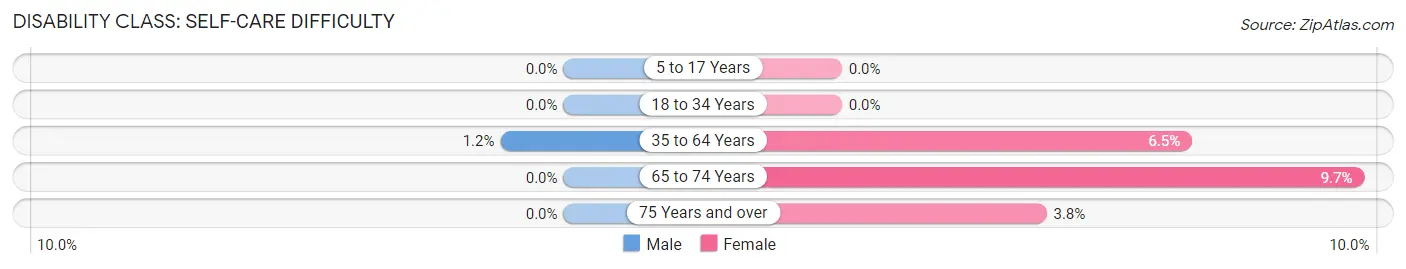
| Age Bracket | Male | Female |
| 5 to 17 Years | 0 (0.0%) | 0 (0.0%) |
| 18 to 34 Years | 0 (0.0%) | 0 (0.0%) |
| 35 to 64 Years | 10 (1.2%) | 68 (6.5%) |
| 65 to 74 Years | 0 (0.0%) | 32 (9.7%) |
| 75 Years and over | 0 (0.0%) | 7 (3.8%) |
Technology Access in Sandersville
Computing Device Access in Sandersville
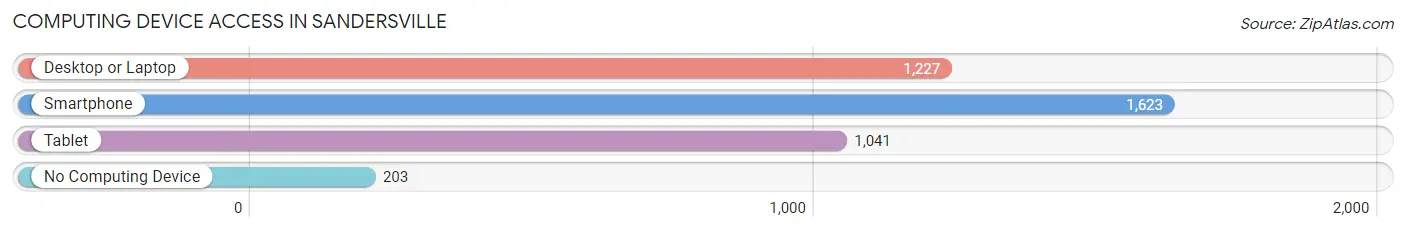
| Device Type | # Households | % Households |
| Desktop or Laptop | 1,227 | 58.9% |
| Smartphone | 1,623 | 77.9% |
| Tablet | 1,041 | 50.0% |
| No Computing Device | 203 | 9.8% |
| Total | 2,083 | 100.0% |
Internet Access in Sandersville
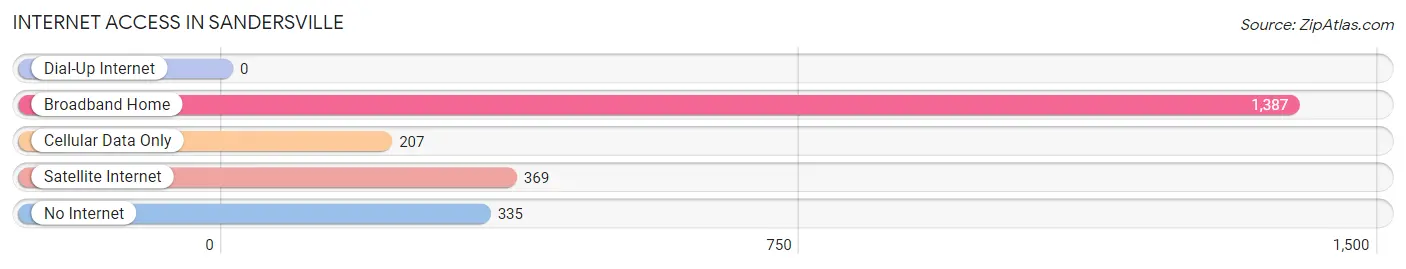
| Internet Type | # Households | % Households |
| Dial-Up Internet | 0 | 0.0% |
| Broadband Home | 1,387 | 66.6% |
| Cellular Data Only | 207 | 9.9% |
| Satellite Internet | 369 | 17.7% |
| No Internet | 335 | 16.1% |
| Total | 2,083 | 100.0% |
Sandersville Summary
History
The city of Sandersville, Georgia is located in the central part of the state, in Washington County. It is the county seat of Washington County and is the largest city in the county. The city was founded in 1812 and was named after General Thomas Sanders, who was a Revolutionary War hero.
The city of Sandersville was originally a small farming community, but it began to grow in the late 19th century when the railroad came to town. The railroad brought new industry and jobs to the area, and the city began to grow rapidly. By the early 20th century, Sandersville had become a major industrial center, with several factories and mills located in the city.
The city of Sandersville was also an important center for education in the early 20th century. The city was home to several schools, including the Sandersville Institute, which was founded in 1891. The school was a private school for African-American students, and it was the first school of its kind in the state of Georgia.
The city of Sandersville was also an important center for the civil rights movement in the 1960s. The city was home to several civil rights leaders, including Dr. Martin Luther King Jr., who visited the city in 1965. The city was also the site of several civil rights protests and marches, including the famous march from Selma to Montgomery in 1965.
Geography
The city of Sandersville is located in the central part of the state of Georgia, in Washington County. It is situated in the Piedmont region of the state, and is located about 50 miles east of Macon and about 90 miles south of Atlanta. The city is located at the intersection of two major highways, US Highway 441 and US Highway 221.
The city of Sandersville is located in a hilly area, with the Oconee River running through the city. The city is located at an elevation of about 500 feet above sea level. The climate in the city is humid subtropical, with hot, humid summers and mild winters.
Economy
The economy of Sandersville is largely based on manufacturing and agriculture. The city is home to several factories and mills, including a paper mill, a textile mill, and a furniture factory. The city is also home to several agricultural businesses, including poultry farms, dairy farms, and vegetable farms.
The city of Sandersville is also home to several retail businesses, including several restaurants, grocery stores, and clothing stores. The city is also home to several banks and financial institutions, as well as several medical facilities.
Demographics
As of the 2010 census, the city of Sandersville had a population of 5,912 people. The racial makeup of the city was 57.3% White, 37.2% African American, 0.3% Native American, 0.7% Asian, 0.1% Pacific Islander, and 4.4% from other races. The median household income in the city was $30,945, and the median family income was $37,813. The per capita income in the city was $17,845.
Common Questions
What is Per Capita Income in Sandersville?
Per Capita income in Sandersville is $21,959.
What is the Median Family Income in Sandersville?
Median Family Income in Sandersville is $56,981.
What is the Median Household income in Sandersville?
Median Household Income in Sandersville is $45,502.
What is Income or Wage Gap in Sandersville?
Income or Wage Gap in Sandersville is 39.6%.
Women in Sandersville earn 60.4 cents for every dollar earned by a man.
What is Inequality or Gini Index in Sandersville?
Inequality or Gini Index in Sandersville is 0.43.
What is the Total Population of Sandersville?
Total Population of Sandersville is 5,727.
What is the Total Male Population of Sandersville?
Total Male Population of Sandersville is 2,574.
What is the Total Female Population of Sandersville?
Total Female Population of Sandersville is 3,153.
What is the Ratio of Males per 100 Females in Sandersville?
There are 81.64 Males per 100 Females in Sandersville.
What is the Ratio of Females per 100 Males in Sandersville?
There are 122.49 Females per 100 Males in Sandersville.
What is the Median Population Age in Sandersville?
Median Population Age in Sandersville is 36.1 Years.
What is the Average Family Size in Sandersville
Average Family Size in Sandersville is 3.3 People.
What is the Average Household Size in Sandersville
Average Household Size in Sandersville is 2.6 People.
How Large is the Labor Force in Sandersville?
There are 2,354 People in the Labor Forcein in Sandersville.
What is the Percentage of People in the Labor Force in Sandersville?
52.9% of People are in the Labor Force in Sandersville.
What is the Unemployment Rate in Sandersville?
Unemployment Rate in Sandersville is 7.9%.