Millen, GA Map & Demographics
Millen Map
Millen Overview
$17,338
PER CAPITA INCOME
$42,188
AVG FAMILY INCOME
$34,213
AVG HOUSEHOLD INCOME
28.6%
WAGE / INCOME GAP [ % ]
71.4¢/ $1
WAGE / INCOME GAP [ $ ]
0.39
INEQUALITY / GINI INDEX
2,973
TOTAL POPULATION
1,252
MALE POPULATION
1,721
FEMALE POPULATION
72.75
MALES / 100 FEMALES
137.46
FEMALES / 100 MALES
54.5
MEDIAN AGE
3.2
AVG FAMILY SIZE
2.5
AVG HOUSEHOLD SIZE
1,031
LABOR FORCE [ PEOPLE ]
39.3%
PERCENT IN LABOR FORCE
10.0%
UNEMPLOYMENT RATE
Millen Zip Codes
Millen Area Codes
Income in Millen
Income Overview in Millen
Per Capita Income in Millen is $17,338, while median incomes of families and households are $42,188 and $34,213 respectively.
| Characteristic | Number | Measure |
| Per Capita Income | 2,973 | $17,338 |
| Median Family Income | 666 | $42,188 |
| Mean Family Income | 666 | $52,880 |
| Median Household Income | 1,151 | $34,213 |
| Mean Household Income | 1,151 | $43,478 |
| Income Deficit | 666 | $0 |
| Wage / Income Gap (%) | 2,973 | 28.64% |
| Wage / Income Gap ($) | 2,973 | 71.36¢ per $1 |
| Gini / Inequality Index | 2,973 | 0.39 |
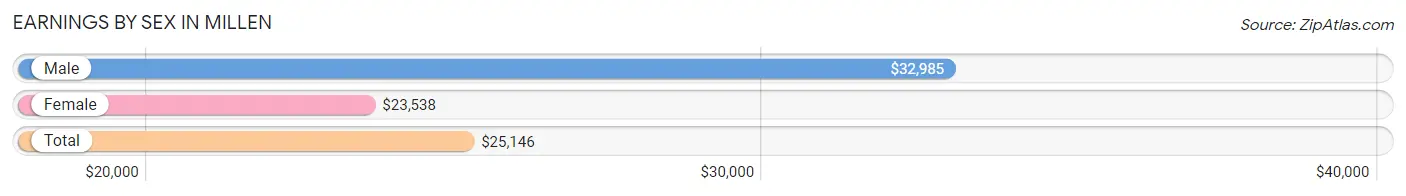
Earnings by Sex in Millen
Average Earnings in Millen are $25,146, $32,985 for men and $23,538 for women, a difference of 28.6%.
| Sex | Number | Average Earnings |
| Male | 488 (52.1%) | $32,985 |
| Female | 449 (47.9%) | $23,538 |
| Total | 937 (100.0%) | $25,146 |
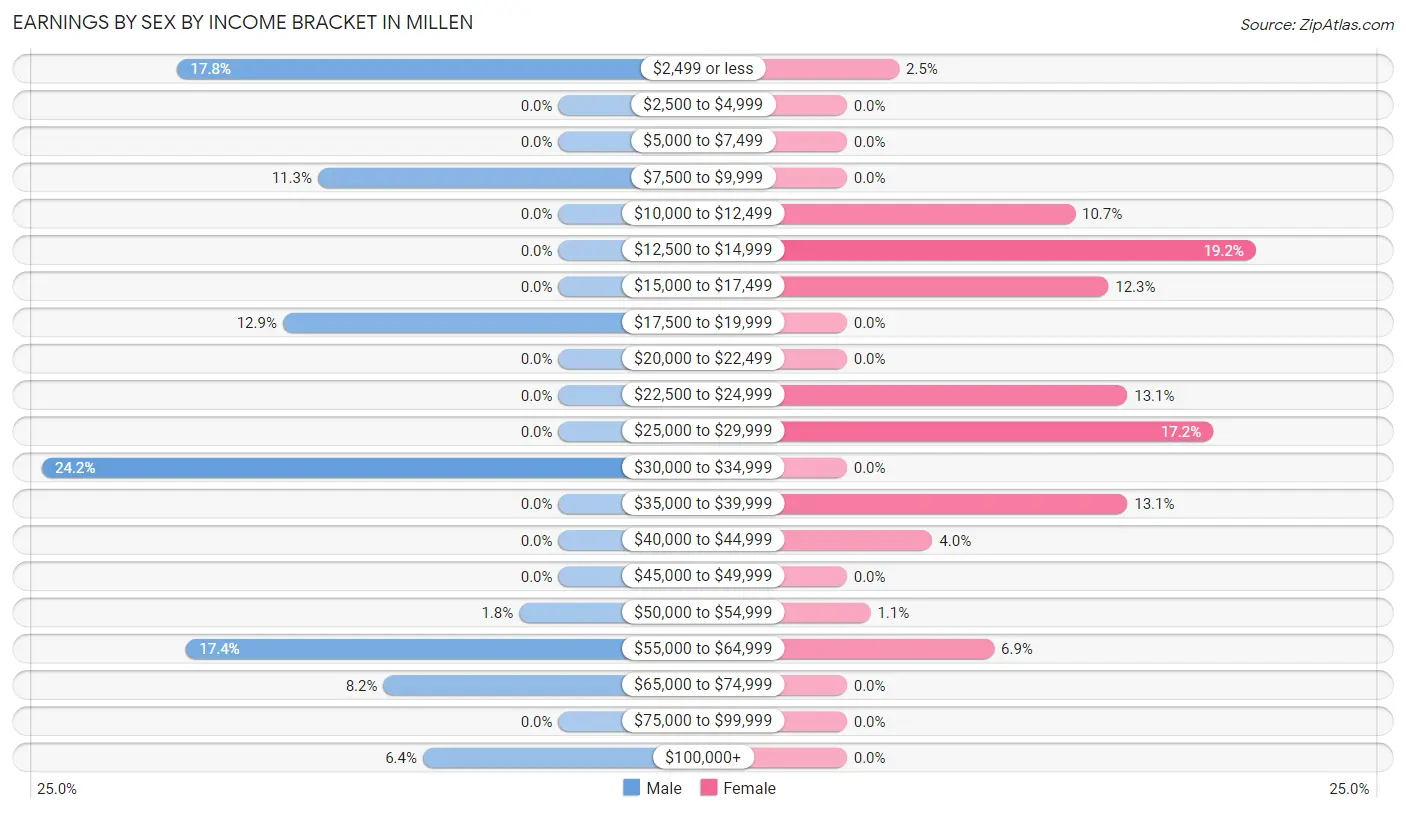
Earnings by Sex by Income Bracket in Millen
The most common earnings brackets in Millen are $30,000 to $34,999 for men (118 | 24.2%) and $12,500 to $14,999 for women (86 | 19.2%).
| Income | Male | Female |
| $2,499 or less | 87 (17.8%) | 11 (2.5%) |
| $2,500 to $4,999 | 0 (0.0%) | 0 (0.0%) |
| $5,000 to $7,499 | 0 (0.0%) | 0 (0.0%) |
| $7,500 to $9,999 | 55 (11.3%) | 0 (0.0%) |
| $10,000 to $12,499 | 0 (0.0%) | 48 (10.7%) |
| $12,500 to $14,999 | 0 (0.0%) | 86 (19.2%) |
| $15,000 to $17,499 | 0 (0.0%) | 55 (12.2%) |
| $17,500 to $19,999 | 63 (12.9%) | 0 (0.0%) |
| $20,000 to $22,499 | 0 (0.0%) | 0 (0.0%) |
| $22,500 to $24,999 | 0 (0.0%) | 59 (13.1%) |
| $25,000 to $29,999 | 0 (0.0%) | 77 (17.2%) |
| $30,000 to $34,999 | 118 (24.2%) | 0 (0.0%) |
| $35,000 to $39,999 | 0 (0.0%) | 59 (13.1%) |
| $40,000 to $44,999 | 0 (0.0%) | 18 (4.0%) |
| $45,000 to $49,999 | 0 (0.0%) | 0 (0.0%) |
| $50,000 to $54,999 | 9 (1.8%) | 5 (1.1%) |
| $55,000 to $64,999 | 85 (17.4%) | 31 (6.9%) |
| $65,000 to $74,999 | 40 (8.2%) | 0 (0.0%) |
| $75,000 to $99,999 | 0 (0.0%) | 0 (0.0%) |
| $100,000+ | 31 (6.4%) | 0 (0.0%) |
| Total | 488 (100.0%) | 449 (100.0%) |
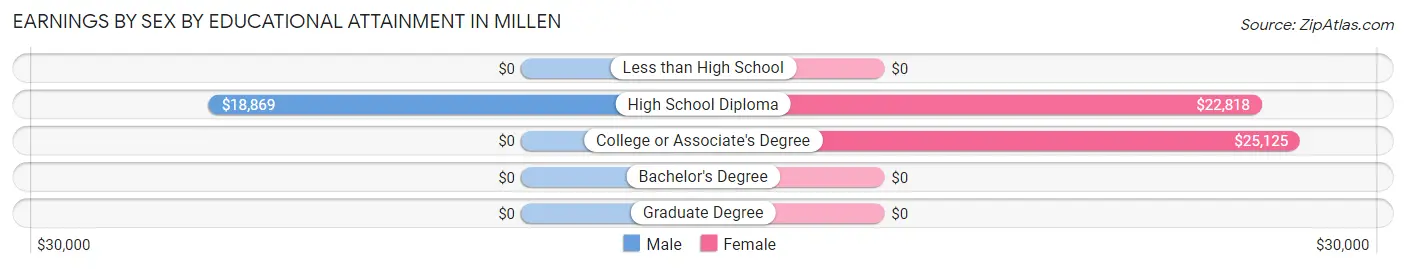
Earnings by Sex by Educational Attainment in Millen
| Educational Attainment | Male Income | Female Income |
| Less than High School | - | - |
| High School Diploma | $18,869 | $22,818 |
| College or Associate's Degree | - | - |
| Bachelor's Degree | - | - |
| Graduate Degree | - | - |
| Total | - | - |
Family Income in Millen
Family Income Brackets in Millen
According to the Millen family income data, there are 159 families falling into the $50,000 to $74,999 income range, which is the most common income bracket and makes up 23.9% of all families.
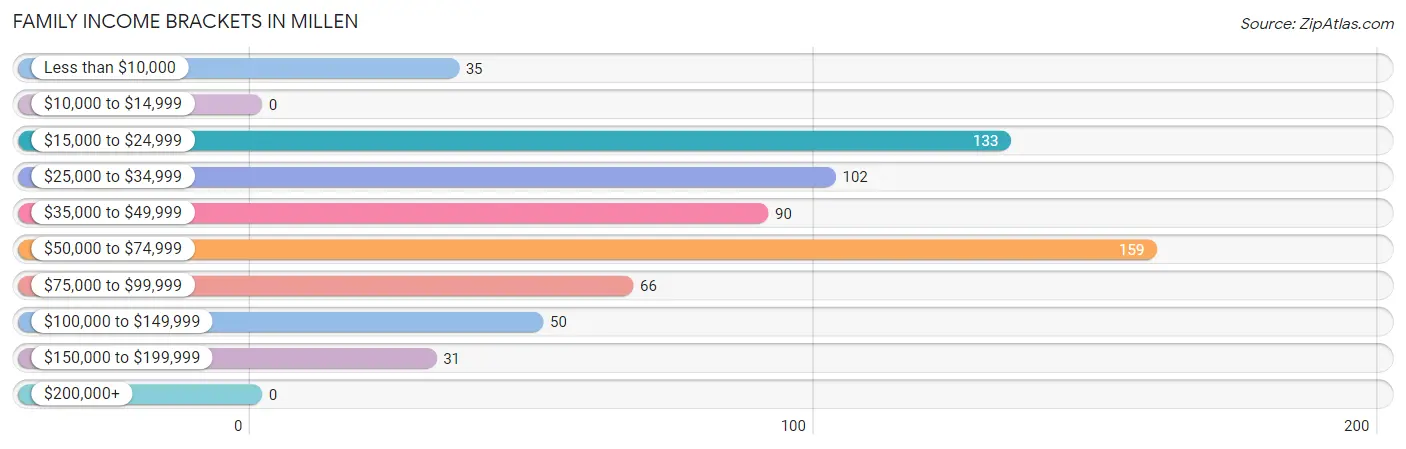
| Income Bracket | # Families | % Families |
| Less than $10,000 | 35 | 5.3% |
| $10,000 to $14,999 | 0 | 0.0% |
| $15,000 to $24,999 | 133 | 20.0% |
| $25,000 to $34,999 | 102 | 15.3% |
| $35,000 to $49,999 | 90 | 13.5% |
| $50,000 to $74,999 | 159 | 23.9% |
| $75,000 to $99,999 | 66 | 9.9% |
| $100,000 to $149,999 | 50 | 7.5% |
| $150,000 to $199,999 | 31 | 4.7% |
| $200,000+ | 0 | 0.0% |
Family Income by Famaliy Size in Millen
2-person families (355 | 53.3%) account for the highest median family income in Millen with $45,598 per family, while 2-person families (355 | 53.3%) have the highest median income of $22,799 per family member.
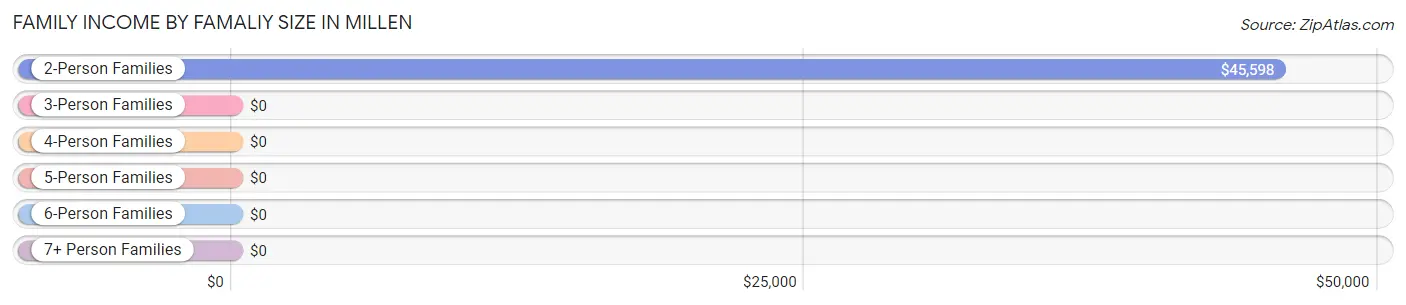
| Income Bracket | # Families | Median Income |
| 2-Person Families | 355 (53.3%) | $45,598 |
| 3-Person Families | 120 (18.0%) | $0 |
| 4-Person Families | 178 (26.7%) | $0 |
| 5-Person Families | 13 (1.9%) | $0 |
| 6-Person Families | 0 (0.0%) | $0 |
| 7+ Person Families | 0 (0.0%) | $0 |
| Total | 666 (100.0%) | $42,188 |
Family Income by Number of Earners in Millen
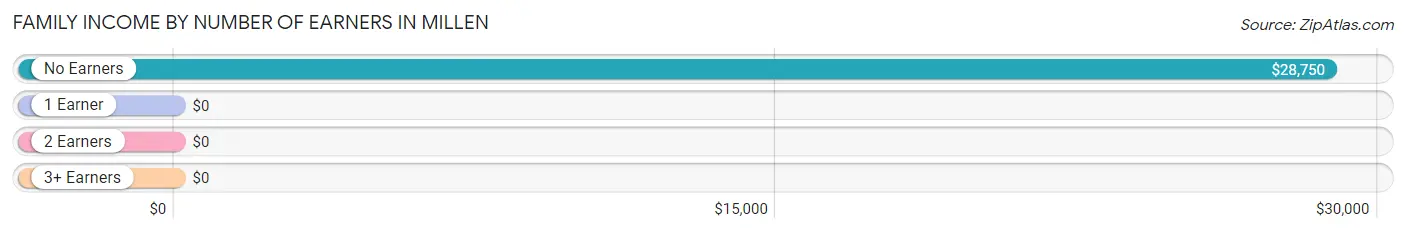
| Number of Earners | # Families | Median Income |
| No Earners | 274 (41.1%) | $28,750 |
| 1 Earner | 158 (23.7%) | $0 |
| 2 Earners | 213 (32.0%) | $0 |
| 3+ Earners | 21 (3.2%) | $0 |
| Total | 666 (100.0%) | $42,188 |
Household Income in Millen
Household Income Brackets in Millen
With 244 households falling in the category, the $15,000 to $24,999 income range is the most frequent in Millen, accounting for 21.2% of all households.
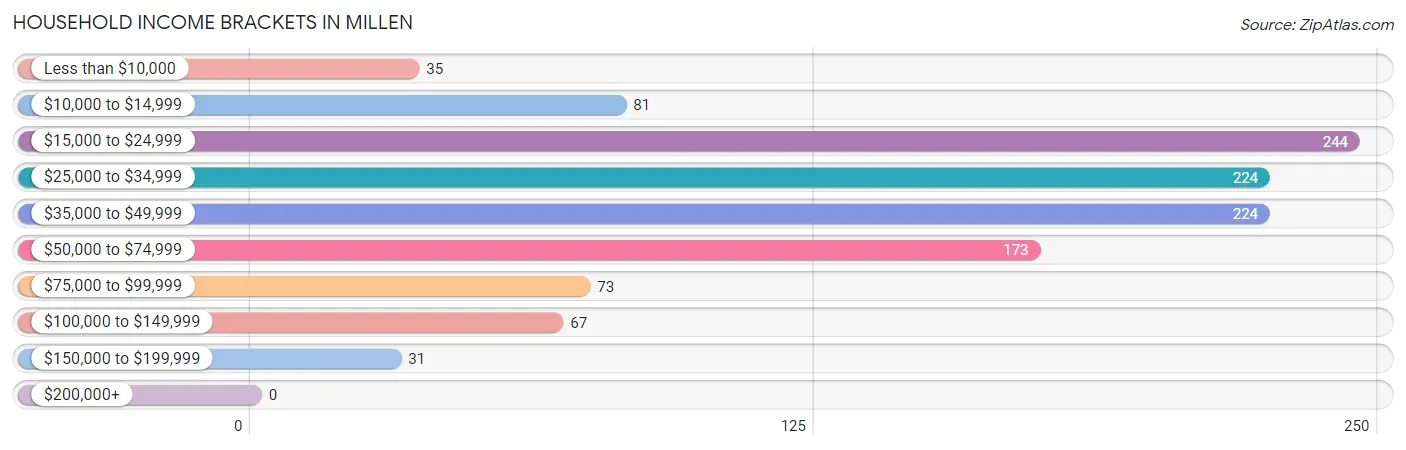
| Income Bracket | # Households | % Households |
| Less than $10,000 | 35 | 3.0% |
| $10,000 to $14,999 | 81 | 7.0% |
| $15,000 to $24,999 | 244 | 21.2% |
| $25,000 to $34,999 | 224 | 19.5% |
| $35,000 to $49,999 | 224 | 19.5% |
| $50,000 to $74,999 | 173 | 15.0% |
| $75,000 to $99,999 | 73 | 6.3% |
| $100,000 to $149,999 | 67 | 5.8% |
| $150,000 to $199,999 | 31 | 2.7% |
| $200,000+ | 0 | 0.0% |
Household Income by Householder Age in Millen
The median household income in Millen is $34,213, with the highest median household income of $50,563 found in the 45 to 64 years age bracket for the primary householder. A total of 292 households (25.4%) fall into this category. Meanwhile, the 15 to 24 years age bracket for the primary householder has the lowest median household income of $0, with 12 households (1.0%) in this group.
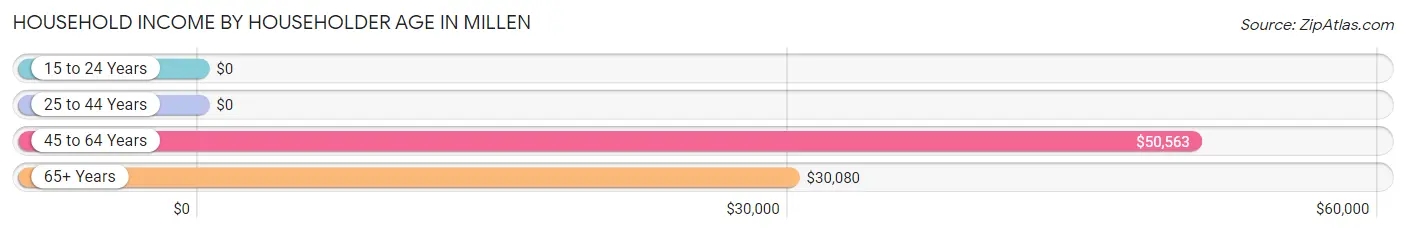
| Income Bracket | # Households | Median Income |
| 15 to 24 Years | 12 (1.0%) | $0 |
| 25 to 44 Years | 158 (13.7%) | $0 |
| 45 to 64 Years | 292 (25.4%) | $50,563 |
| 65+ Years | 689 (59.9%) | $30,080 |
| Total | 1,151 (100.0%) | $34,213 |
Poverty in Millen
Income Below Poverty by Sex and Age in Millen
With 40.9% poverty level for males and 29.0% for females among the residents of Millen, 6 to 11 year old males and 16 and 17 year old females are the most vulnerable to poverty, with 27 males (75.0%) and 39 females (100.0%) in their respective age groups living below the poverty level.
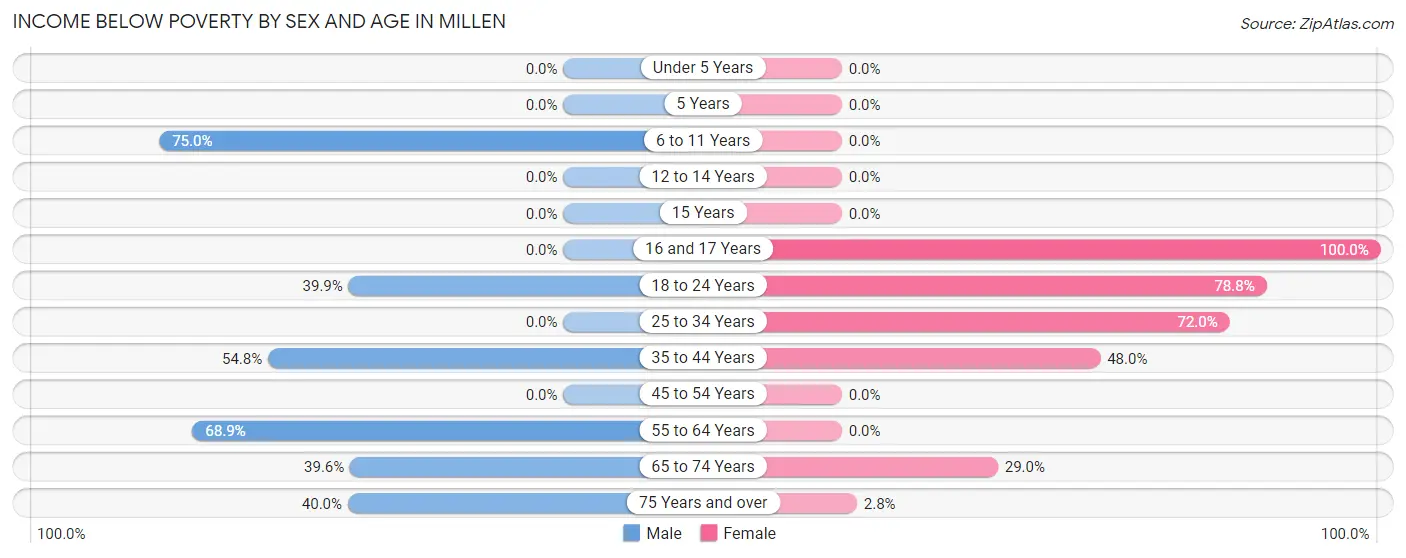
| Age Bracket | Male | Female |
| Under 5 Years | 0 (0.0%) | 0 (0.0%) |
| 5 Years | 0 (0.0%) | 0 (0.0%) |
| 6 to 11 Years | 27 (75.0%) | 0 (0.0%) |
| 12 to 14 Years | 0 (0.0%) | 0 (0.0%) |
| 15 Years | 0 (0.0%) | 0 (0.0%) |
| 16 and 17 Years | 0 (0.0%) | 39 (100.0%) |
| 18 to 24 Years | 55 (39.9%) | 67 (78.8%) |
| 25 to 34 Years | 0 (0.0%) | 195 (72.0%) |
| 35 to 44 Years | 125 (54.8%) | 71 (48.0%) |
| 45 to 54 Years | 0 (0.0%) | 0 (0.0%) |
| 55 to 64 Years | 179 (68.9%) | 0 (0.0%) |
| 65 to 74 Years | 95 (39.6%) | 110 (28.9%) |
| 75 Years and over | 14 (40.0%) | 6 (2.8%) |
| Total | 495 (40.9%) | 488 (29.0%) |
Income Above Poverty by Sex and Age in Millen
According to the poverty statistics in Millen, males aged under 5 years and females aged under 5 years are the age groups that are most secure financially, with 100.0% of males and 100.0% of females in these age groups living above the poverty line.
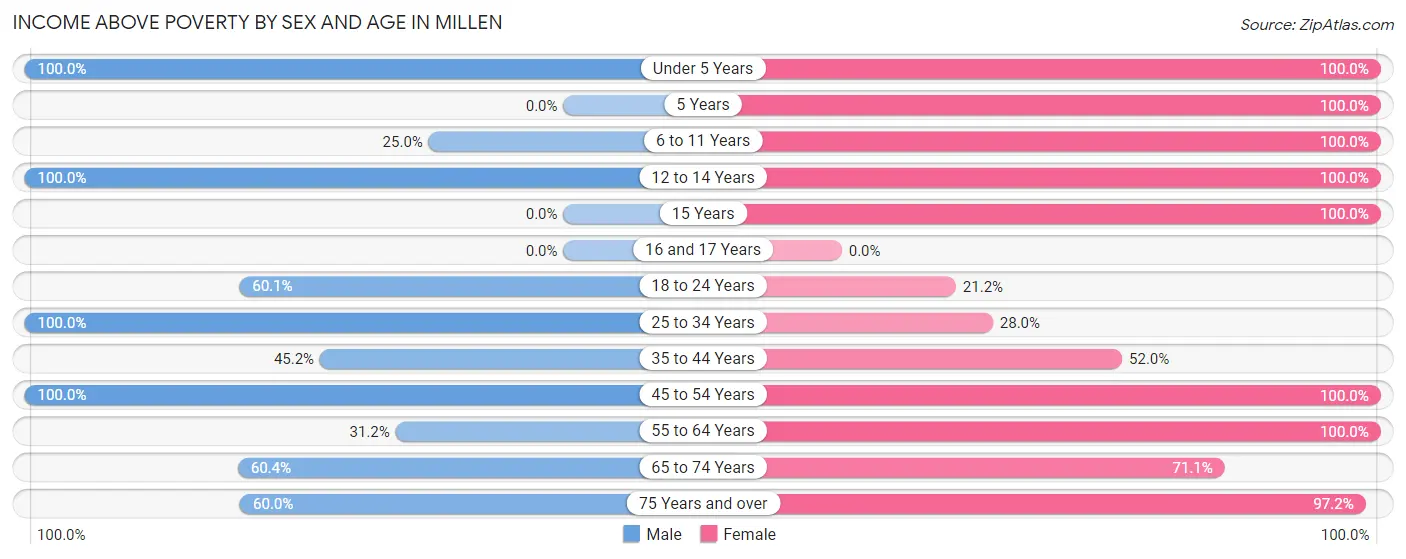
| Age Bracket | Male | Female |
| Under 5 Years | 9 (100.0%) | 6 (100.0%) |
| 5 Years | 0 (0.0%) | 61 (100.0%) |
| 6 to 11 Years | 9 (25.0%) | 82 (100.0%) |
| 12 to 14 Years | 1 (100.0%) | 126 (100.0%) |
| 15 Years | 0 (0.0%) | 28 (100.0%) |
| 16 and 17 Years | 0 (0.0%) | 0 (0.0%) |
| 18 to 24 Years | 83 (60.1%) | 18 (21.2%) |
| 25 to 34 Years | 86 (100.0%) | 76 (28.0%) |
| 35 to 44 Years | 103 (45.2%) | 77 (52.0%) |
| 45 to 54 Years | 176 (100.0%) | 107 (100.0%) |
| 55 to 64 Years | 81 (31.1%) | 137 (100.0%) |
| 65 to 74 Years | 145 (60.4%) | 270 (71.1%) |
| 75 Years and over | 21 (60.0%) | 208 (97.2%) |
| Total | 714 (59.1%) | 1,196 (71.0%) |
Income Below Poverty Among Married-Couple Families in Millen
The poverty statistics for married-couple families in Millen show that 8.1% or 31 of the total 381 families live below the poverty line. Families with no children have the highest poverty rate of 13.8%, comprising of 31 families. On the other hand, families with 1 or 2 children have the lowest poverty rate of 0.0%, which includes 0 families.
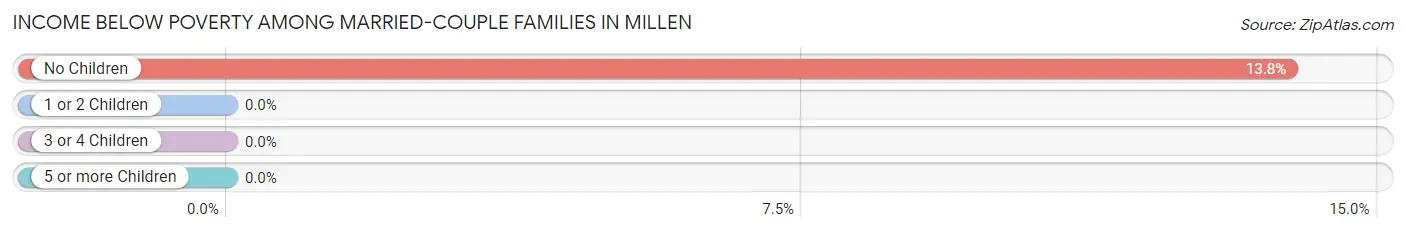
| Children | Above Poverty | Below Poverty |
| No Children | 193 (86.2%) | 31 (13.8%) |
| 1 or 2 Children | 157 (100.0%) | 0 (0.0%) |
| 3 or 4 Children | 0 (0.0%) | 0 (0.0%) |
| 5 or more Children | 0 (0.0%) | 0 (0.0%) |
| Total | 350 (91.9%) | 31 (8.1%) |
Income Below Poverty Among Single-Parent Households in Millen
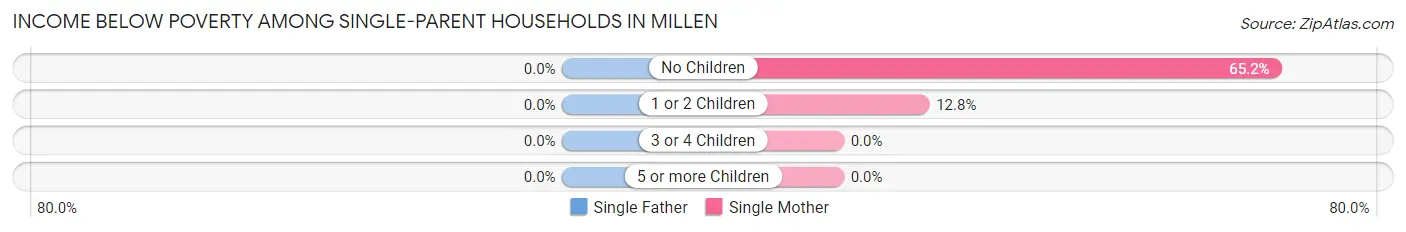
| Children | Single Father | Single Mother |
| No Children | 0 (0.0%) | 90 (65.2%) |
| 1 or 2 Children | 0 (0.0%) | 13 (12.8%) |
| 3 or 4 Children | 0 (0.0%) | 0 (0.0%) |
| 5 or more Children | 0 (0.0%) | 0 (0.0%) |
| Total | 0 (0.0%) | 103 (42.9%) |
Income Below Poverty Among Married-Couple vs Single-Parent Households in Millen
The poverty data for Millen shows that 31 of the married-couple family households (8.1%) and 103 of the single-parent households (36.1%) are living below the poverty level. Within the married-couple family households, those with no children have the highest poverty rate, with 31 households (13.8%) falling below the poverty line. Among the single-parent households, those with no children have the highest poverty rate, with 90 household (49.2%) living below poverty.
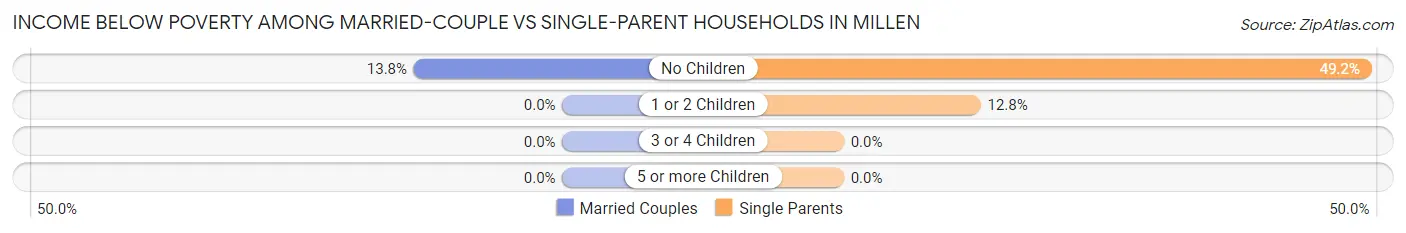
| Children | Married-Couple Families | Single-Parent Households |
| No Children | 31 (13.8%) | 90 (49.2%) |
| 1 or 2 Children | 0 (0.0%) | 13 (12.8%) |
| 3 or 4 Children | 0 (0.0%) | 0 (0.0%) |
| 5 or more Children | 0 (0.0%) | 0 (0.0%) |
| Total | 31 (8.1%) | 103 (36.1%) |
Race in Millen
The most populous races in Millen are Black / African American (1,410 | 47.4%), White / Caucasian (1,390 | 46.8%), and Hispanic or Latino (173 | 5.8%).
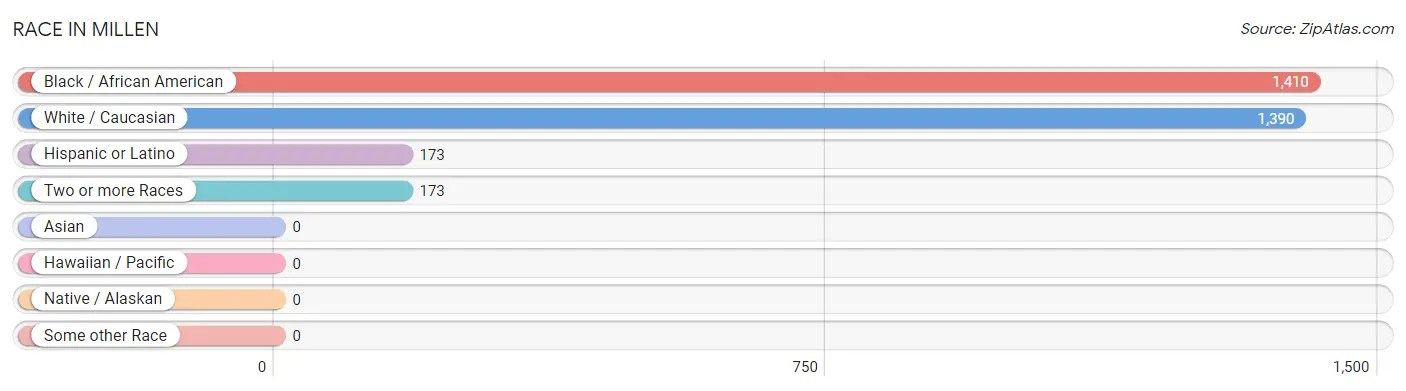
| Race | # Population | % Population |
| Asian | 0 | 0.0% |
| Black / African American | 1,410 | 47.4% |
| Hawaiian / Pacific | 0 | 0.0% |
| Hispanic or Latino | 173 | 5.8% |
| Native / Alaskan | 0 | 0.0% |
| White / Caucasian | 1,390 | 46.8% |
| Two or more Races | 173 | 5.8% |
| Some other Race | 0 | 0.0% |
| Total | 2,973 | 100.0% |
Ancestry in Millen
The most populous ancestries reported in Millen are English (215 | 7.2%), American (210 | 7.1%), Mexican (173 | 5.8%), German (104 | 3.5%), and Scotch-Irish (51 | 1.7%), together accounting for 25.3% of all Millen residents.
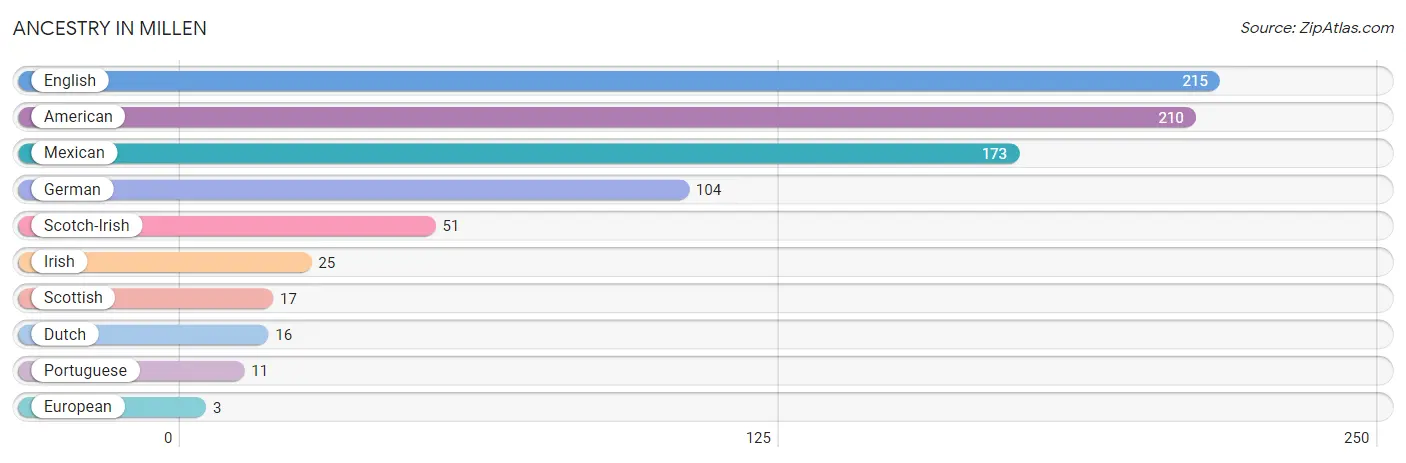
| Ancestry | # Population | % Population |
| American | 210 | 7.1% |
| Dutch | 16 | 0.5% |
| English | 215 | 7.2% |
| European | 3 | 0.1% |
| German | 104 | 3.5% |
| Irish | 25 | 0.8% |
| Mexican | 173 | 5.8% |
| Portuguese | 11 | 0.4% |
| Scotch-Irish | 51 | 1.7% |
| Scottish | 17 | 0.6% | View All 10 Rows |
Immigrants in Millen

| Immigration Origin | # Population | % Population | View All 0 Rows |
Sex and Age in Millen
Sex and Age in Millen
The most populous age groups in Millen are 35 to 39 Years (228 | 18.2%) for men and 25 to 29 Years (241 | 14.0%) for women.
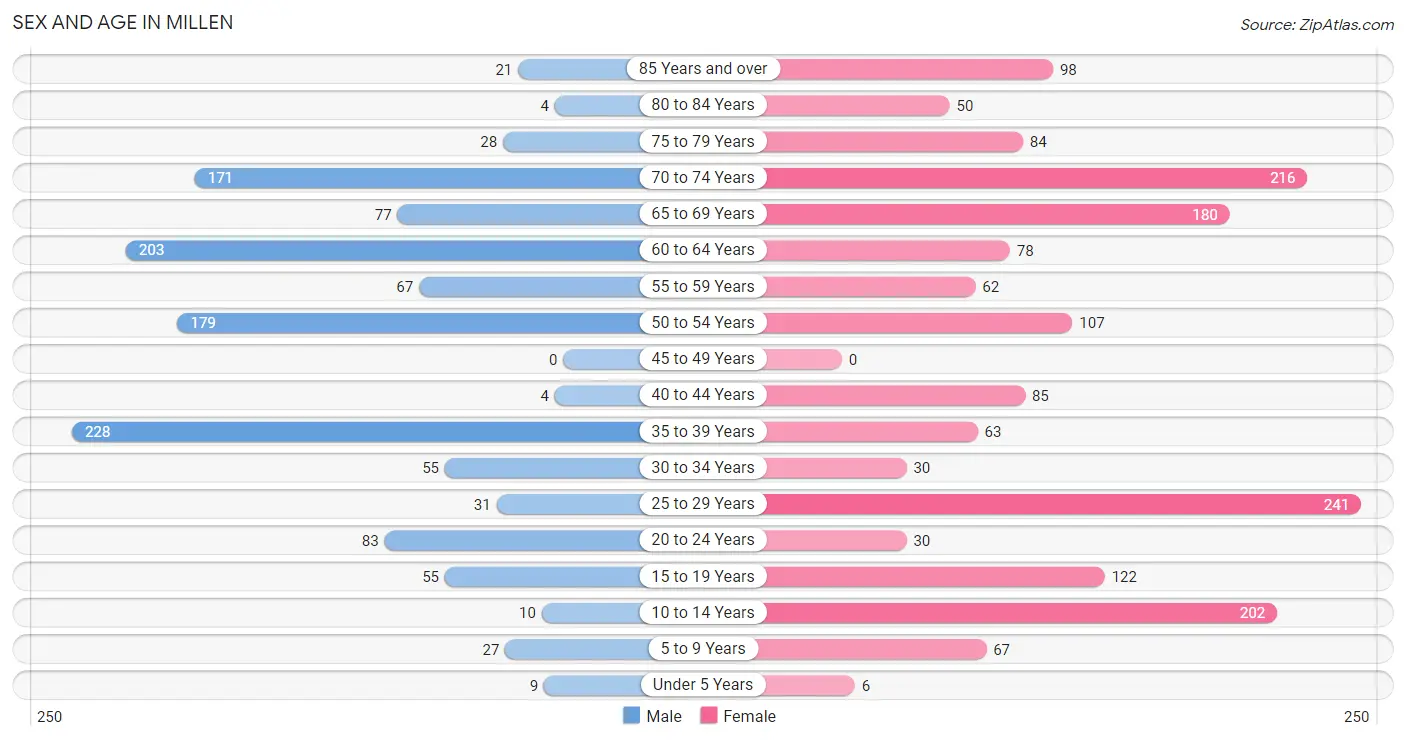
| Age Bracket | Male | Female |
| Under 5 Years | 9 (0.7%) | 6 (0.4%) |
| 5 to 9 Years | 27 (2.2%) | 67 (3.9%) |
| 10 to 14 Years | 10 (0.8%) | 202 (11.7%) |
| 15 to 19 Years | 55 (4.4%) | 122 (7.1%) |
| 20 to 24 Years | 83 (6.6%) | 30 (1.7%) |
| 25 to 29 Years | 31 (2.5%) | 241 (14.0%) |
| 30 to 34 Years | 55 (4.4%) | 30 (1.7%) |
| 35 to 39 Years | 228 (18.2%) | 63 (3.7%) |
| 40 to 44 Years | 4 (0.3%) | 85 (4.9%) |
| 45 to 49 Years | 0 (0.0%) | 0 (0.0%) |
| 50 to 54 Years | 179 (14.3%) | 107 (6.2%) |
| 55 to 59 Years | 67 (5.3%) | 62 (3.6%) |
| 60 to 64 Years | 203 (16.2%) | 78 (4.5%) |
| 65 to 69 Years | 77 (6.1%) | 180 (10.5%) |
| 70 to 74 Years | 171 (13.7%) | 216 (12.6%) |
| 75 to 79 Years | 28 (2.2%) | 84 (4.9%) |
| 80 to 84 Years | 4 (0.3%) | 50 (2.9%) |
| 85 Years and over | 21 (1.7%) | 98 (5.7%) |
| Total | 1,252 (100.0%) | 1,721 (100.0%) |
Families and Households in Millen
Median Family Size in Millen
The median family size in Millen is 3.21 persons per family, with single female/mother families (240 | 36.0%) accounting for the largest median family size of 4.28 persons per family. On the other hand, single male/father families (45 | 6.8%) represent the smallest median family size with 2.49 persons per family.
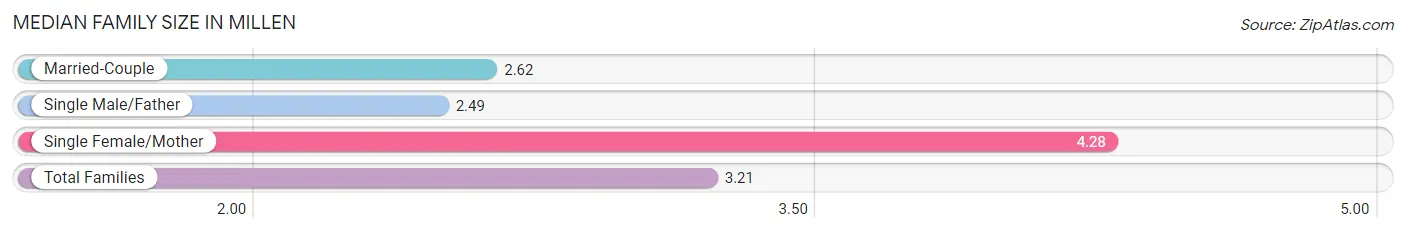
| Family Type | # Families | Family Size |
| Married-Couple | 381 (57.2%) | 2.62 |
| Single Male/Father | 45 (6.8%) | 2.49 |
| Single Female/Mother | 240 (36.0%) | 4.28 |
| Total Families | 666 (100.0%) | 3.21 |
Median Household Size in Millen
The median household size in Millen is 2.51 persons per household, with single female/mother households (240 | 20.8%) accounting for the largest median household size of 4.66 persons per household. non-family households (485 | 42.1%) represent the smallest median household size with 1.34 persons per household.
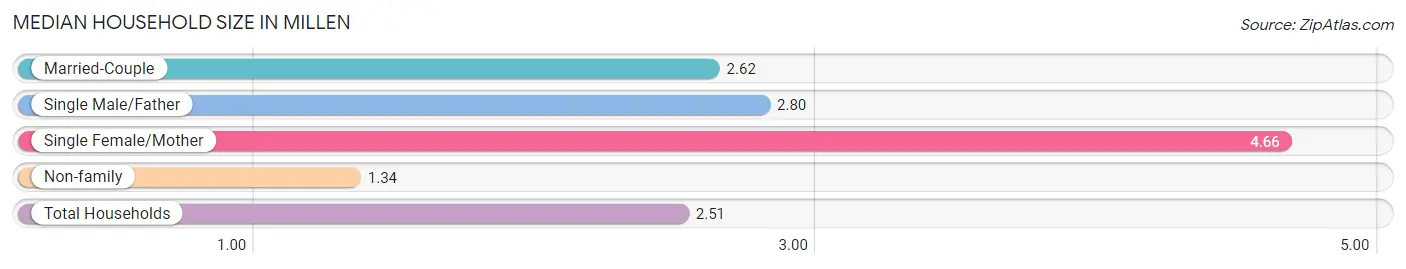
| Household Type | # Households | Household Size |
| Married-Couple | 381 (33.1%) | 2.62 |
| Single Male/Father | 45 (3.9%) | 2.80 |
| Single Female/Mother | 240 (20.8%) | 4.66 |
| Non-family | 485 (42.1%) | 1.34 |
| Total Households | 1,151 (100.0%) | 2.51 |
Household Size by Marriage Status in Millen
Out of a total of 1,151 households in Millen, 666 (57.9%) are family households, while 485 (42.1%) are nonfamily households. The most numerous type of family households are 2-person households, comprising 346, and the most common type of nonfamily households are 1-person households, comprising 396.
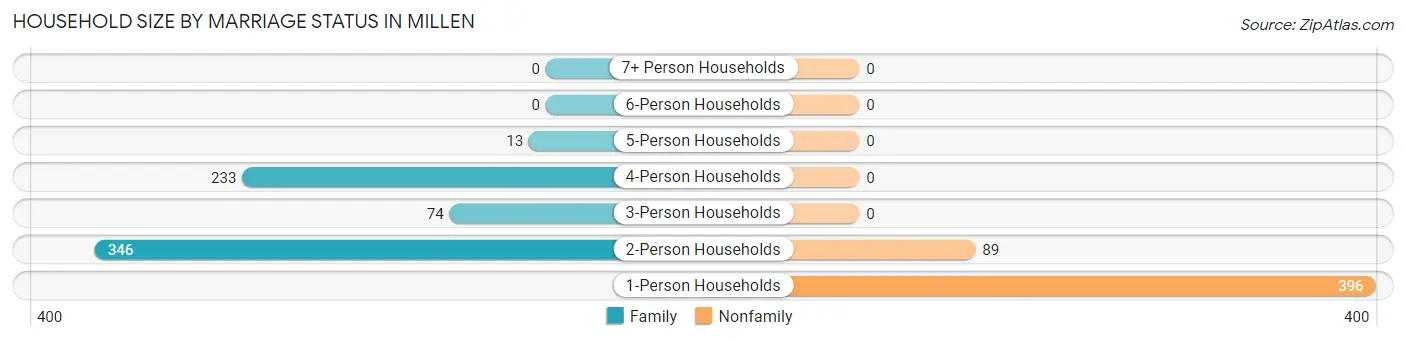
| Household Size | Family Households | Nonfamily Households |
| 1-Person Households | - | 396 (34.4%) |
| 2-Person Households | 346 (30.1%) | 89 (7.7%) |
| 3-Person Households | 74 (6.4%) | 0 (0.0%) |
| 4-Person Households | 233 (20.2%) | 0 (0.0%) |
| 5-Person Households | 13 (1.1%) | 0 (0.0%) |
| 6-Person Households | 0 (0.0%) | 0 (0.0%) |
| 7+ Person Households | 0 (0.0%) | 0 (0.0%) |
| Total | 666 (57.9%) | 485 (42.1%) |
Female Fertility in Millen
Fertility by Age in Millen
| Age Bracket | Women with Births | Births / 1,000 Women |
| 15 to 19 years | 0 (0.0%) | 0.0 |
| 20 to 34 years | 0 (0.0%) | 0.0 |
| 35 to 50 years | 0 (0.0%) | 0.0 |
| Total | 0 (0.0%) | 0.0 |
Fertility by Age by Marriage Status in Millen
| Age Bracket | Married | Unmarried |
| 15 to 19 years | 0 (0.0%) | 0 (0.0%) |
| 20 to 34 years | 0 (0.0%) | 0 (0.0%) |
| 35 to 50 years | 0 (0.0%) | 0 (0.0%) |
| Total | 0 (0.0%) | 0 (0.0%) |
Fertility by Education in Millen
| Educational Attainment | Women with Births | Births / 1,000 Women |
| Less than High School | 0 (0.0%) | 0.0 |
| High School Diploma | 0 (0.0%) | 0.0 |
| College or Associate's Degree | 0 (0.0%) | 0.0 |
| Bachelor's Degree | 0 (0.0%) | 0.0 |
| Graduate Degree | 0 (0.0%) | 0.0 |
| Total | 0 (0.0%) | 0.0 |
Fertility by Education by Marriage Status in Millen
| Educational Attainment | Married | Unmarried |
| Less than High School | 0 (0.0%) | 0 (0.0%) |
| High School Diploma | 0 (0.0%) | 0 (0.0%) |
| College or Associate's Degree | 0 (0.0%) | 0 (0.0%) |
| Bachelor's Degree | 0 (0.0%) | 0 (0.0%) |
| Graduate Degree | 0 (0.0%) | 0 (0.0%) |
| Total | 0 (0.0%) | 0 (0.0%) |
Employment Characteristics in Millen
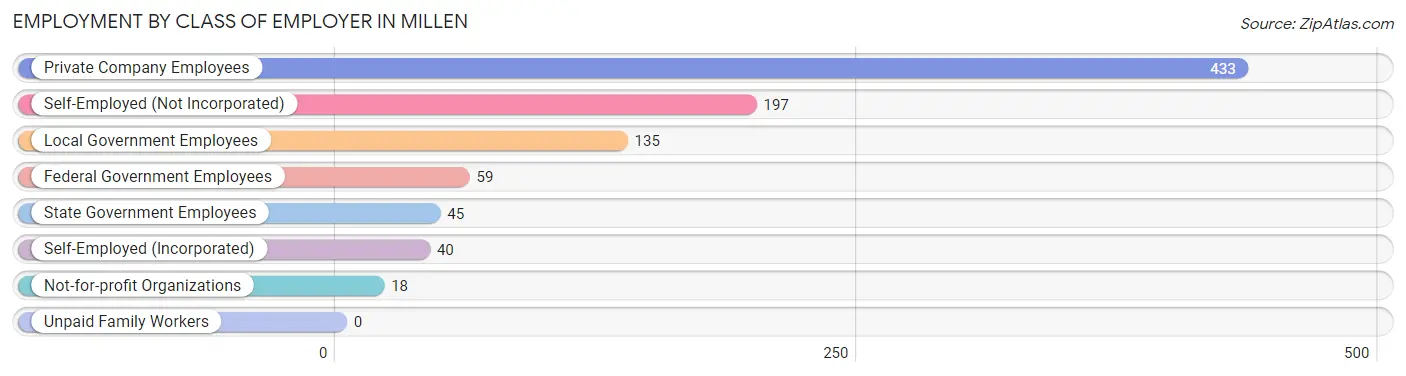
Employment by Class of Employer in Millen
Among the 927 employed individuals in Millen, private company employees (433 | 46.7%), self-employed (not incorporated) (197 | 21.2%), and local government employees (135 | 14.6%) make up the most common classes of employment.
| Employer Class | # Employees | % Employees |
| Private Company Employees | 433 | 46.7% |
| Self-Employed (Incorporated) | 40 | 4.3% |
| Self-Employed (Not Incorporated) | 197 | 21.2% |
| Not-for-profit Organizations | 18 | 1.9% |
| Local Government Employees | 135 | 14.6% |
| State Government Employees | 45 | 4.9% |
| Federal Government Employees | 59 | 6.4% |
| Unpaid Family Workers | 0 | 0.0% |
| Total | 927 | 100.0% |
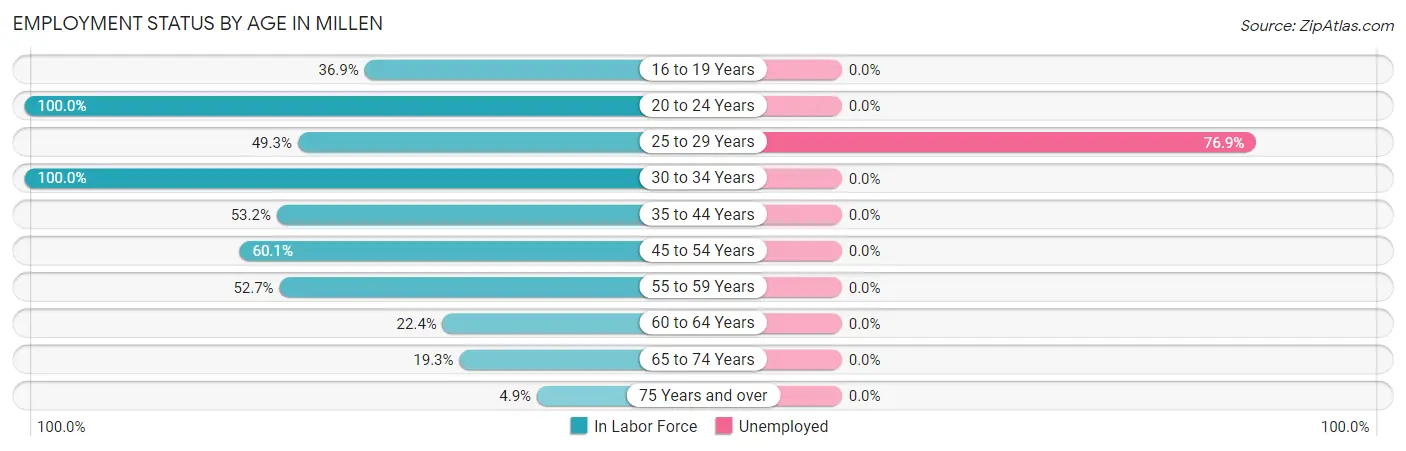
Employment Status by Age in Millen
According to the labor force statistics for Millen, out of the total population over 16 years of age (2,624), 39.3% or 1,031 individuals are in the labor force, with 10.0% or 103 of them unemployed. The age group with the highest labor force participation rate is 20 to 24 years, with 100.0% or 113 individuals in the labor force. Within the labor force, the 25 to 29 years age range has the highest percentage of unemployed individuals, with 76.9% or 103 of them being unemployed.
| Age Bracket | In Labor Force | Unemployed |
| 16 to 19 Years | 55 (36.9%) | 0 (0.0%) |
| 20 to 24 Years | 113 (100.0%) | 0 (0.0%) |
| 25 to 29 Years | 134 (49.3%) | 103 (76.9%) |
| 30 to 34 Years | 85 (100.0%) | 0 (0.0%) |
| 35 to 44 Years | 202 (53.2%) | 0 (0.0%) |
| 45 to 54 Years | 172 (60.1%) | 0 (0.0%) |
| 55 to 59 Years | 68 (52.7%) | 0 (0.0%) |
| 60 to 64 Years | 63 (22.4%) | 0 (0.0%) |
| 65 to 74 Years | 124 (19.3%) | 0 (0.0%) |
| 75 Years and over | 14 (4.9%) | 0 (0.0%) |
| Total | 1,031 (39.3%) | 103 (10.0%) |
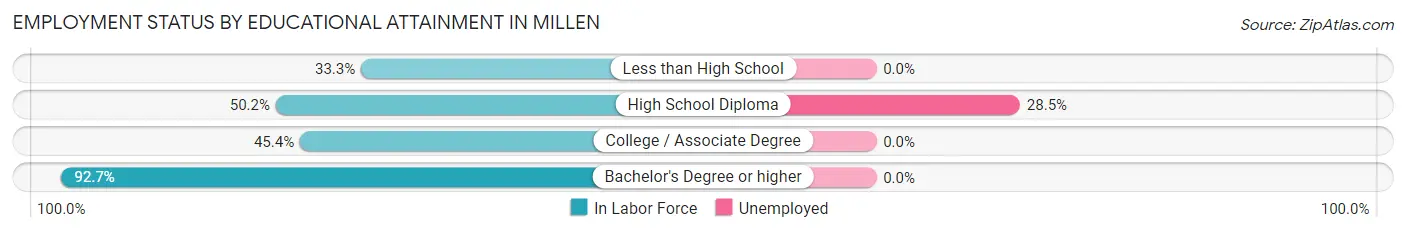
Employment Status by Educational Attainment in Millen
According to labor force statistics for Millen, 50.5% of individuals (724) out of the total population between 25 and 64 years of age (1,433) are in the labor force, with 14.2% or 103 of them being unemployed. The group with the highest labor force participation rate are those with the educational attainment of bachelor's degree or higher, with 92.7% or 127 individuals in the labor force. Within the labor force, individuals with high school diploma education have the highest percentage of unemployment, with 28.5% or 103 of them being unemployed.
| Educational Attainment | In Labor Force | Unemployed |
| Less than High School | 72 (33.3%) | 0 (0.0%) |
| High School Diploma | 361 (50.2%) | 205 (28.5%) |
| College / Associate Degree | 164 (45.4%) | 0 (0.0%) |
| Bachelor's Degree or higher | 127 (92.7%) | 0 (0.0%) |
| Total | 724 (50.5%) | 203 (14.2%) |
Employment Occupations by Sex in Millen
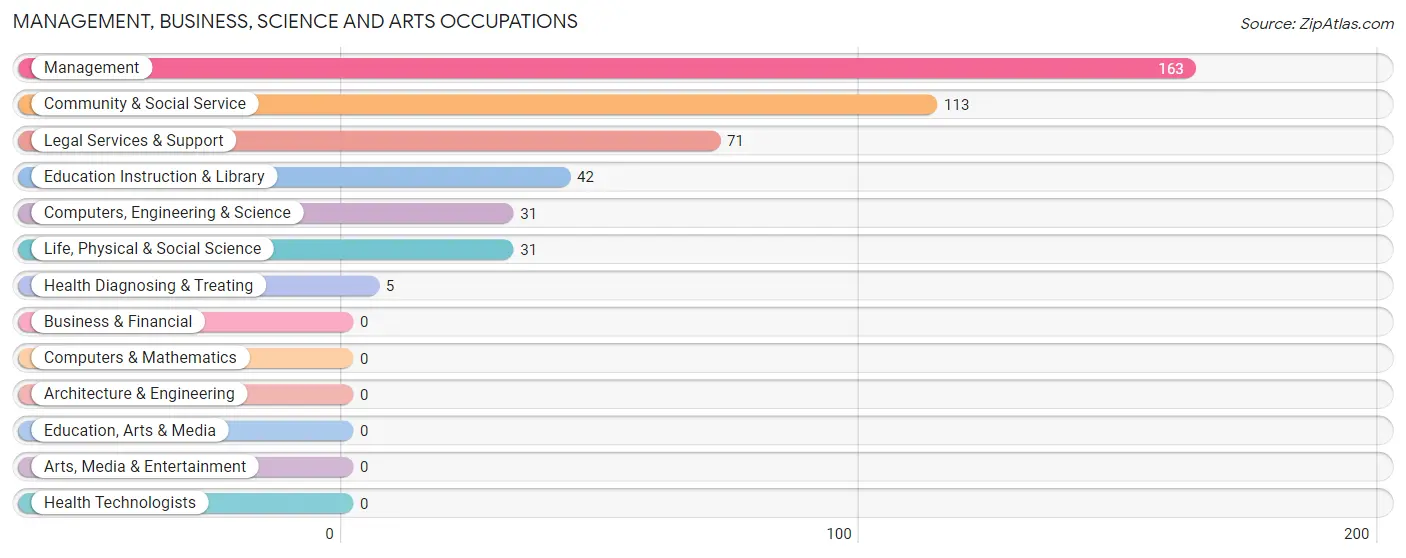
Management, Business, Science and Arts Occupations
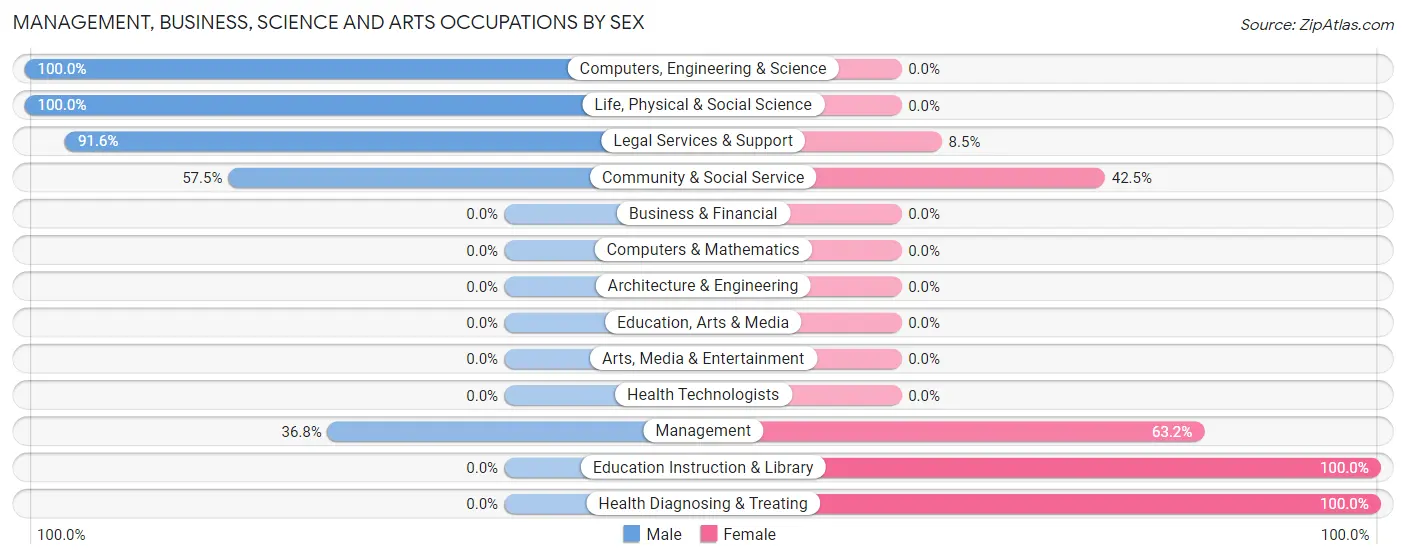
The most common Management, Business, Science and Arts occupations in Millen are Management (163 | 17.6%), Community & Social Service (113 | 12.2%), Legal Services & Support (71 | 7.7%), Education Instruction & Library (42 | 4.5%), and Computers, Engineering & Science (31 | 3.3%).
Management, Business, Science and Arts Occupations by Sex
Within the Management, Business, Science and Arts occupations in Millen, the most male-oriented occupations are Computers, Engineering & Science (100.0%), Life, Physical & Social Science (100.0%), and Legal Services & Support (91.5%), while the most female-oriented occupations are Education Instruction & Library (100.0%), Health Diagnosing & Treating (100.0%), and Management (63.2%).
| Occupation | Male | Female |
| Management | 60 (36.8%) | 103 (63.2%) |
| Business & Financial | 0 (0.0%) | 0 (0.0%) |
| Computers, Engineering & Science | 31 (100.0%) | 0 (0.0%) |
| Computers & Mathematics | 0 (0.0%) | 0 (0.0%) |
| Architecture & Engineering | 0 (0.0%) | 0 (0.0%) |
| Life, Physical & Social Science | 31 (100.0%) | 0 (0.0%) |
| Community & Social Service | 65 (57.5%) | 48 (42.5%) |
| Education, Arts & Media | 0 (0.0%) | 0 (0.0%) |
| Legal Services & Support | 65 (91.5%) | 6 (8.5%) |
| Education Instruction & Library | 0 (0.0%) | 42 (100.0%) |
| Arts, Media & Entertainment | 0 (0.0%) | 0 (0.0%) |
| Health Diagnosing & Treating | 0 (0.0%) | 5 (100.0%) |
| Health Technologists | 0 (0.0%) | 0 (0.0%) |
| Total (Category) | 156 (50.0%) | 156 (50.0%) |
| Total (Overall) | 478 (51.6%) | 449 (48.4%) |
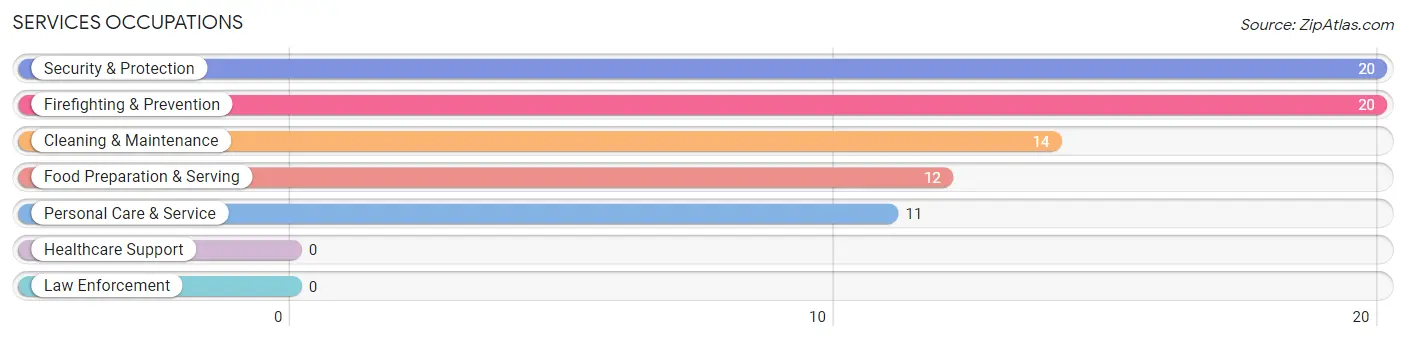
Services Occupations
The most common Services occupations in Millen are Security & Protection (20 | 2.2%), Firefighting & Prevention (20 | 2.2%), Cleaning & Maintenance (14 | 1.5%), Food Preparation & Serving (12 | 1.3%), and Personal Care & Service (11 | 1.2%).
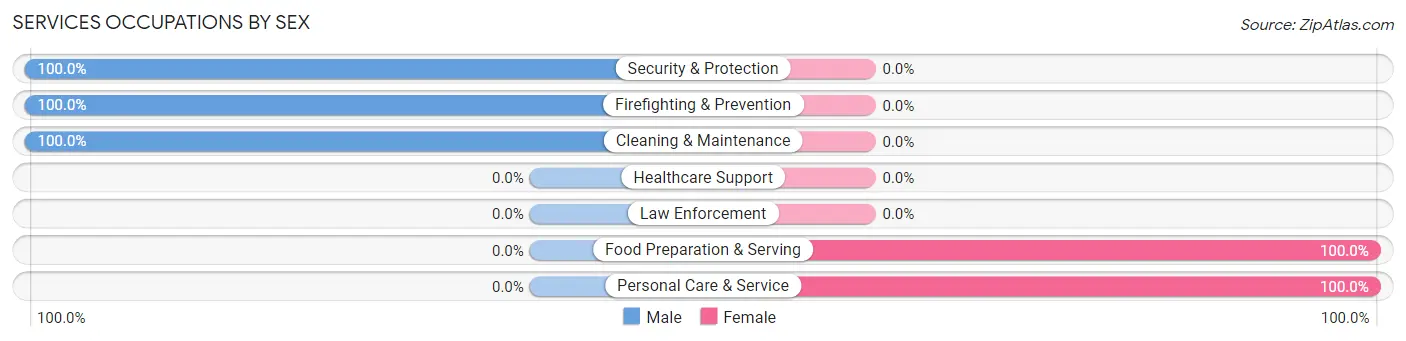
Services Occupations by Sex
Within the Services occupations in Millen, the most male-oriented occupations are Security & Protection (100.0%), Firefighting & Prevention (100.0%), and Cleaning & Maintenance (100.0%), while the most female-oriented occupations are Food Preparation & Serving (100.0%), and Personal Care & Service (100.0%).
| Occupation | Male | Female |
| Healthcare Support | 0 (0.0%) | 0 (0.0%) |
| Security & Protection | 20 (100.0%) | 0 (0.0%) |
| Firefighting & Prevention | 20 (100.0%) | 0 (0.0%) |
| Law Enforcement | 0 (0.0%) | 0 (0.0%) |
| Food Preparation & Serving | 0 (0.0%) | 12 (100.0%) |
| Cleaning & Maintenance | 14 (100.0%) | 0 (0.0%) |
| Personal Care & Service | 0 (0.0%) | 11 (100.0%) |
| Total (Category) | 34 (59.7%) | 23 (40.4%) |
| Total (Overall) | 478 (51.6%) | 449 (48.4%) |
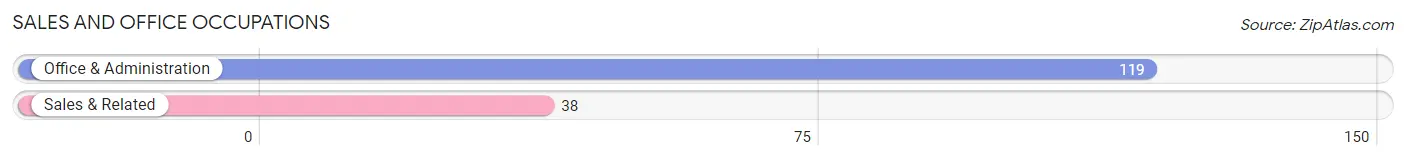
Sales and Office Occupations
The most common Sales and Office occupations in Millen are Office & Administration (119 | 12.8%), and Sales & Related (38 | 4.1%).
Sales and Office Occupations by Sex
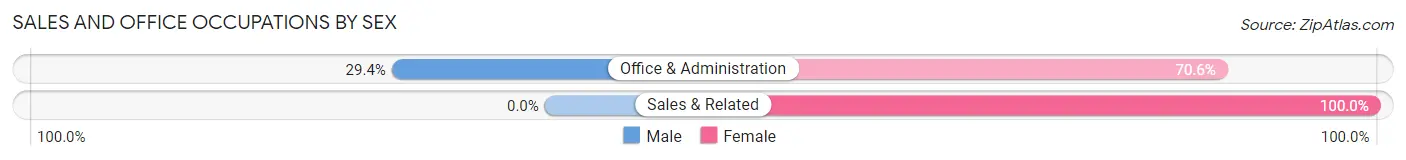
| Occupation | Male | Female |
| Sales & Related | 0 (0.0%) | 38 (100.0%) |
| Office & Administration | 35 (29.4%) | 84 (70.6%) |
| Total (Category) | 35 (22.3%) | 122 (77.7%) |
| Total (Overall) | 478 (51.6%) | 449 (48.4%) |
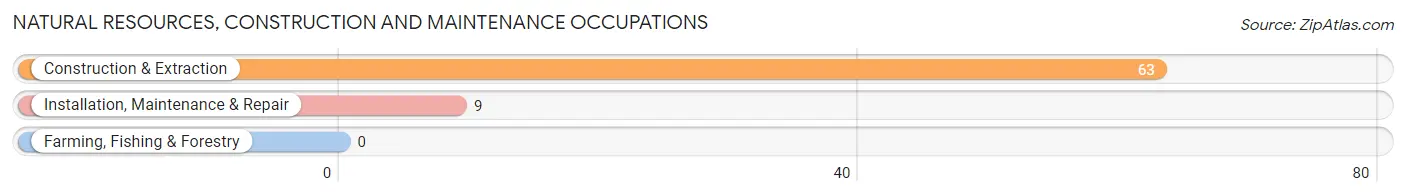
Natural Resources, Construction and Maintenance Occupations
The most common Natural Resources, Construction and Maintenance occupations in Millen are Construction & Extraction (63 | 6.8%), and Installation, Maintenance & Repair (9 | 1.0%).
Natural Resources, Construction and Maintenance Occupations by Sex
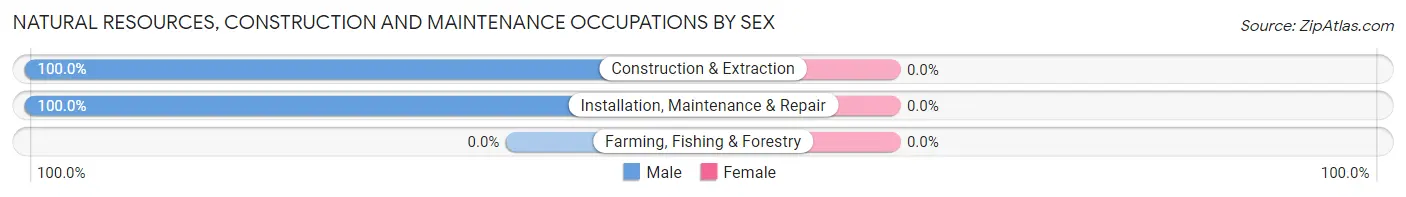
| Occupation | Male | Female |
| Farming, Fishing & Forestry | 0 (0.0%) | 0 (0.0%) |
| Construction & Extraction | 63 (100.0%) | 0 (0.0%) |
| Installation, Maintenance & Repair | 9 (100.0%) | 0 (0.0%) |
| Total (Category) | 72 (100.0%) | 0 (0.0%) |
| Total (Overall) | 478 (51.6%) | 449 (48.4%) |
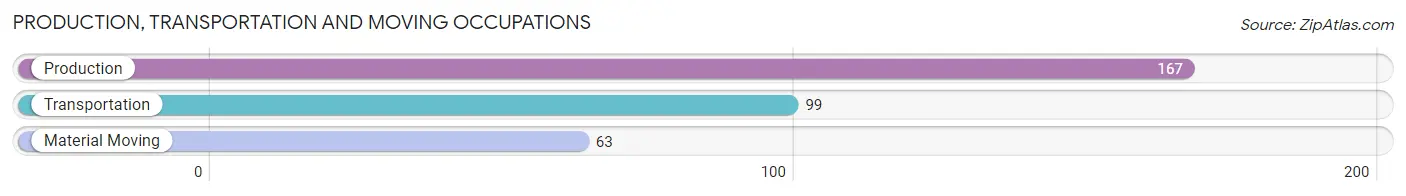
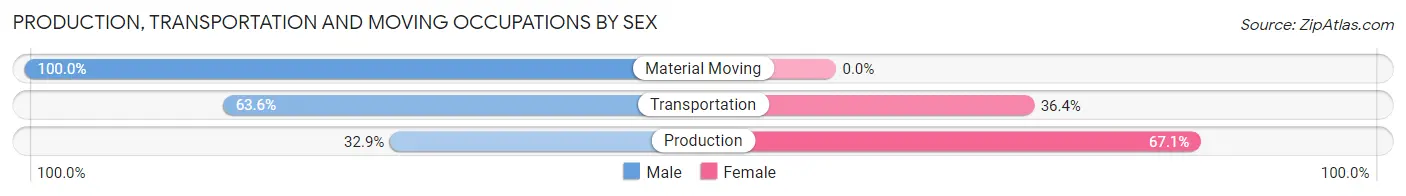
Production, Transportation and Moving Occupations
The most common Production, Transportation and Moving occupations in Millen are Production (167 | 18.0%), Transportation (99 | 10.7%), and Material Moving (63 | 6.8%).
Production, Transportation and Moving Occupations by Sex
| Occupation | Male | Female |
| Production | 55 (32.9%) | 112 (67.1%) |
| Transportation | 63 (63.6%) | 36 (36.4%) |
| Material Moving | 63 (100.0%) | 0 (0.0%) |
| Total (Category) | 181 (55.0%) | 148 (45.0%) |
| Total (Overall) | 478 (51.6%) | 449 (48.4%) |
Employment Industries by Sex in Millen
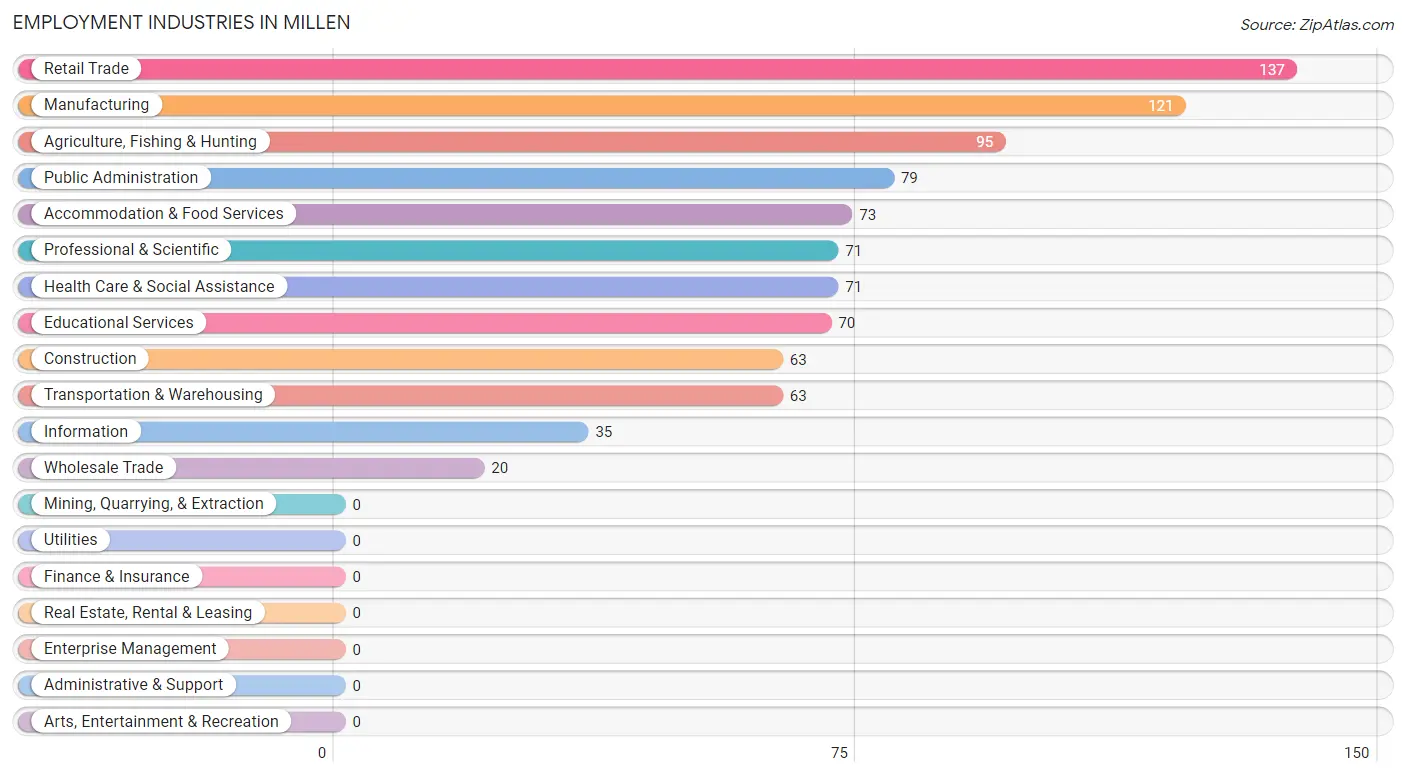
Employment Industries in Millen
The major employment industries in Millen include Retail Trade (137 | 14.8%), Manufacturing (121 | 13.1%), Agriculture, Fishing & Hunting (95 | 10.2%), Public Administration (79 | 8.5%), and Accommodation & Food Services (73 | 7.9%).
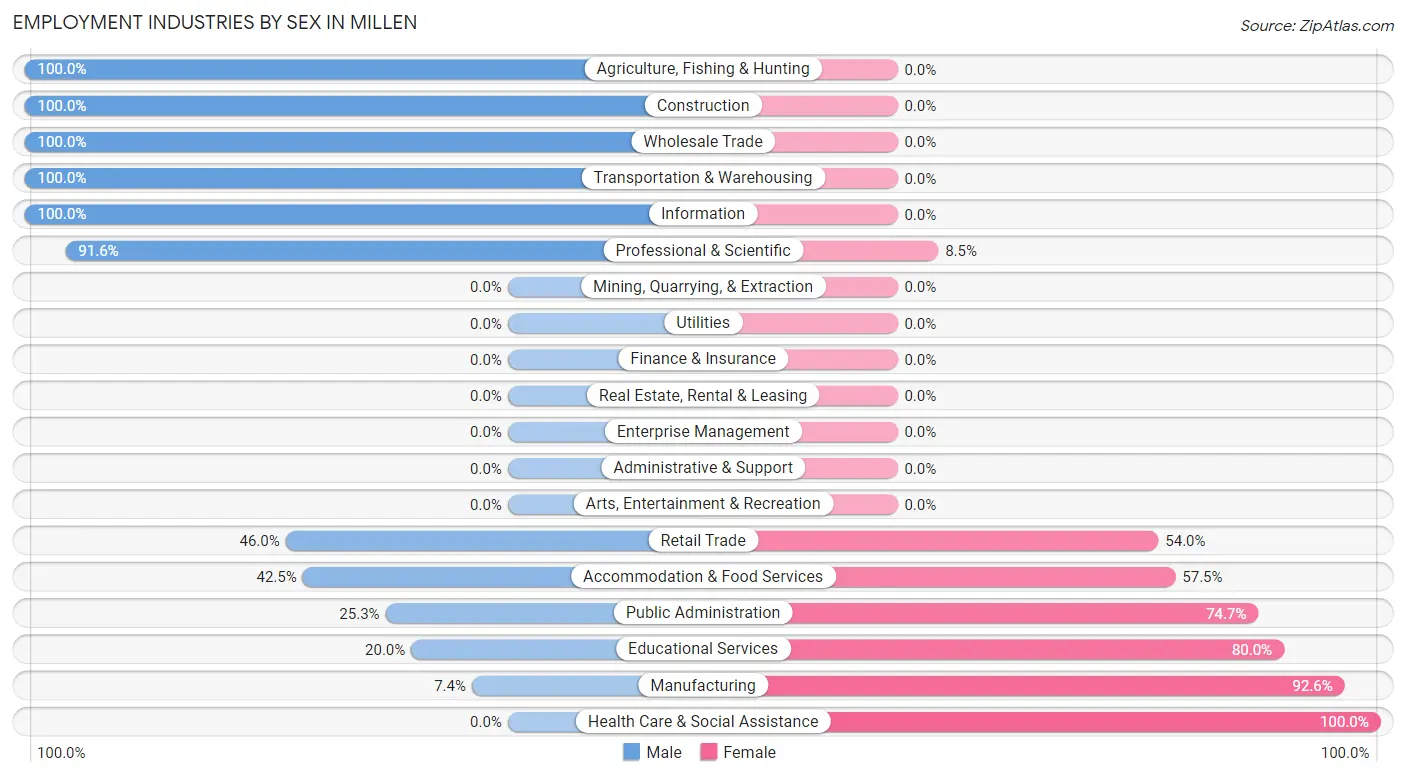
Employment Industries by Sex in Millen
The Millen industries that see more men than women are Agriculture, Fishing & Hunting (100.0%), Construction (100.0%), and Wholesale Trade (100.0%), whereas the industries that tend to have a higher number of women are Health Care & Social Assistance (100.0%), Manufacturing (92.6%), and Educational Services (80.0%).
| Industry | Male | Female |
| Agriculture, Fishing & Hunting | 95 (100.0%) | 0 (0.0%) |
| Mining, Quarrying, & Extraction | 0 (0.0%) | 0 (0.0%) |
| Construction | 63 (100.0%) | 0 (0.0%) |
| Manufacturing | 9 (7.4%) | 112 (92.6%) |
| Wholesale Trade | 20 (100.0%) | 0 (0.0%) |
| Retail Trade | 63 (46.0%) | 74 (54.0%) |
| Transportation & Warehousing | 63 (100.0%) | 0 (0.0%) |
| Utilities | 0 (0.0%) | 0 (0.0%) |
| Information | 35 (100.0%) | 0 (0.0%) |
| Finance & Insurance | 0 (0.0%) | 0 (0.0%) |
| Real Estate, Rental & Leasing | 0 (0.0%) | 0 (0.0%) |
| Professional & Scientific | 65 (91.5%) | 6 (8.5%) |
| Enterprise Management | 0 (0.0%) | 0 (0.0%) |
| Administrative & Support | 0 (0.0%) | 0 (0.0%) |
| Educational Services | 14 (20.0%) | 56 (80.0%) |
| Health Care & Social Assistance | 0 (0.0%) | 71 (100.0%) |
| Arts, Entertainment & Recreation | 0 (0.0%) | 0 (0.0%) |
| Accommodation & Food Services | 31 (42.5%) | 42 (57.5%) |
| Public Administration | 20 (25.3%) | 59 (74.7%) |
| Total | 478 (51.6%) | 449 (48.4%) |
Education in Millen
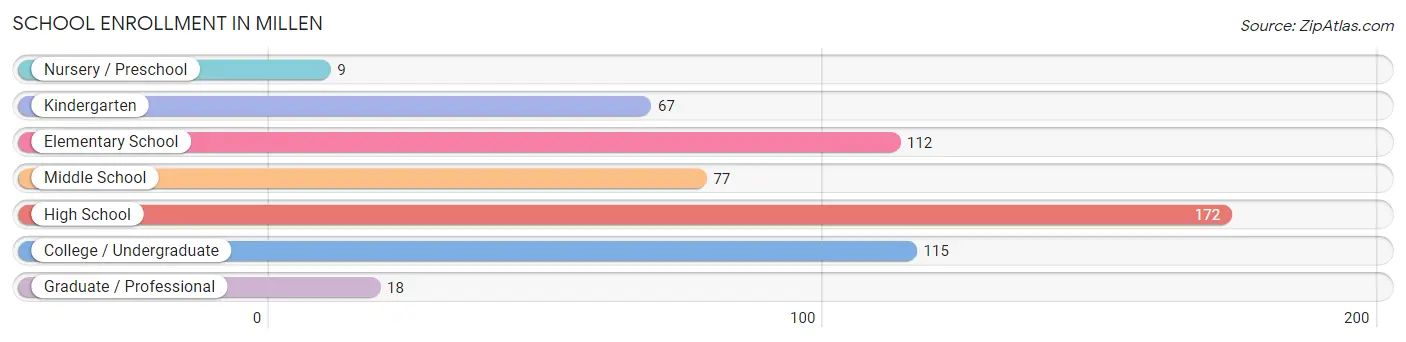
School Enrollment in Millen
The most common levels of schooling among the 570 students in Millen are high school (172 | 30.2%), college / undergraduate (115 | 20.2%), and elementary school (112 | 19.7%).
| School Level | # Students | % Students |
| Nursery / Preschool | 9 | 1.6% |
| Kindergarten | 67 | 11.7% |
| Elementary School | 112 | 19.7% |
| Middle School | 77 | 13.5% |
| High School | 172 | 30.2% |
| College / Undergraduate | 115 | 20.2% |
| Graduate / Professional | 18 | 3.2% |
| Total | 570 | 100.0% |
School Enrollment by Age by Funding Source in Millen
Out of a total of 570 students who are enrolled in schools in Millen, 84 (14.7%) attend a private institution, while the remaining 486 (85.3%) are enrolled in public schools. The age group of 15 to 17 year olds has the highest likelihood of being enrolled in private schools, with 28 (41.8% in the age bracket) enrolled. Conversely, the age group of 3 to 4 year olds has the lowest likelihood of being enrolled in a private school, with 9 (100.0% in the age bracket) attending a public institution.
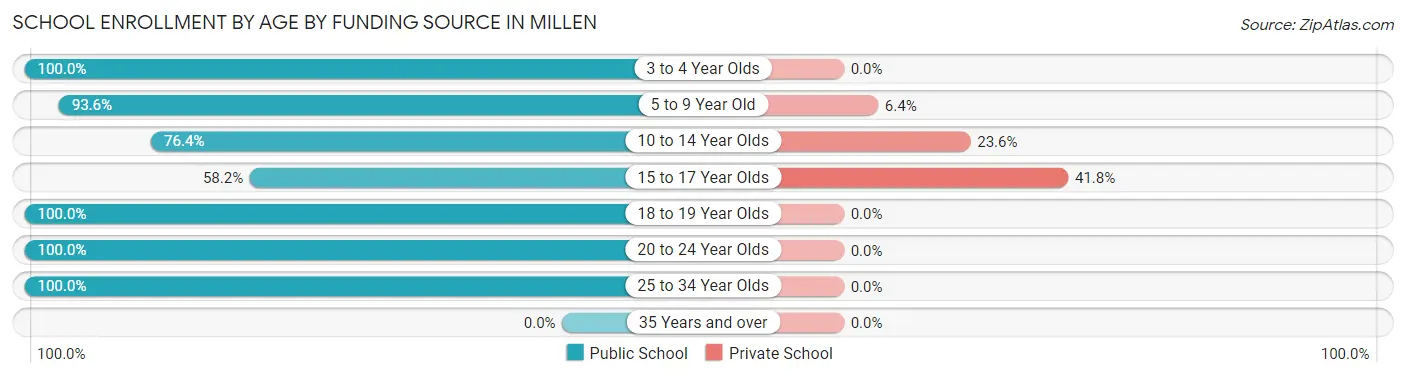
| Age Bracket | Public School | Private School |
| 3 to 4 Year Olds | 9 (100.0%) | 0 (0.0%) |
| 5 to 9 Year Old | 88 (93.6%) | 6 (6.4%) |
| 10 to 14 Year Olds | 162 (76.4%) | 50 (23.6%) |
| 15 to 17 Year Olds | 39 (58.2%) | 28 (41.8%) |
| 18 to 19 Year Olds | 55 (100.0%) | 0 (0.0%) |
| 20 to 24 Year Olds | 30 (100.0%) | 0 (0.0%) |
| 25 to 34 Year Olds | 103 (100.0%) | 0 (0.0%) |
| 35 Years and over | 0 (0.0%) | 0 (0.0%) |
| Total | 486 (85.3%) | 84 (14.7%) |
Educational Attainment by Field of Study in Millen
Literature & languages (65 | 24.8%), computers & mathematics (51 | 19.5%), arts & humanities (51 | 19.5%), education (48 | 18.3%), and bio, nature & agricultural (31 | 11.8%) are the most common fields of study among 262 individuals in Millen who have obtained a bachelor's degree or higher.
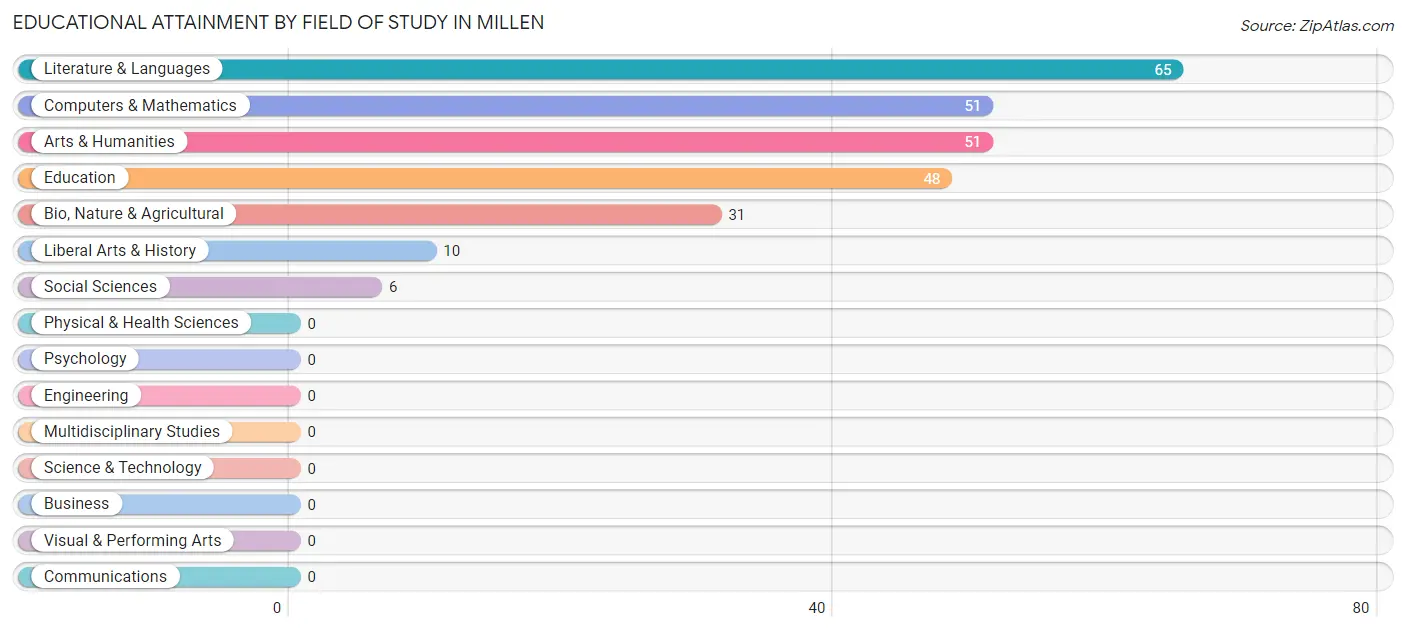
| Field of Study | # Graduates | % Graduates |
| Computers & Mathematics | 51 | 19.5% |
| Bio, Nature & Agricultural | 31 | 11.8% |
| Physical & Health Sciences | 0 | 0.0% |
| Psychology | 0 | 0.0% |
| Social Sciences | 6 | 2.3% |
| Engineering | 0 | 0.0% |
| Multidisciplinary Studies | 0 | 0.0% |
| Science & Technology | 0 | 0.0% |
| Business | 0 | 0.0% |
| Education | 48 | 18.3% |
| Literature & Languages | 65 | 24.8% |
| Liberal Arts & History | 10 | 3.8% |
| Visual & Performing Arts | 0 | 0.0% |
| Communications | 0 | 0.0% |
| Arts & Humanities | 51 | 19.5% |
| Total | 262 | 100.0% |
Transportation & Commute in Millen
Vehicle Availability by Sex in Millen
The most prevalent vehicle ownership categories in Millen are males with 2 vehicles (370, accounting for 77.4%) and females with 2 vehicles (233, making up 82.4%).
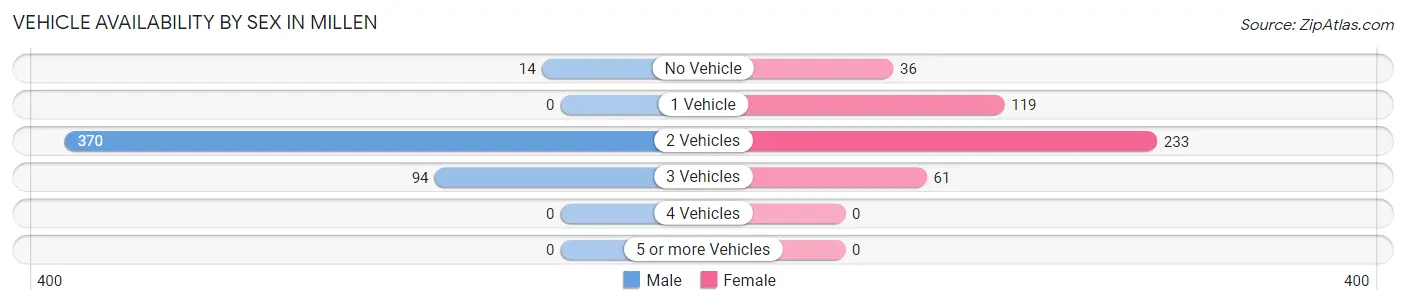
| Vehicles Available | Male | Female |
| No Vehicle | 14 (2.9%) | 36 (8.0%) |
| 1 Vehicle | 0 (0.0%) | 119 (26.5%) |
| 2 Vehicles | 370 (77.4%) | 233 (51.9%) |
| 3 Vehicles | 94 (19.7%) | 61 (13.6%) |
| 4 Vehicles | 0 (0.0%) | 0 (0.0%) |
| 5 or more Vehicles | 0 (0.0%) | 0 (0.0%) |
| Total | 478 (100.0%) | 449 (100.0%) |
Commute Time in Millen
The most frequently occuring commute durations in Millen are 5 to 9 minutes (272 commuters, 29.7%), 10 to 14 minutes (200 commuters, 21.8%), and less than 5 minutes (160 commuters, 17.5%).
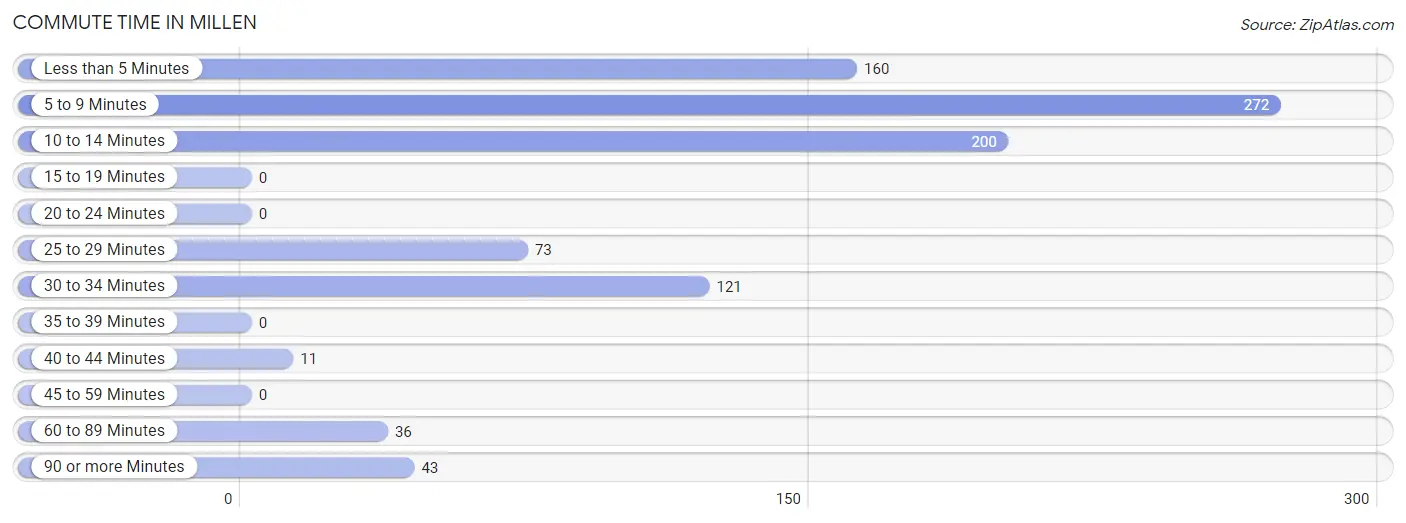
| Commute Time | # Commuters | % Commuters |
| Less than 5 Minutes | 160 | 17.5% |
| 5 to 9 Minutes | 272 | 29.7% |
| 10 to 14 Minutes | 200 | 21.8% |
| 15 to 19 Minutes | 0 | 0.0% |
| 20 to 24 Minutes | 0 | 0.0% |
| 25 to 29 Minutes | 73 | 8.0% |
| 30 to 34 Minutes | 121 | 13.2% |
| 35 to 39 Minutes | 0 | 0.0% |
| 40 to 44 Minutes | 11 | 1.2% |
| 45 to 59 Minutes | 0 | 0.0% |
| 60 to 89 Minutes | 36 | 3.9% |
| 90 or more Minutes | 43 | 4.7% |
Commute Time by Sex in Millen
The most common commute times in Millen are less than 5 minutes (148 commuters, 31.0%) for males and 5 to 9 minutes (200 commuters, 45.7%) for females.
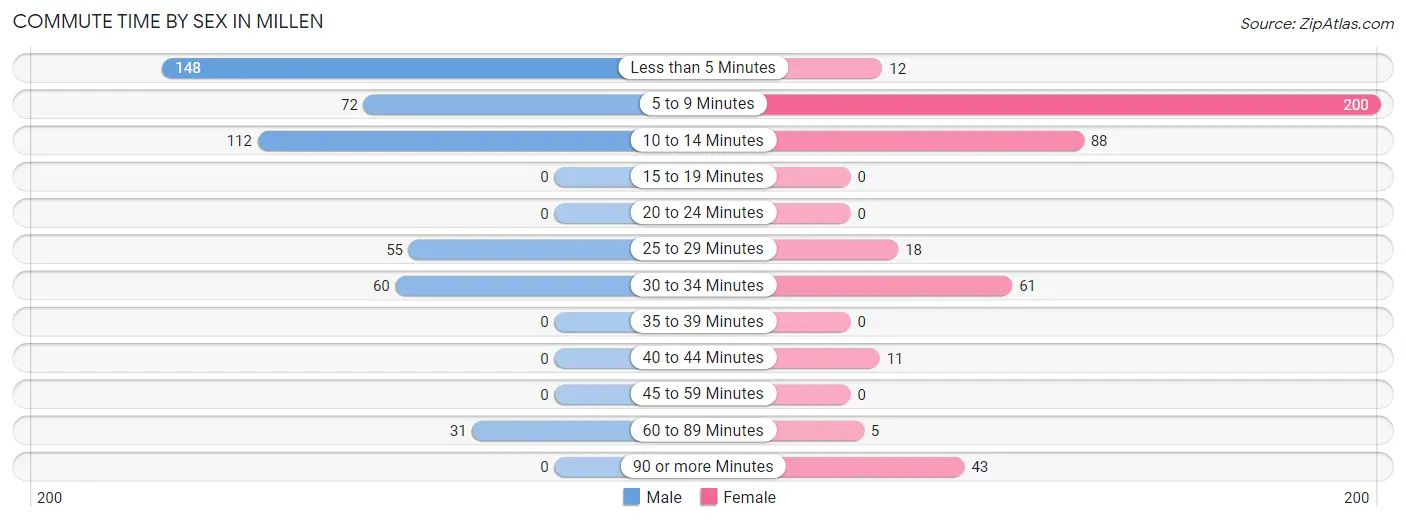
| Commute Time | Male | Female |
| Less than 5 Minutes | 148 (31.0%) | 12 (2.7%) |
| 5 to 9 Minutes | 72 (15.1%) | 200 (45.7%) |
| 10 to 14 Minutes | 112 (23.4%) | 88 (20.1%) |
| 15 to 19 Minutes | 0 (0.0%) | 0 (0.0%) |
| 20 to 24 Minutes | 0 (0.0%) | 0 (0.0%) |
| 25 to 29 Minutes | 55 (11.5%) | 18 (4.1%) |
| 30 to 34 Minutes | 60 (12.6%) | 61 (13.9%) |
| 35 to 39 Minutes | 0 (0.0%) | 0 (0.0%) |
| 40 to 44 Minutes | 0 (0.0%) | 11 (2.5%) |
| 45 to 59 Minutes | 0 (0.0%) | 0 (0.0%) |
| 60 to 89 Minutes | 31 (6.5%) | 5 (1.1%) |
| 90 or more Minutes | 0 (0.0%) | 43 (9.8%) |
Time of Departure to Work by Sex in Millen
The most frequent times of departure to work in Millen are 6:30 AM to 6:59 AM (178, 37.2%) for males and 8:00 AM to 8:29 AM (94, 21.5%) for females.
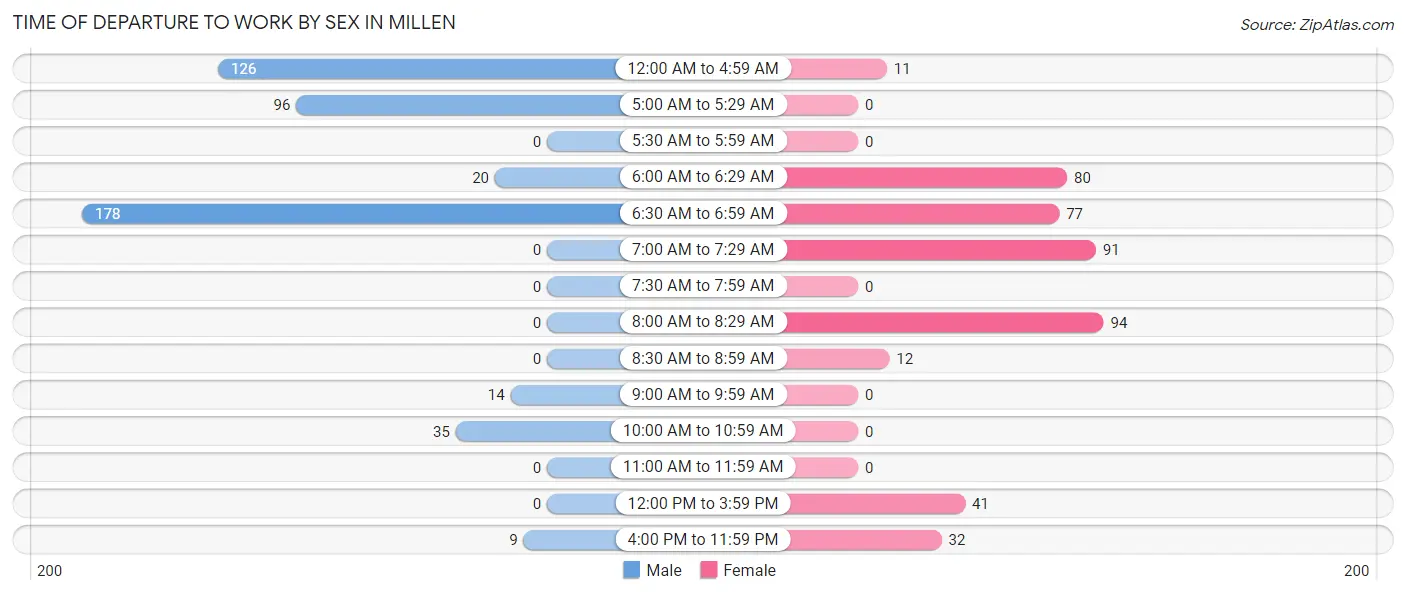
| Time of Departure | Male | Female |
| 12:00 AM to 4:59 AM | 126 (26.4%) | 11 (2.5%) |
| 5:00 AM to 5:29 AM | 96 (20.1%) | 0 (0.0%) |
| 5:30 AM to 5:59 AM | 0 (0.0%) | 0 (0.0%) |
| 6:00 AM to 6:29 AM | 20 (4.2%) | 80 (18.3%) |
| 6:30 AM to 6:59 AM | 178 (37.2%) | 77 (17.6%) |
| 7:00 AM to 7:29 AM | 0 (0.0%) | 91 (20.8%) |
| 7:30 AM to 7:59 AM | 0 (0.0%) | 0 (0.0%) |
| 8:00 AM to 8:29 AM | 0 (0.0%) | 94 (21.5%) |
| 8:30 AM to 8:59 AM | 0 (0.0%) | 12 (2.7%) |
| 9:00 AM to 9:59 AM | 14 (2.9%) | 0 (0.0%) |
| 10:00 AM to 10:59 AM | 35 (7.3%) | 0 (0.0%) |
| 11:00 AM to 11:59 AM | 0 (0.0%) | 0 (0.0%) |
| 12:00 PM to 3:59 PM | 0 (0.0%) | 41 (9.4%) |
| 4:00 PM to 11:59 PM | 9 (1.9%) | 32 (7.3%) |
| Total | 478 (100.0%) | 438 (100.0%) |
Housing Occupancy in Millen
Occupancy by Ownership in Millen
Of the total 1,151 dwellings in Millen, owner-occupied units account for 831 (72.2%), while renter-occupied units make up 320 (27.8%).
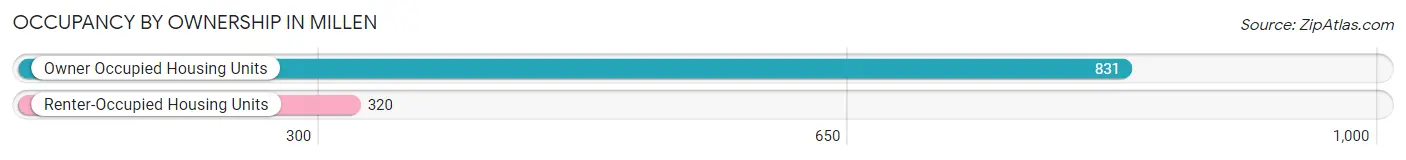
| Occupancy | # Housing Units | % Housing Units |
| Owner Occupied Housing Units | 831 | 72.2% |
| Renter-Occupied Housing Units | 320 | 27.8% |
| Total Occupied Housing Units | 1,151 | 100.0% |
Occupancy by Household Size in Millen
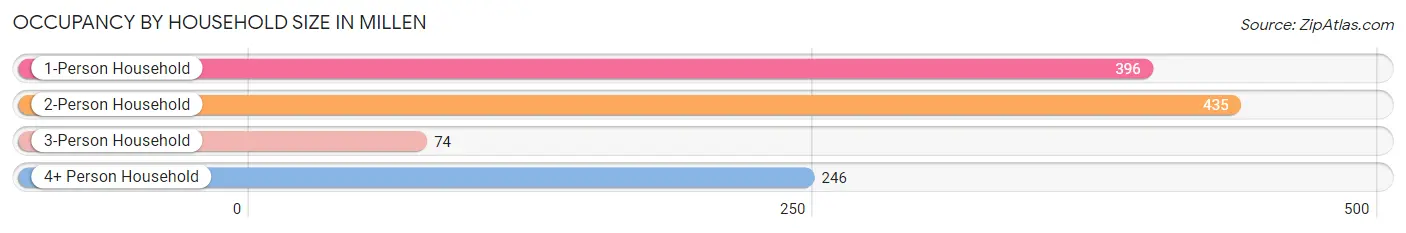
| Household Size | # Housing Units | % Housing Units |
| 1-Person Household | 396 | 34.4% |
| 2-Person Household | 435 | 37.8% |
| 3-Person Household | 74 | 6.4% |
| 4+ Person Household | 246 | 21.4% |
| Total Housing Units | 1,151 | 100.0% |
Occupancy by Ownership by Household Size in Millen
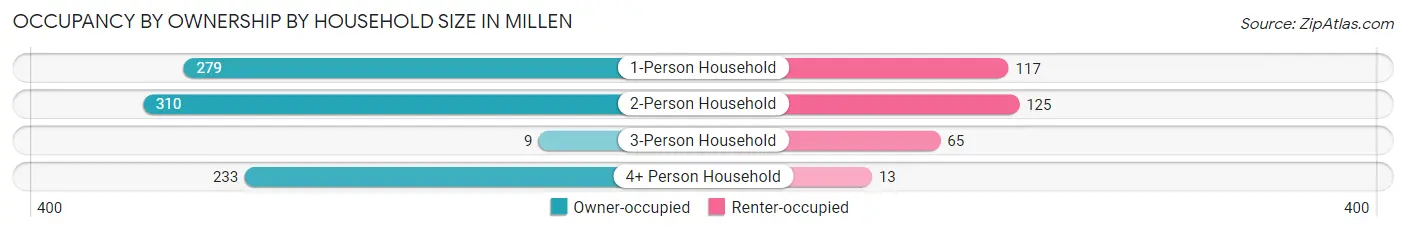
| Household Size | Owner-occupied | Renter-occupied |
| 1-Person Household | 279 (70.5%) | 117 (29.5%) |
| 2-Person Household | 310 (71.3%) | 125 (28.7%) |
| 3-Person Household | 9 (12.2%) | 65 (87.8%) |
| 4+ Person Household | 233 (94.7%) | 13 (5.3%) |
| Total Housing Units | 831 (72.2%) | 320 (27.8%) |
Occupancy by Educational Attainment in Millen
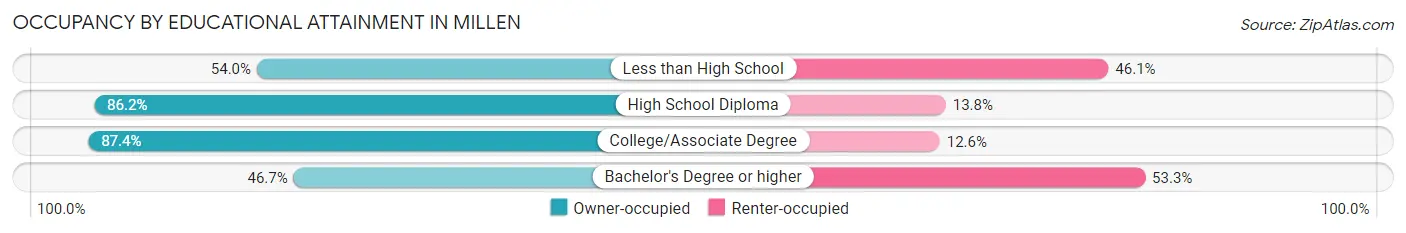
| Household Size | Owner-occupied | Renter-occupied |
| Less than High School | 157 (53.9%) | 134 (46.1%) |
| High School Diploma | 306 (86.2%) | 49 (13.8%) |
| College/Associate Degree | 284 (87.4%) | 41 (12.6%) |
| Bachelor's Degree or higher | 84 (46.7%) | 96 (53.3%) |
Occupancy by Age of Householder in Millen
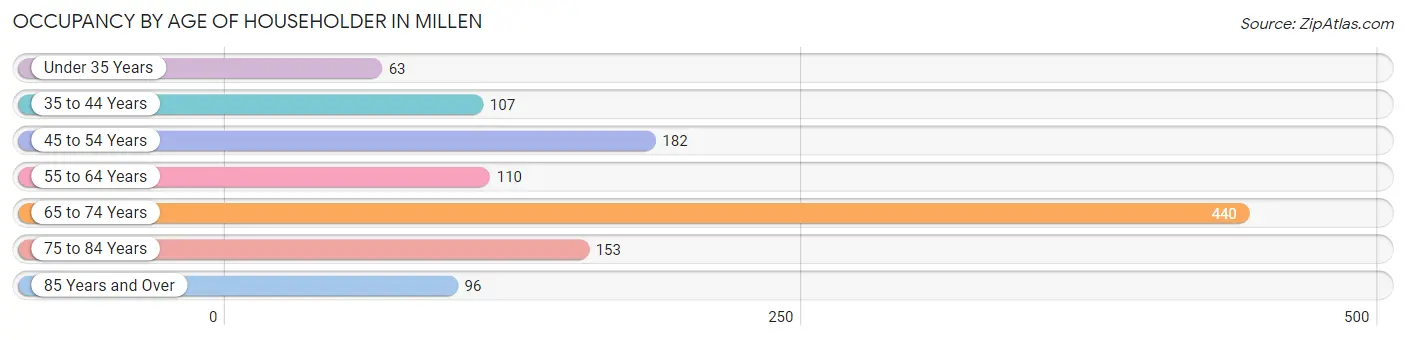
| Age Bracket | # Households | % Households |
| Under 35 Years | 63 | 5.5% |
| 35 to 44 Years | 107 | 9.3% |
| 45 to 54 Years | 182 | 15.8% |
| 55 to 64 Years | 110 | 9.6% |
| 65 to 74 Years | 440 | 38.2% |
| 75 to 84 Years | 153 | 13.3% |
| 85 Years and Over | 96 | 8.3% |
| Total | 1,151 | 100.0% |
Housing Finances in Millen
Median Income by Occupancy in Millen
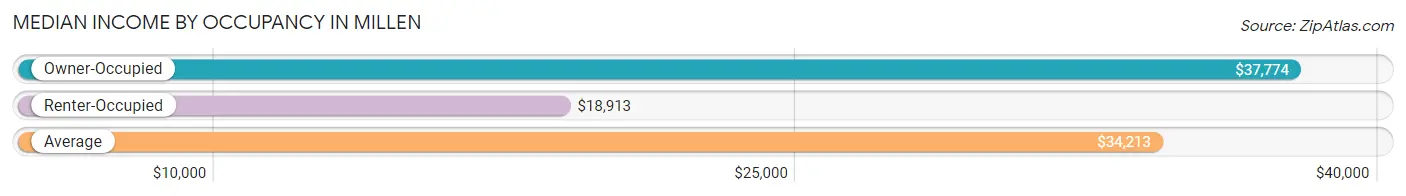
| Occupancy Type | # Households | Median Income |
| Owner-Occupied | 831 (72.2%) | $37,774 |
| Renter-Occupied | 320 (27.8%) | $18,913 |
| Average | 1,151 (100.0%) | $34,213 |
Occupancy by Householder Income Bracket in Millen
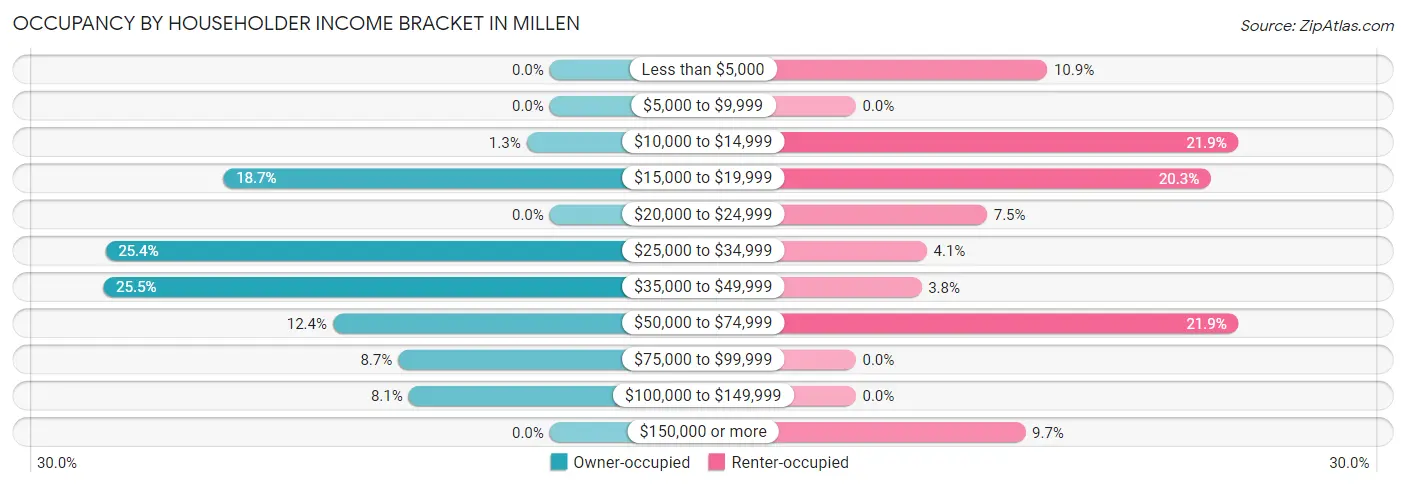
| Income Bracket | Owner-occupied | Renter-occupied |
| Less than $5,000 | 0 (0.0%) | 35 (10.9%) |
| $5,000 to $9,999 | 0 (0.0%) | 0 (0.0%) |
| $10,000 to $14,999 | 11 (1.3%) | 70 (21.9%) |
| $15,000 to $19,999 | 155 (18.6%) | 65 (20.3%) |
| $20,000 to $24,999 | 0 (0.0%) | 24 (7.5%) |
| $25,000 to $34,999 | 211 (25.4%) | 13 (4.1%) |
| $35,000 to $49,999 | 212 (25.5%) | 12 (3.7%) |
| $50,000 to $74,999 | 103 (12.4%) | 70 (21.9%) |
| $75,000 to $99,999 | 72 (8.7%) | 0 (0.0%) |
| $100,000 to $149,999 | 67 (8.1%) | 0 (0.0%) |
| $150,000 or more | 0 (0.0%) | 31 (9.7%) |
| Total | 831 (100.0%) | 320 (100.0%) |
Monthly Housing Cost Tiers in Millen
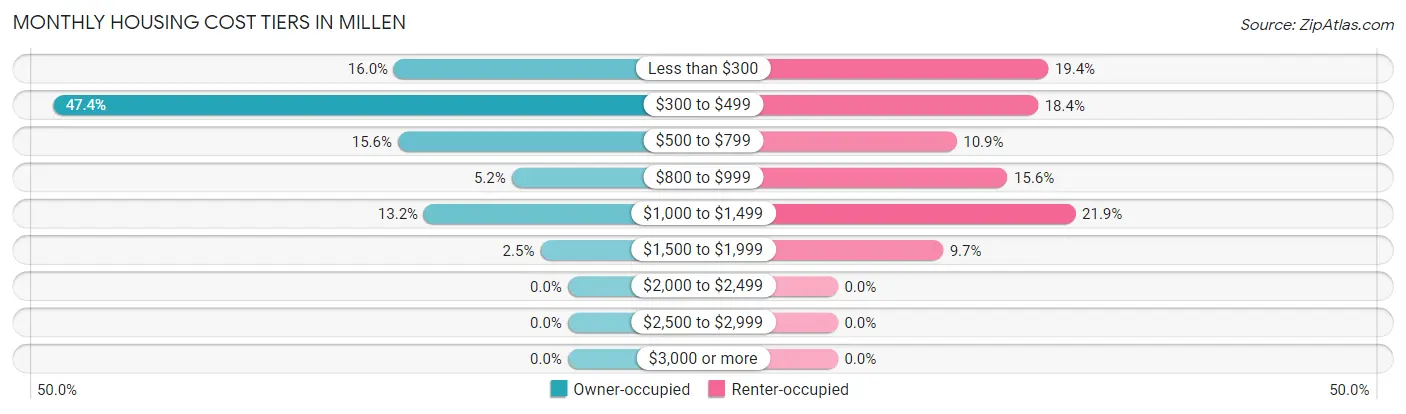
| Monthly Cost | Owner-occupied | Renter-occupied |
| Less than $300 | 133 (16.0%) | 62 (19.4%) |
| $300 to $499 | 394 (47.4%) | 59 (18.4%) |
| $500 to $799 | 130 (15.6%) | 35 (10.9%) |
| $800 to $999 | 43 (5.2%) | 50 (15.6%) |
| $1,000 to $1,499 | 110 (13.2%) | 70 (21.9%) |
| $1,500 to $1,999 | 21 (2.5%) | 31 (9.7%) |
| $2,000 to $2,499 | 0 (0.0%) | 0 (0.0%) |
| $2,500 to $2,999 | 0 (0.0%) | 0 (0.0%) |
| $3,000 or more | 0 (0.0%) | 0 (0.0%) |
| Total | 831 (100.0%) | 320 (100.0%) |
Physical Housing Characteristics in Millen
Housing Structures in Millen
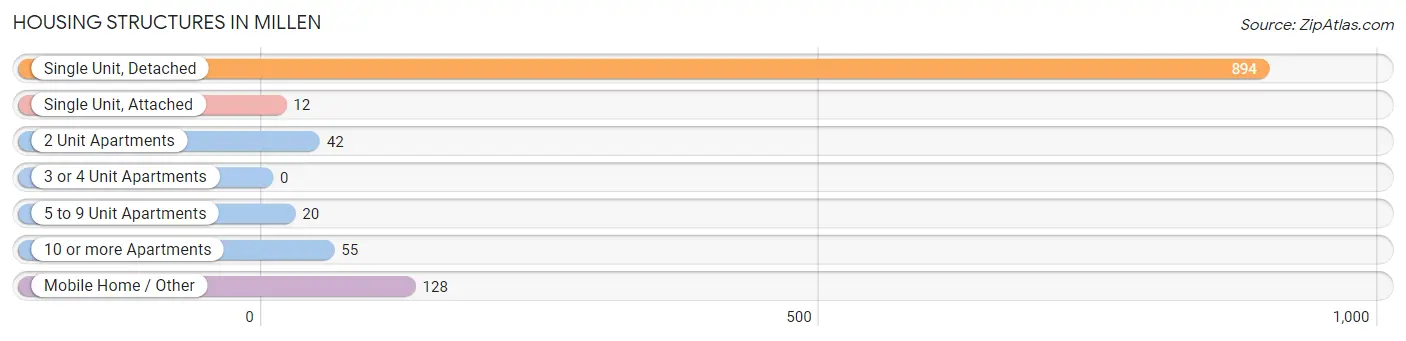
| Structure Type | # Housing Units | % Housing Units |
| Single Unit, Detached | 894 | 77.7% |
| Single Unit, Attached | 12 | 1.0% |
| 2 Unit Apartments | 42 | 3.6% |
| 3 or 4 Unit Apartments | 0 | 0.0% |
| 5 to 9 Unit Apartments | 20 | 1.7% |
| 10 or more Apartments | 55 | 4.8% |
| Mobile Home / Other | 128 | 11.1% |
| Total | 1,151 | 100.0% |
Housing Structures by Occupancy in Millen
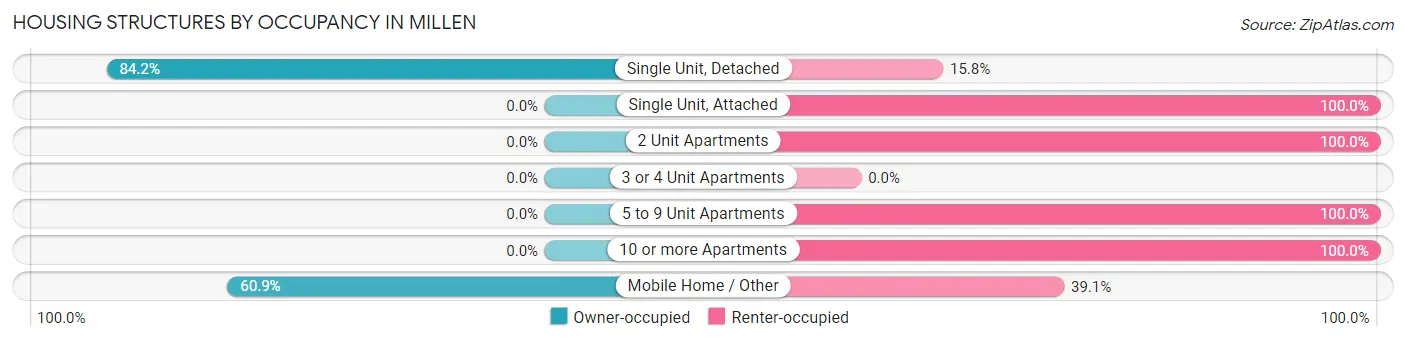
| Structure Type | Owner-occupied | Renter-occupied |
| Single Unit, Detached | 753 (84.2%) | 141 (15.8%) |
| Single Unit, Attached | 0 (0.0%) | 12 (100.0%) |
| 2 Unit Apartments | 0 (0.0%) | 42 (100.0%) |
| 3 or 4 Unit Apartments | 0 (0.0%) | 0 (0.0%) |
| 5 to 9 Unit Apartments | 0 (0.0%) | 20 (100.0%) |
| 10 or more Apartments | 0 (0.0%) | 55 (100.0%) |
| Mobile Home / Other | 78 (60.9%) | 50 (39.1%) |
| Total | 831 (72.2%) | 320 (27.8%) |
Housing Structures by Number of Rooms in Millen
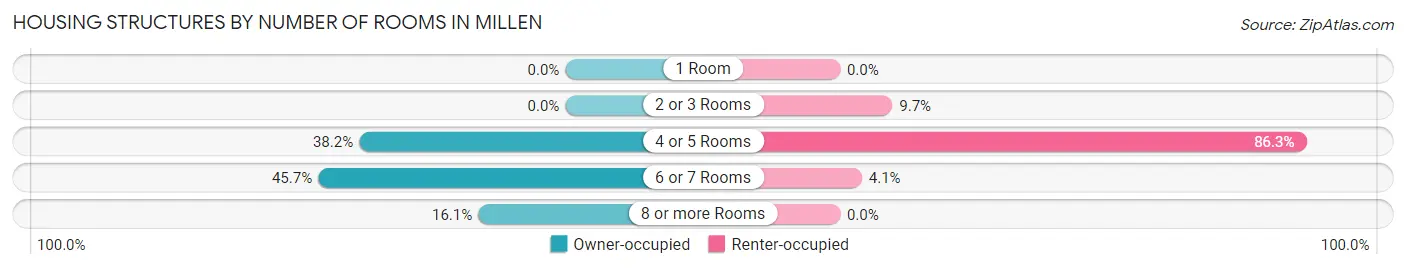
| Number of Rooms | Owner-occupied | Renter-occupied |
| 1 Room | 0 (0.0%) | 0 (0.0%) |
| 2 or 3 Rooms | 0 (0.0%) | 31 (9.7%) |
| 4 or 5 Rooms | 317 (38.2%) | 276 (86.3%) |
| 6 or 7 Rooms | 380 (45.7%) | 13 (4.1%) |
| 8 or more Rooms | 134 (16.1%) | 0 (0.0%) |
| Total | 831 (100.0%) | 320 (100.0%) |
Housing Structure by Heating Type in Millen
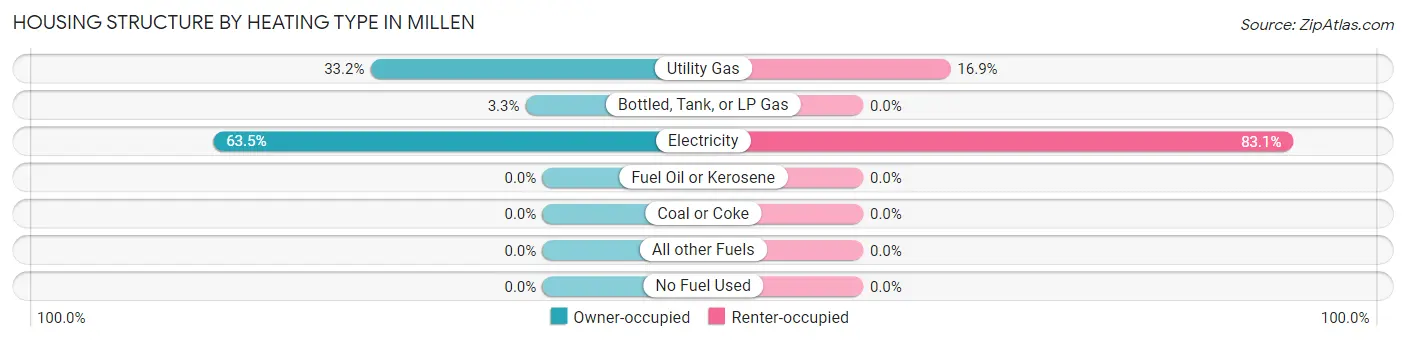
| Heating Type | Owner-occupied | Renter-occupied |
| Utility Gas | 276 (33.2%) | 54 (16.9%) |
| Bottled, Tank, or LP Gas | 27 (3.3%) | 0 (0.0%) |
| Electricity | 528 (63.5%) | 266 (83.1%) |
| Fuel Oil or Kerosene | 0 (0.0%) | 0 (0.0%) |
| Coal or Coke | 0 (0.0%) | 0 (0.0%) |
| All other Fuels | 0 (0.0%) | 0 (0.0%) |
| No Fuel Used | 0 (0.0%) | 0 (0.0%) |
| Total | 831 (100.0%) | 320 (100.0%) |
Household Vehicle Usage in Millen
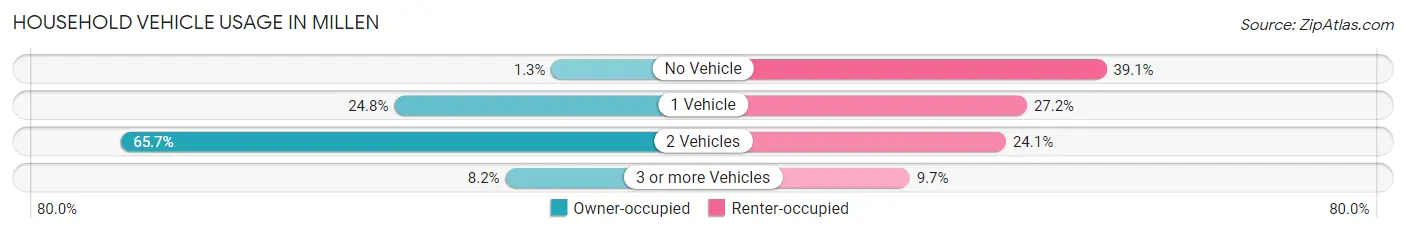
| Vehicles per Household | Owner-occupied | Renter-occupied |
| No Vehicle | 11 (1.3%) | 125 (39.1%) |
| 1 Vehicle | 206 (24.8%) | 87 (27.2%) |
| 2 Vehicles | 546 (65.7%) | 77 (24.1%) |
| 3 or more Vehicles | 68 (8.2%) | 31 (9.7%) |
| Total | 831 (100.0%) | 320 (100.0%) |
Real Estate & Mortgages in Millen
Real Estate and Mortgage Overview in Millen
| Characteristic | Without Mortgage | With Mortgage |
| Housing Units | 651 | 180 |
| Median Property Value | $48,800 | $161,100 |
| Median Household Income | $32,234 | $0 |
| Monthly Housing Costs | $381 | $0 |
| Real Estate Taxes | $519 | $23 |
Property Value by Mortgage Status in Millen
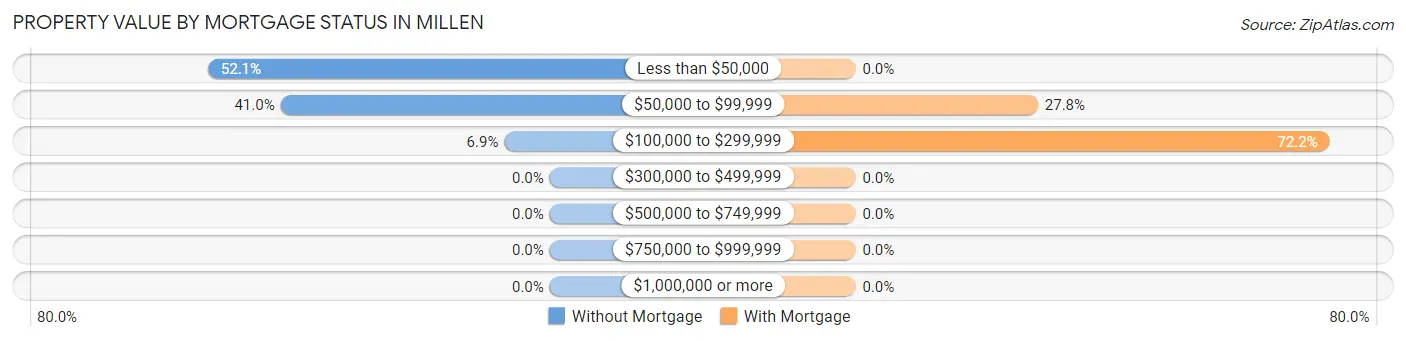
| Property Value | Without Mortgage | With Mortgage |
| Less than $50,000 | 339 (52.1%) | 0 (0.0%) |
| $50,000 to $99,999 | 267 (41.0%) | 50 (27.8%) |
| $100,000 to $299,999 | 45 (6.9%) | 130 (72.2%) |
| $300,000 to $499,999 | 0 (0.0%) | 0 (0.0%) |
| $500,000 to $749,999 | 0 (0.0%) | 0 (0.0%) |
| $750,000 to $999,999 | 0 (0.0%) | 0 (0.0%) |
| $1,000,000 or more | 0 (0.0%) | 0 (0.0%) |
| Total | 651 (100.0%) | 180 (100.0%) |
Household Income by Mortgage Status in Millen
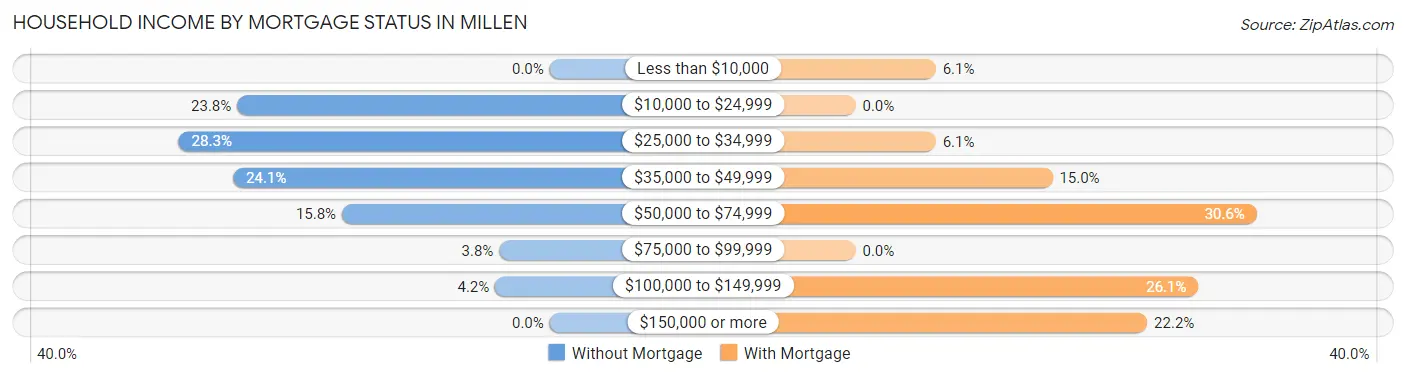
| Household Income | Without Mortgage | With Mortgage |
| Less than $10,000 | 0 (0.0%) | 11 (6.1%) |
| $10,000 to $24,999 | 155 (23.8%) | 0 (0.0%) |
| $25,000 to $34,999 | 184 (28.3%) | 11 (6.1%) |
| $35,000 to $49,999 | 157 (24.1%) | 27 (15.0%) |
| $50,000 to $74,999 | 103 (15.8%) | 55 (30.6%) |
| $75,000 to $99,999 | 25 (3.8%) | 0 (0.0%) |
| $100,000 to $149,999 | 27 (4.2%) | 47 (26.1%) |
| $150,000 or more | 0 (0.0%) | 40 (22.2%) |
| Total | 651 (100.0%) | 180 (100.0%) |
Property Value to Household Income Ratio in Millen
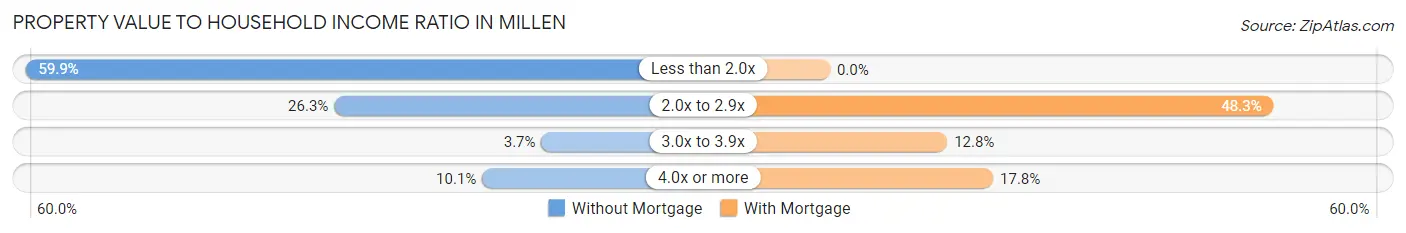
| Value-to-Income Ratio | Without Mortgage | With Mortgage |
| Less than 2.0x | 390 (59.9%) | 0 (0.0%) |
| 2.0x to 2.9x | 171 (26.3%) | 87 (48.3%) |
| 3.0x to 3.9x | 24 (3.7%) | 23 (12.8%) |
| 4.0x or more | 66 (10.1%) | 32 (17.8%) |
| Total | 651 (100.0%) | 180 (100.0%) |
Real Estate Taxes by Mortgage Status in Millen
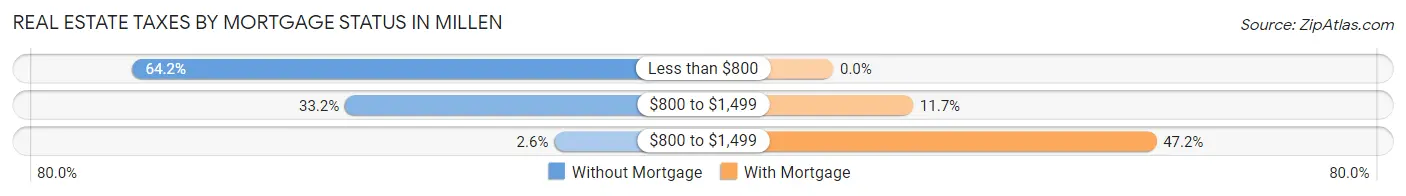
| Property Taxes | Without Mortgage | With Mortgage |
| Less than $800 | 418 (64.2%) | 0 (0.0%) |
| $800 to $1,499 | 216 (33.2%) | 21 (11.7%) |
| $800 to $1,499 | 17 (2.6%) | 85 (47.2%) |
| Total | 651 (100.0%) | 180 (100.0%) |
Health & Disability in Millen
Health Insurance Coverage by Age in Millen
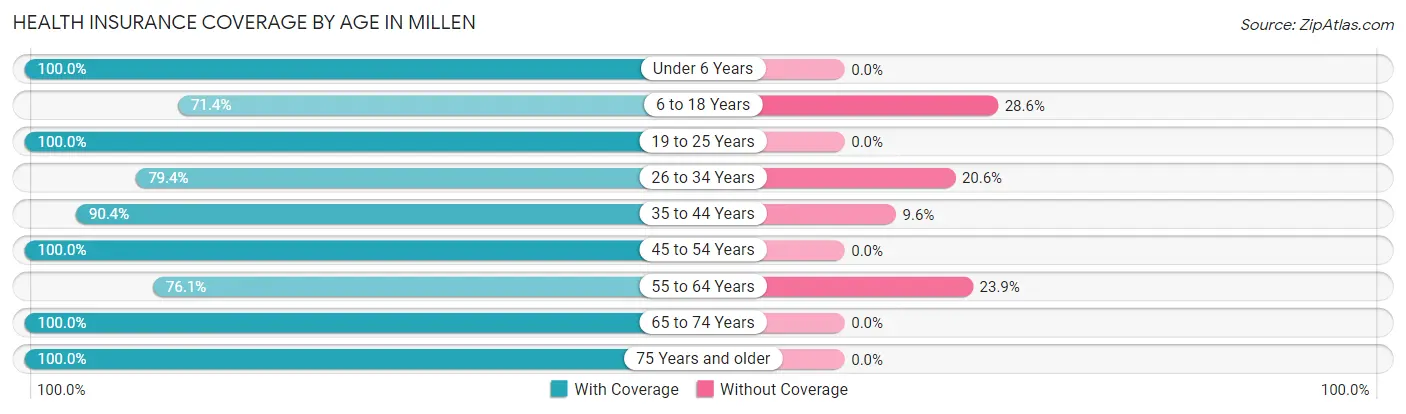
| Age Bracket | With Coverage | Without Coverage |
| Under 6 Years | 76 (100.0%) | 0 (0.0%) |
| 6 to 18 Years | 262 (71.4%) | 105 (28.6%) |
| 19 to 25 Years | 302 (100.0%) | 0 (0.0%) |
| 26 to 34 Years | 177 (79.4%) | 46 (20.6%) |
| 35 to 44 Years | 340 (90.4%) | 36 (9.6%) |
| 45 to 54 Years | 283 (100.0%) | 0 (0.0%) |
| 55 to 64 Years | 302 (76.1%) | 95 (23.9%) |
| 65 to 74 Years | 620 (100.0%) | 0 (0.0%) |
| 75 Years and older | 249 (100.0%) | 0 (0.0%) |
| Total | 2,611 (90.2%) | 282 (9.8%) |
Health Insurance Coverage by Citizenship Status in Millen
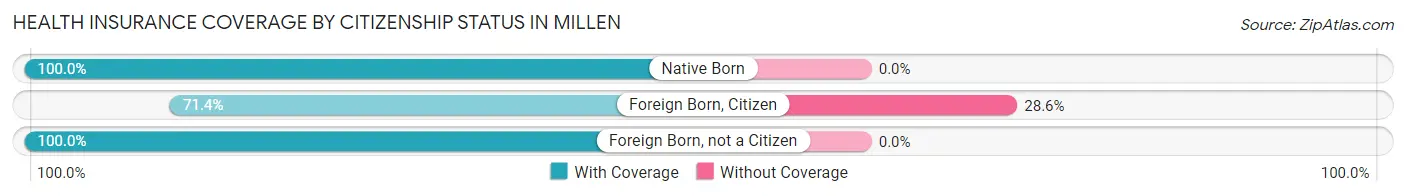
| Citizenship Status | With Coverage | Without Coverage |
| Native Born | 76 (100.0%) | 0 (0.0%) |
| Foreign Born, Citizen | 262 (71.4%) | 105 (28.6%) |
| Foreign Born, not a Citizen | 302 (100.0%) | 0 (0.0%) |
Health Insurance Coverage by Household Income in Millen
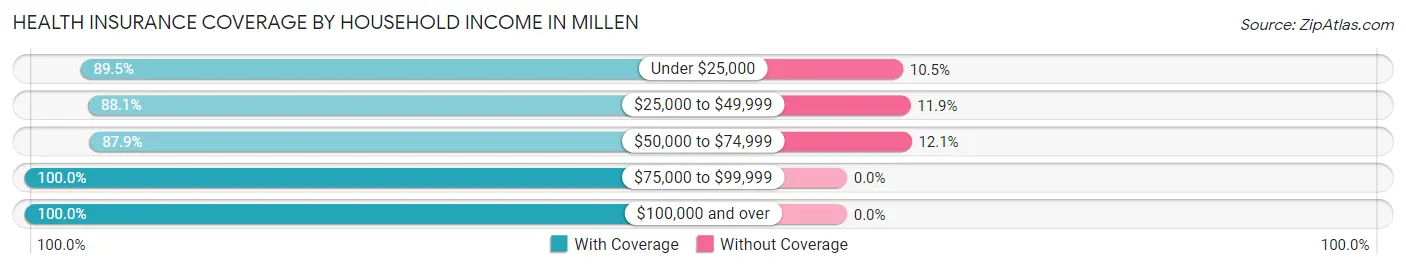
| Household Income | With Coverage | Without Coverage |
| Under $25,000 | 811 (89.5%) | 95 (10.5%) |
| $25,000 to $49,999 | 1,044 (88.1%) | 141 (11.9%) |
| $50,000 to $74,999 | 334 (87.9%) | 46 (12.1%) |
| $75,000 to $99,999 | 252 (100.0%) | 0 (0.0%) |
| $100,000 and over | 170 (100.0%) | 0 (0.0%) |
Public vs Private Health Insurance Coverage by Age in Millen
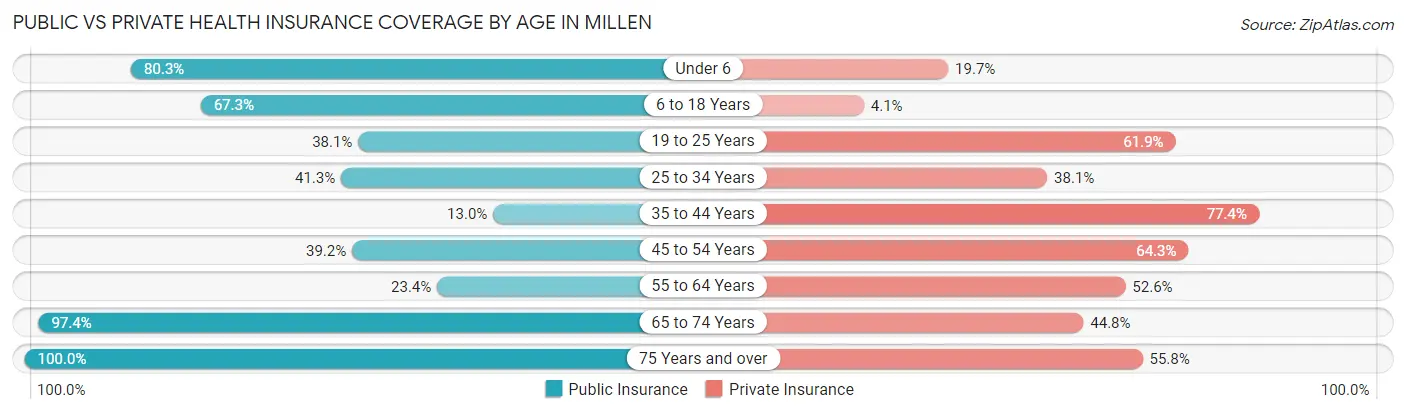
| Age Bracket | Public Insurance | Private Insurance |
| Under 6 | 61 (80.3%) | 15 (19.7%) |
| 6 to 18 Years | 247 (67.3%) | 15 (4.1%) |
| 19 to 25 Years | 115 (38.1%) | 187 (61.9%) |
| 25 to 34 Years | 92 (41.3%) | 85 (38.1%) |
| 35 to 44 Years | 49 (13.0%) | 291 (77.4%) |
| 45 to 54 Years | 111 (39.2%) | 182 (64.3%) |
| 55 to 64 Years | 93 (23.4%) | 209 (52.6%) |
| 65 to 74 Years | 604 (97.4%) | 278 (44.8%) |
| 75 Years and over | 249 (100.0%) | 139 (55.8%) |
| Total | 1,621 (56.0%) | 1,401 (48.4%) |
Disability Status by Sex by Age in Millen
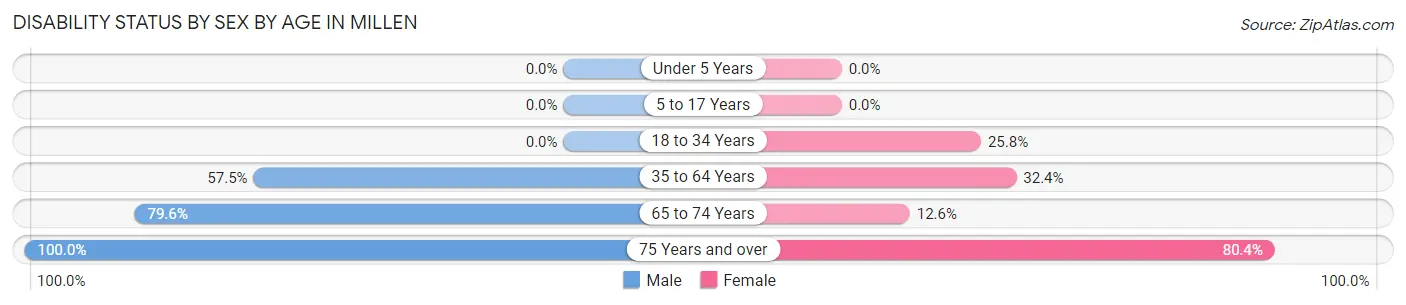
| Age Bracket | Male | Female |
| Under 5 Years | 0 (0.0%) | 0 (0.0%) |
| 5 to 17 Years | 0 (0.0%) | 0 (0.0%) |
| 18 to 34 Years | 0 (0.0%) | 92 (25.8%) |
| 35 to 64 Years | 382 (57.5%) | 127 (32.4%) |
| 65 to 74 Years | 191 (79.6%) | 48 (12.6%) |
| 75 Years and over | 35 (100.0%) | 172 (80.4%) |
Disability Class by Sex by Age in Millen
Disability Class: Hearing Difficulty
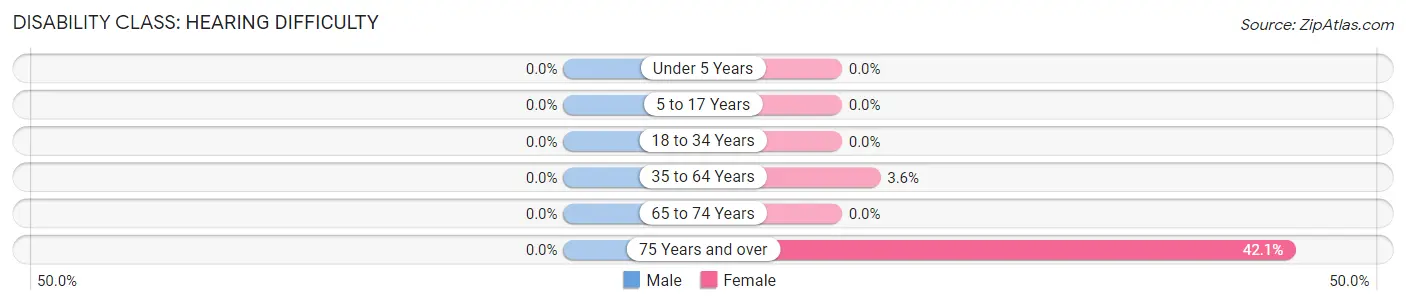
| Age Bracket | Male | Female |
| Under 5 Years | 0 (0.0%) | 0 (0.0%) |
| 5 to 17 Years | 0 (0.0%) | 0 (0.0%) |
| 18 to 34 Years | 0 (0.0%) | 0 (0.0%) |
| 35 to 64 Years | 0 (0.0%) | 14 (3.6%) |
| 65 to 74 Years | 0 (0.0%) | 0 (0.0%) |
| 75 Years and over | 0 (0.0%) | 90 (42.1%) |
Disability Class: Vision Difficulty
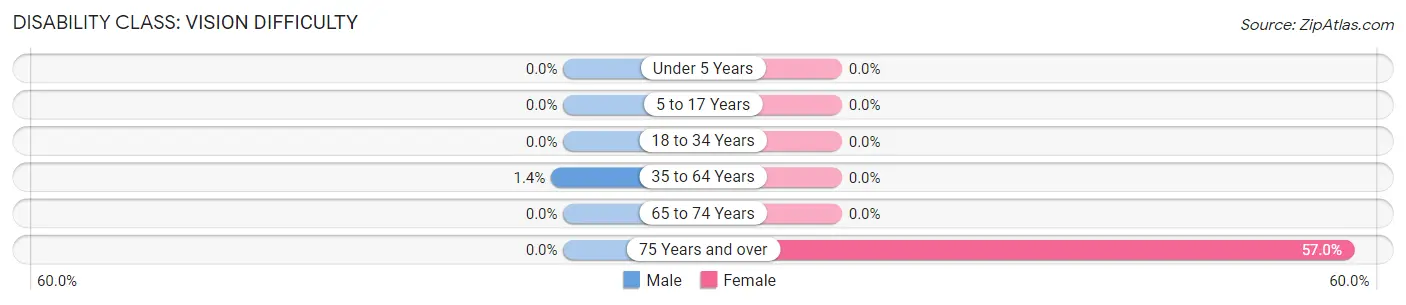
| Age Bracket | Male | Female |
| Under 5 Years | 0 (0.0%) | 0 (0.0%) |
| 5 to 17 Years | 0 (0.0%) | 0 (0.0%) |
| 18 to 34 Years | 0 (0.0%) | 0 (0.0%) |
| 35 to 64 Years | 9 (1.4%) | 0 (0.0%) |
| 65 to 74 Years | 0 (0.0%) | 0 (0.0%) |
| 75 Years and over | 0 (0.0%) | 122 (57.0%) |
Disability Class: Cognitive Difficulty
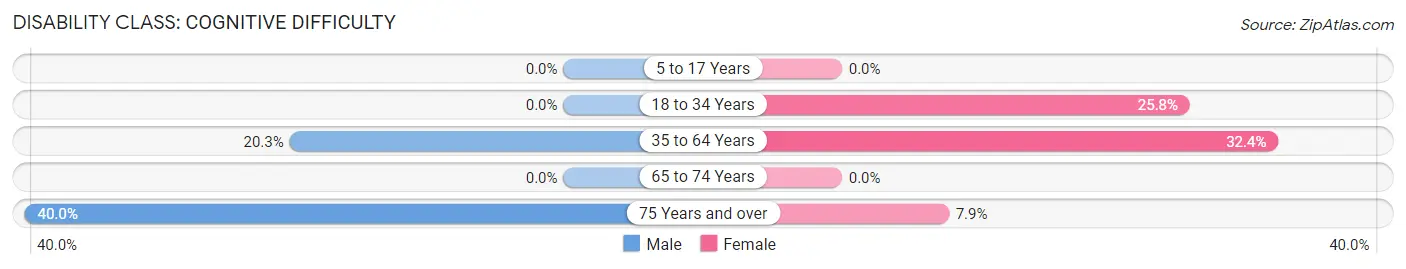
| Age Bracket | Male | Female |
| 5 to 17 Years | 0 (0.0%) | 0 (0.0%) |
| 18 to 34 Years | 0 (0.0%) | 92 (25.8%) |
| 35 to 64 Years | 135 (20.3%) | 127 (32.4%) |
| 65 to 74 Years | 0 (0.0%) | 0 (0.0%) |
| 75 Years and over | 14 (40.0%) | 17 (7.9%) |
Disability Class: Ambulatory Difficulty
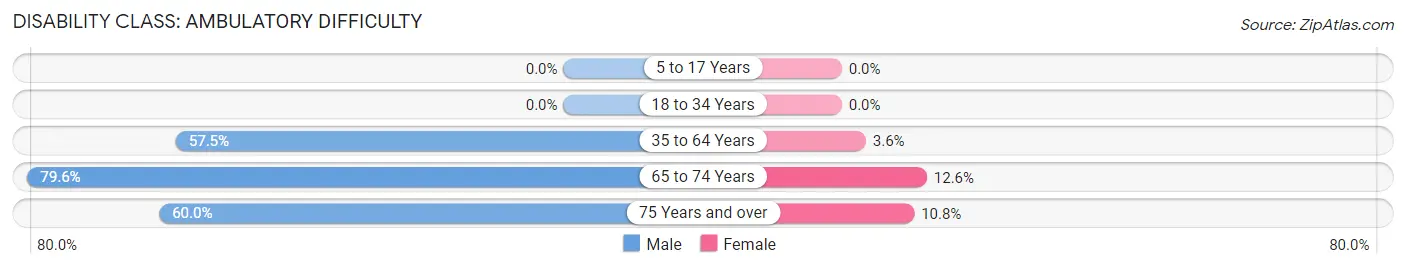
| Age Bracket | Male | Female |
| 5 to 17 Years | 0 (0.0%) | 0 (0.0%) |
| 18 to 34 Years | 0 (0.0%) | 0 (0.0%) |
| 35 to 64 Years | 382 (57.5%) | 14 (3.6%) |
| 65 to 74 Years | 191 (79.6%) | 48 (12.6%) |
| 75 Years and over | 21 (60.0%) | 23 (10.7%) |
Disability Class: Self-Care Difficulty
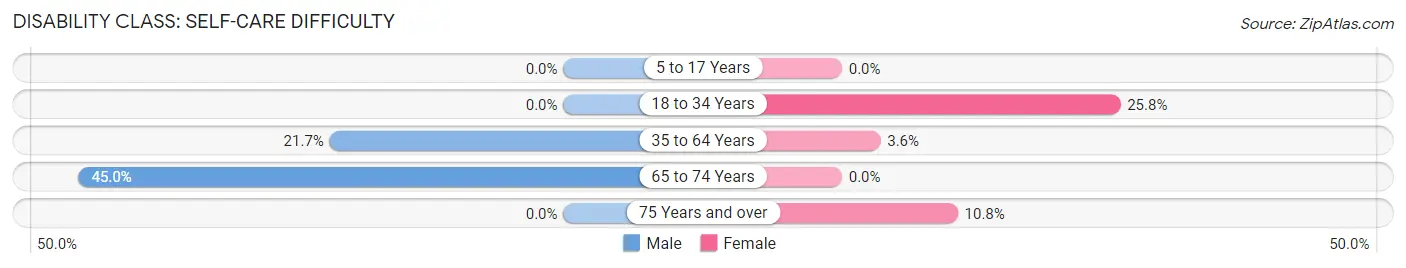
| Age Bracket | Male | Female |
| 5 to 17 Years | 0 (0.0%) | 0 (0.0%) |
| 18 to 34 Years | 0 (0.0%) | 92 (25.8%) |
| 35 to 64 Years | 144 (21.7%) | 14 (3.6%) |
| 65 to 74 Years | 108 (45.0%) | 0 (0.0%) |
| 75 Years and over | 0 (0.0%) | 23 (10.7%) |
Technology Access in Millen
Computing Device Access in Millen
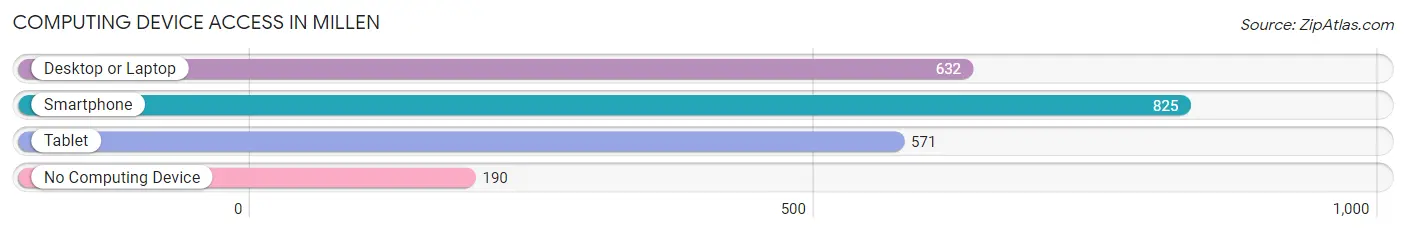
| Device Type | # Households | % Households |
| Desktop or Laptop | 632 | 54.9% |
| Smartphone | 825 | 71.7% |
| Tablet | 571 | 49.6% |
| No Computing Device | 190 | 16.5% |
| Total | 1,151 | 100.0% |
Internet Access in Millen
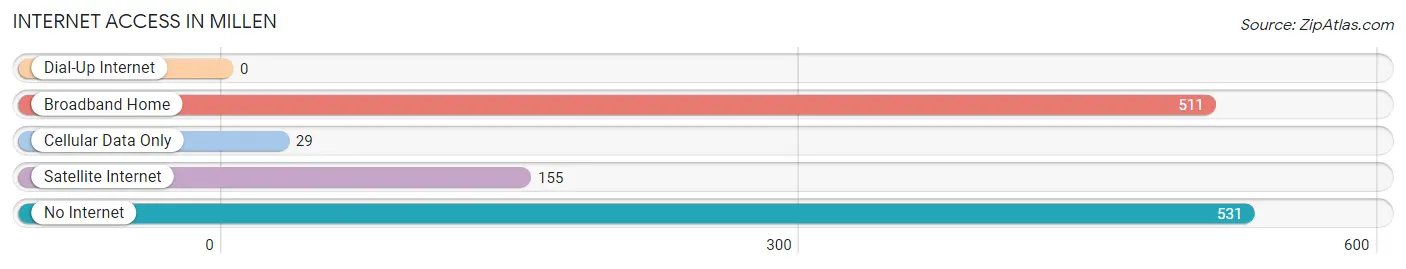
| Internet Type | # Households | % Households |
| Dial-Up Internet | 0 | 0.0% |
| Broadband Home | 511 | 44.4% |
| Cellular Data Only | 29 | 2.5% |
| Satellite Internet | 155 | 13.5% |
| No Internet | 531 | 46.1% |
| Total | 1,151 | 100.0% |
Millen Summary
Millen, Georgia is a small city located in Jenkins County, in the southeastern part of the state. It is situated about halfway between Savannah and Augusta, and is part of the Augusta-Richmond County Metropolitan Statistical Area. The city has a population of approximately 2,500 people, and is the county seat of Jenkins County.
History
Millen was founded in 1872, and was named after James Millen, a prominent local businessman. The city was incorporated in 1873, and was the first incorporated city in Jenkins County. The city was originally a railroad town, and was the site of a major Civil War battle in 1864. The city was also the site of a major Confederate prison camp during the war.
Geography
Millen is located in the southeastern part of Georgia, in Jenkins County. It is situated about halfway between Savannah and Augusta, and is part of the Augusta-Richmond County Metropolitan Statistical Area. The city is located at the intersection of U.S. Route 25 and Georgia State Route 17. The city is situated on the Ogeechee River, and is surrounded by rural farmland.
Economy
Millen’s economy is largely based on agriculture and manufacturing. The city is home to several large poultry processing plants, as well as a number of smaller businesses. The city is also home to a number of retail stores, restaurants, and other businesses.
Demographics
As of the 2010 census, Millen had a population of 2,500 people. The racial makeup of the city was 79.2% White, 17.2% African American, 0.4% Native American, 0.4% Asian, 0.1% Pacific Islander, and 2.7% from other races. The median household income was $25,000, and the median family income was $30,000. The per capita income was $14,000.
Conclusion
Millen, Georgia is a small city located in Jenkins County, in the southeastern part of the state. It is situated about halfway between Savannah and Augusta, and is part of the Augusta-Richmond County Metropolitan Statistical Area. The city has a population of approximately 2,500 people, and is the county seat of Jenkins County. The city’s economy is largely based on agriculture and manufacturing, and the city is home to several large poultry processing plants, as well as a number of smaller businesses. The racial makeup of the city is 79.2% White, 17.2% African American, 0.4% Native American, 0.4% Asian, 0.1% Pacific Islander, and 2.7% from other races. The median household income was $25,000, and the median family income was $30,000.
Common Questions
What is Per Capita Income in Millen?
Per Capita income in Millen is $17,338.
What is the Median Family Income in Millen?
Median Family Income in Millen is $42,188.
What is the Median Household income in Millen?
Median Household Income in Millen is $34,213.
What is Income or Wage Gap in Millen?
Income or Wage Gap in Millen is 28.6%.
Women in Millen earn 71.4 cents for every dollar earned by a man.
What is Inequality or Gini Index in Millen?
Inequality or Gini Index in Millen is 0.39.
What is the Total Population of Millen?
Total Population of Millen is 2,973.
What is the Total Male Population of Millen?
Total Male Population of Millen is 1,252.
What is the Total Female Population of Millen?
Total Female Population of Millen is 1,721.
What is the Ratio of Males per 100 Females in Millen?
There are 72.75 Males per 100 Females in Millen.
What is the Ratio of Females per 100 Males in Millen?
There are 137.46 Females per 100 Males in Millen.
What is the Median Population Age in Millen?
Median Population Age in Millen is 54.5 Years.
What is the Average Family Size in Millen
Average Family Size in Millen is 3.2 People.
What is the Average Household Size in Millen
Average Household Size in Millen is 2.5 People.
How Large is the Labor Force in Millen?
There are 1,031 People in the Labor Forcein in Millen.
What is the Percentage of People in the Labor Force in Millen?
39.3% of People are in the Labor Force in Millen.
What is the Unemployment Rate in Millen?
Unemployment Rate in Millen is 10.0%.