Forsyth, GA
Forsyth Map
Forsyth Overview
4,549
TOTAL POPULATION
2,008
MALE POPULATION
2,541
FEMALE POPULATION
79.02
MALES / 100 FEMALES
126.54
FEMALES / 100 MALES
43.3
MEDIAN AGE
2.8
AVG FAMILY SIZE
2.2
AVG HOUSEHOLD SIZE
$36,159
PER CAPITA INCOME
$64,285
AVG FAMILY INCOME
$63,396
AVG HOUSEHOLD INCOME
34.7%
WAGE / INCOME GAP [ % ]
65.3¢/ $1
WAGE / INCOME GAP [ $ ]
$6,783
FAMILY INCOME DEFICIT
0.45
INEQUALITY / GINI INDEX
2,119
LABOR FORCE [ PEOPLE ]
56.4%
PERCENT IN LABOR FORCE
6.7%
UNEMPLOYMENT RATE
Forsyth Zip Codes
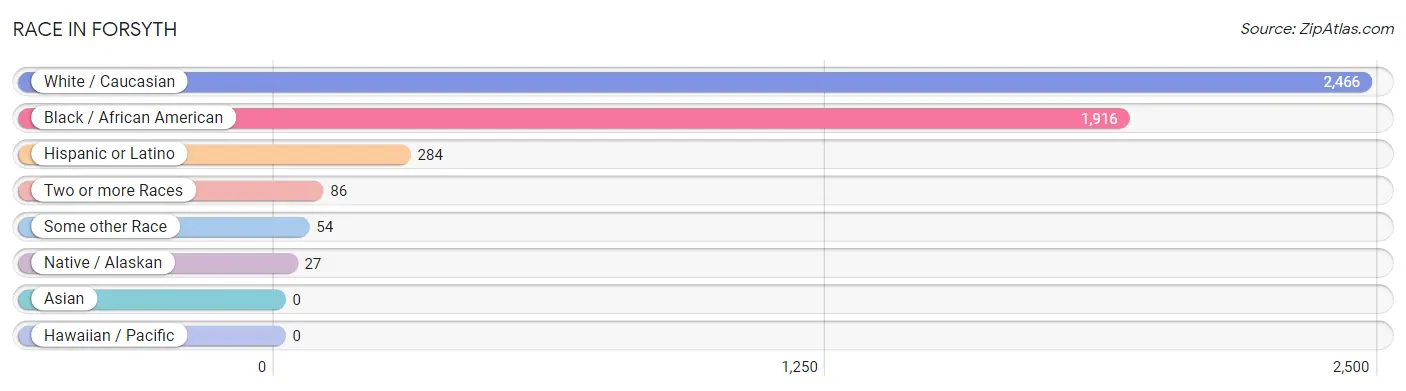
Race in Forsyth
The most populous races in Forsyth are White / Caucasian (2,466 | 54.2%), Black / African American (1,916 | 42.1%), and Hispanic or Latino (284 | 6.2%).
| Race | # Population | % Population |
| Asian | 0 | 0.0% |
| Black / African American | 1,916 | 42.1% |
| Hawaiian / Pacific | 0 | 0.0% |
| Hispanic or Latino | 284 | 6.2% |
| Native / Alaskan | 27 | 0.6% |
| White / Caucasian | 2,466 | 54.2% |
| Two or more Races | 86 | 1.9% |
| Some other Race | 54 | 1.2% |
| Total | 4,549 | 100.0% |
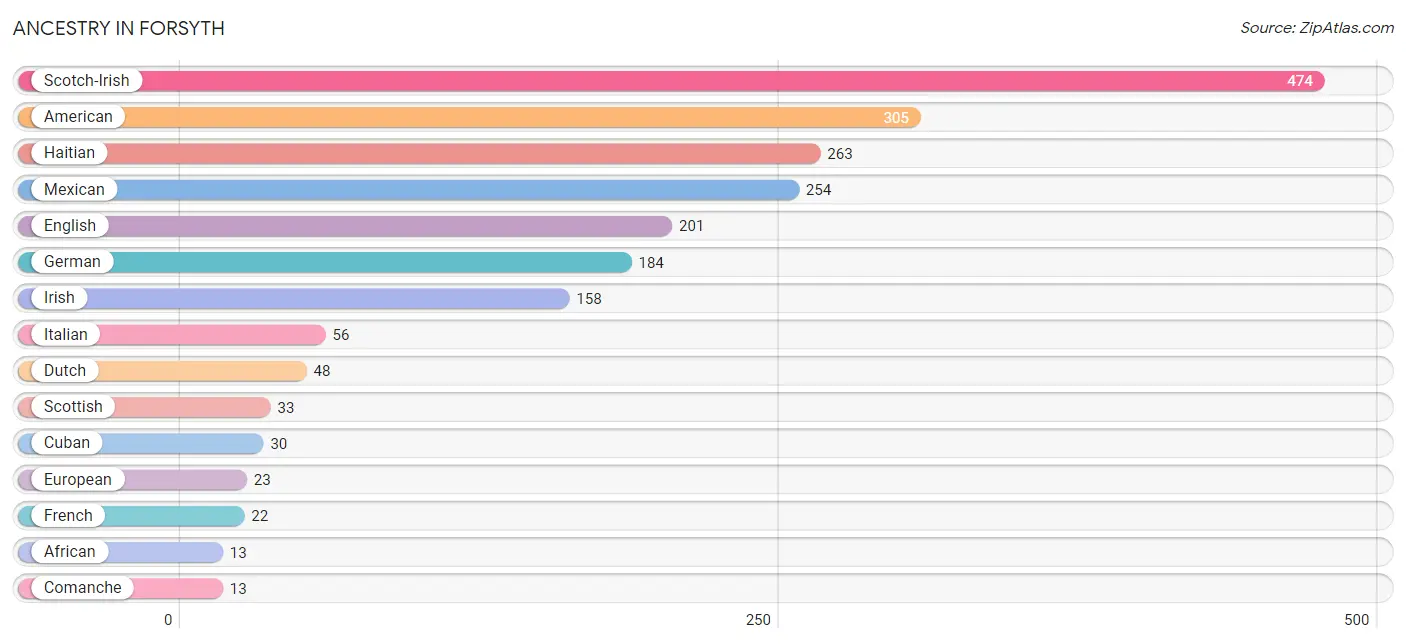
Ancestry in Forsyth
The most populous ancestries reported in Forsyth are Scotch-Irish (474 | 10.4%), American (305 | 6.7%), Haitian (263 | 5.8%), Mexican (254 | 5.6%), and English (201 | 4.4%), together accounting for 32.9% of all Forsyth residents.
| Ancestry | # Population | % Population |
| African | 13 | 0.3% |
| American | 305 | 6.7% |
| Comanche | 13 | 0.3% |
| Cuban | 30 | 0.7% |
| Dutch | 48 | 1.1% |
| English | 201 | 4.4% |
| European | 23 | 0.5% |
| French | 22 | 0.5% |
| German | 184 | 4.0% |
| Haitian | 263 | 5.8% |
| Irish | 158 | 3.5% |
| Italian | 56 | 1.2% |
| Mexican | 254 | 5.6% |
| Norwegian | 11 | 0.2% |
| Russian | 3 | 0.1% |
| Scotch-Irish | 474 | 10.4% |
| Scottish | 33 | 0.7% |
| Subsaharan African | 13 | 0.3% | View All 18 Rows |
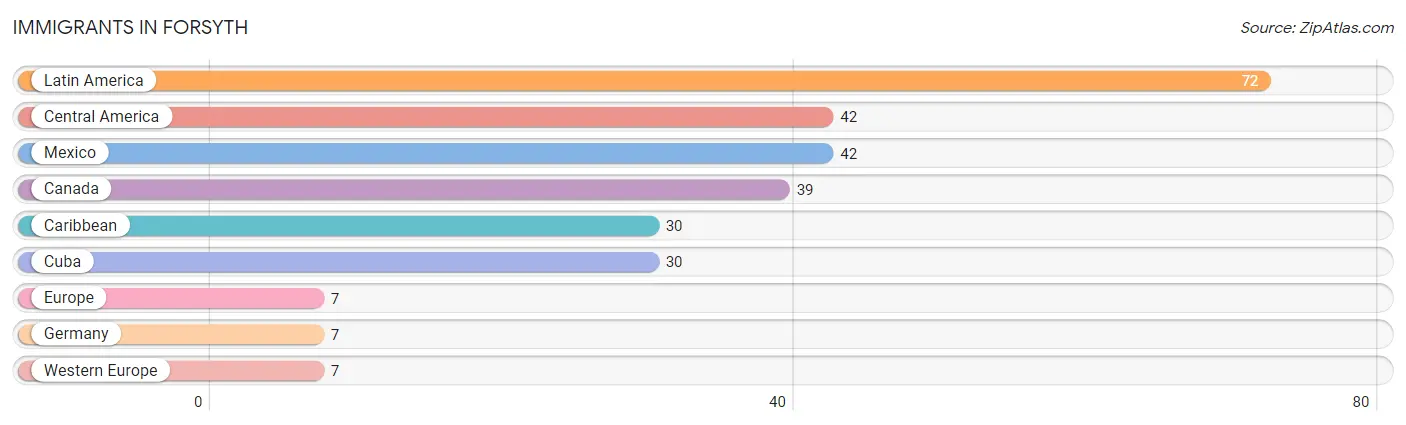
Immigrants in Forsyth
The most numerous immigrant groups reported in Forsyth came from Latin America (72 | 1.6%), Central America (42 | 0.9%), Mexico (42 | 0.9%), Canada (39 | 0.9%), and Caribbean (30 | 0.7%), together accounting for 4.9% of all Forsyth residents.
| Immigration Origin | # Population | % Population |
| Canada | 39 | 0.9% |
| Caribbean | 30 | 0.7% |
| Central America | 42 | 0.9% |
| Cuba | 30 | 0.7% |
| Europe | 7 | 0.2% |
| Germany | 7 | 0.2% |
| Latin America | 72 | 1.6% |
| Mexico | 42 | 0.9% |
| Western Europe | 7 | 0.2% | View All 9 Rows |
Sex and Age in Forsyth
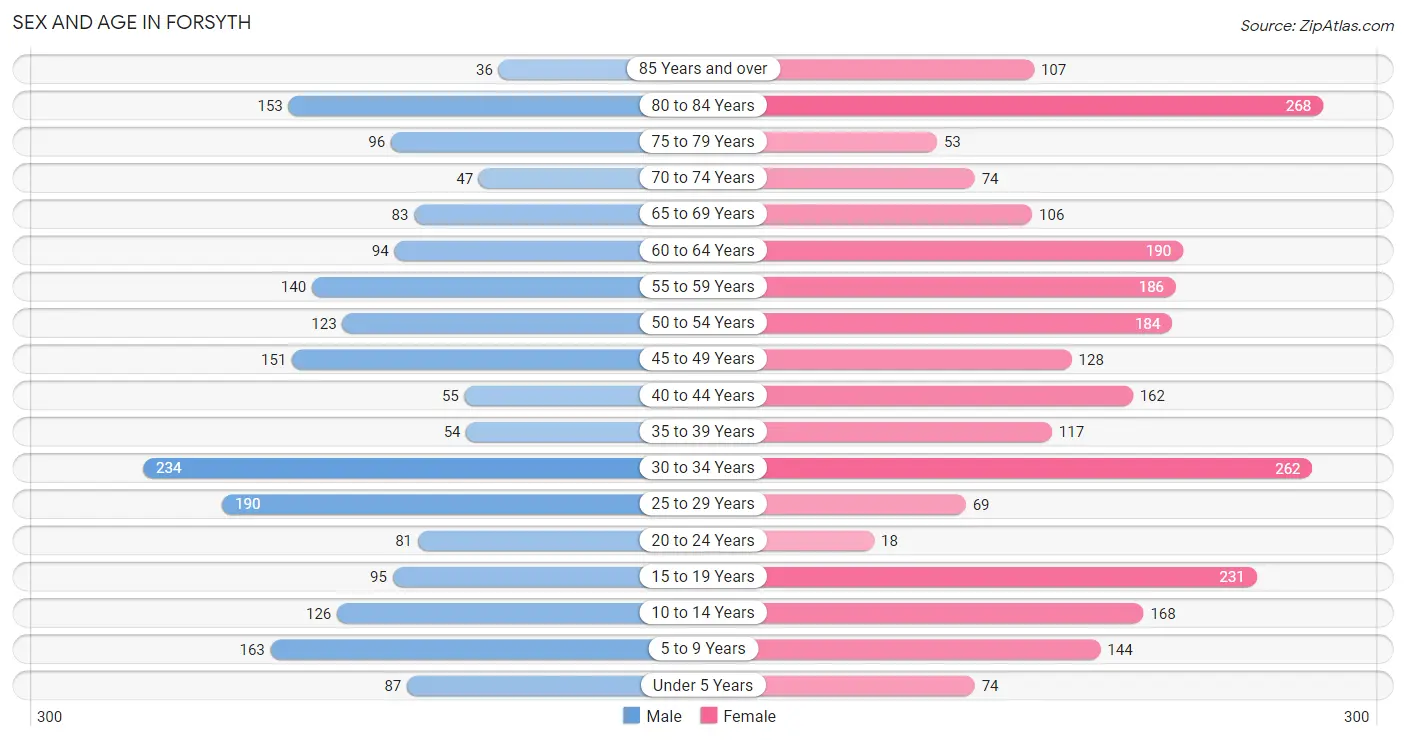
Sex and Age in Forsyth
The most populous age groups in Forsyth are 30 to 34 Years (234 | 11.7%) for men and 80 to 84 Years (268 | 10.5%) for women.
| Age Bracket | Male | Female |
| Under 5 Years | 87 (4.3%) | 74 (2.9%) |
| 5 to 9 Years | 163 (8.1%) | 144 (5.7%) |
| 10 to 14 Years | 126 (6.3%) | 168 (6.6%) |
| 15 to 19 Years | 95 (4.7%) | 231 (9.1%) |
| 20 to 24 Years | 81 (4.0%) | 18 (0.7%) |
| 25 to 29 Years | 190 (9.5%) | 69 (2.7%) |
| 30 to 34 Years | 234 (11.7%) | 262 (10.3%) |
| 35 to 39 Years | 54 (2.7%) | 117 (4.6%) |
| 40 to 44 Years | 55 (2.7%) | 162 (6.4%) |
| 45 to 49 Years | 151 (7.5%) | 128 (5.0%) |
| 50 to 54 Years | 123 (6.1%) | 184 (7.2%) |
| 55 to 59 Years | 140 (7.0%) | 186 (7.3%) |
| 60 to 64 Years | 94 (4.7%) | 190 (7.5%) |
| 65 to 69 Years | 83 (4.1%) | 106 (4.2%) |
| 70 to 74 Years | 47 (2.3%) | 74 (2.9%) |
| 75 to 79 Years | 96 (4.8%) | 53 (2.1%) |
| 80 to 84 Years | 153 (7.6%) | 268 (10.5%) |
| 85 Years and over | 36 (1.8%) | 107 (4.2%) |
| Total | 2,008 (100.0%) | 2,541 (100.0%) |
Families and Households in Forsyth
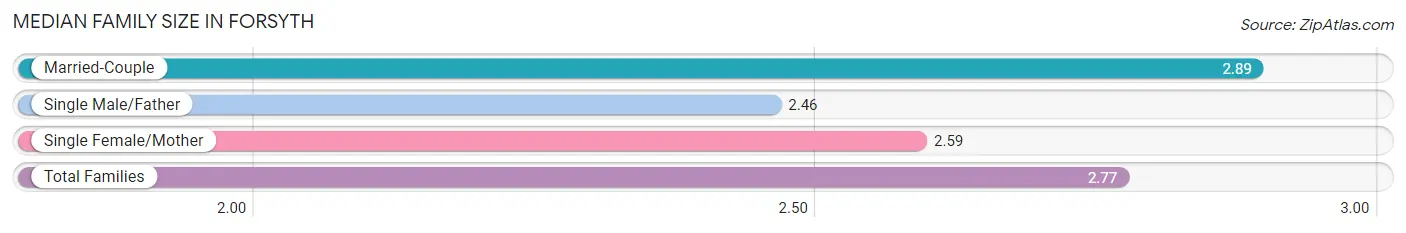
Median Family Size in Forsyth
The median family size in Forsyth is 2.77 persons per family, with married-couple families (802 | 63.1%) accounting for the largest median family size of 2.89 persons per family. On the other hand, single male/father families (143 | 11.3%) represent the smallest median family size with 2.46 persons per family.
| Family Type | # Families | Family Size |
| Married-Couple | 802 (63.1%) | 2.89 |
| Single Male/Father | 143 (11.3%) | 2.46 |
| Single Female/Mother | 326 (25.7%) | 2.59 |
| Total Families | 1,271 (100.0%) | 2.77 |
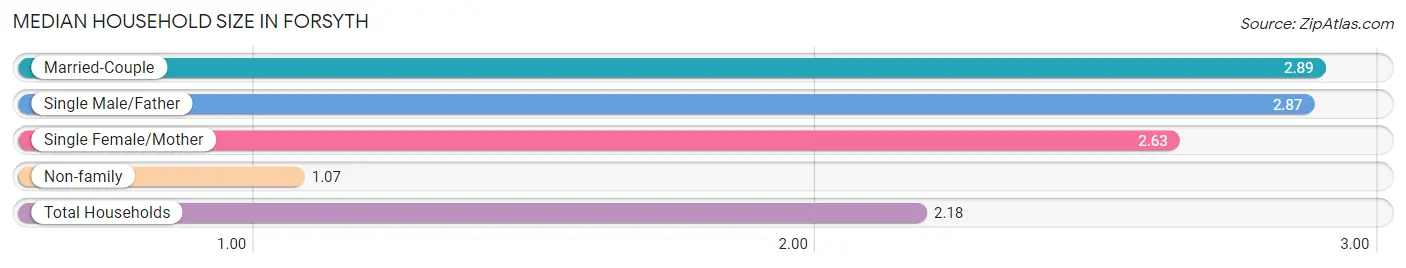
Median Household Size in Forsyth
The median household size in Forsyth is 2.18 persons per household, with married-couple households (802 | 39.7%) accounting for the largest median household size of 2.89 persons per household. non-family households (747 | 37.0%) represent the smallest median household size with 1.07 persons per household.
| Household Type | # Households | Household Size |
| Married-Couple | 802 (39.7%) | 2.89 |
| Single Male/Father | 143 (7.1%) | 2.87 |
| Single Female/Mother | 326 (16.2%) | 2.63 |
| Non-family | 747 (37.0%) | 1.07 |
| Total Households | 2,018 (100.0%) | 2.18 |
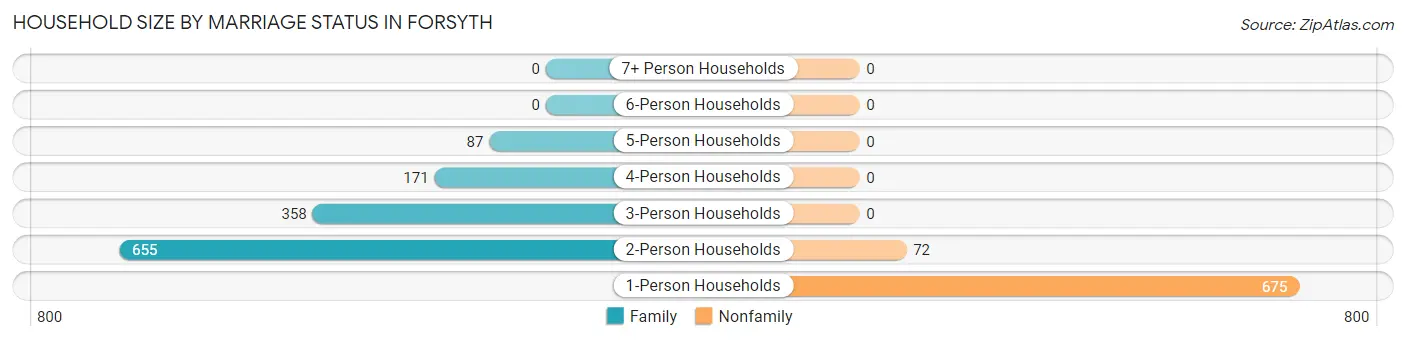
Household Size by Marriage Status in Forsyth
Out of a total of 2,018 households in Forsyth, 1,271 (63.0%) are family households, while 747 (37.0%) are nonfamily households. The most numerous type of family households are 2-person households, comprising 655, and the most common type of nonfamily households are 1-person households, comprising 675.
| Household Size | Family Households | Nonfamily Households |
| 1-Person Households | - | 675 (33.5%) |
| 2-Person Households | 655 (32.5%) | 72 (3.6%) |
| 3-Person Households | 358 (17.7%) | 0 (0.0%) |
| 4-Person Households | 171 (8.5%) | 0 (0.0%) |
| 5-Person Households | 87 (4.3%) | 0 (0.0%) |
| 6-Person Households | 0 (0.0%) | 0 (0.0%) |
| 7+ Person Households | 0 (0.0%) | 0 (0.0%) |
| Total | 1,271 (63.0%) | 747 (37.0%) |
Female Fertility in Forsyth
Fertility by Age in Forsyth
Average fertility rate in Forsyth is 25.0 births per 1,000 women. Women in the age bracket of 20 to 34 years have the highest fertility rate with 34.0 births per 1,000 women. Women in the age bracket of 35 to 50 years acount for 52.0% of all women with births.
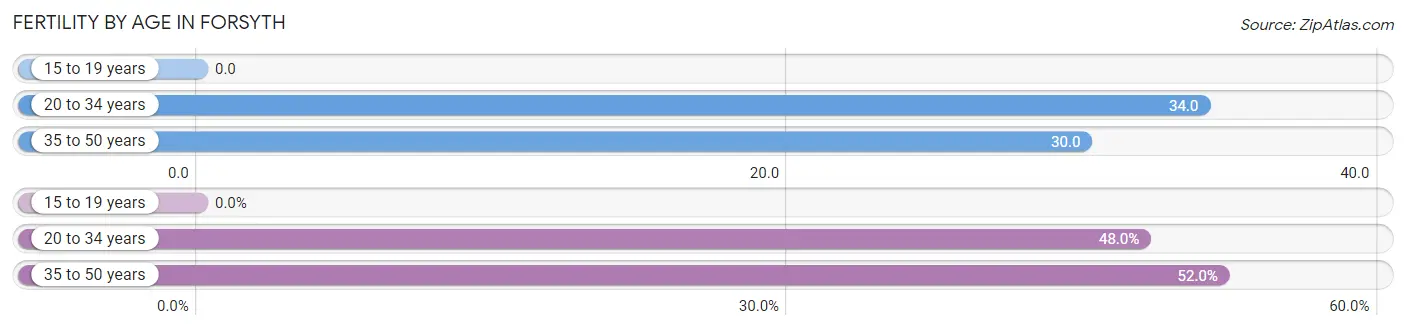
| Age Bracket | Women with Births | Births / 1,000 Women |
| 15 to 19 years | 0 (0.0%) | 0.0 |
| 20 to 34 years | 12 (48.0%) | 34.0 |
| 35 to 50 years | 13 (52.0%) | 30.0 |
| Total | 25 (100.0%) | 25.0 |
Fertility by Age by Marriage Status in Forsyth
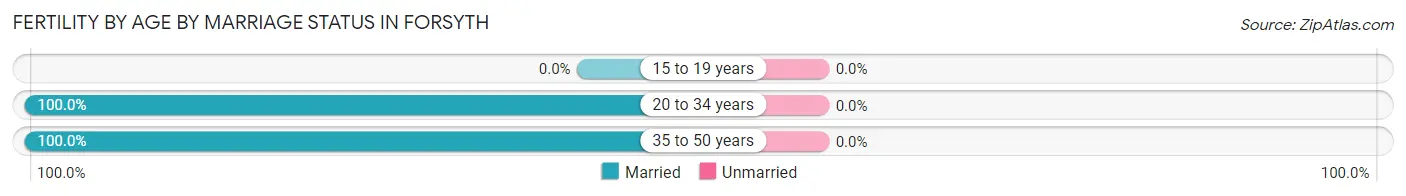
| Age Bracket | Married | Unmarried |
| 15 to 19 years | 0 (0.0%) | 0 (0.0%) |
| 20 to 34 years | 12 (100.0%) | 0 (0.0%) |
| 35 to 50 years | 13 (100.0%) | 0 (0.0%) |
| Total | 25 (100.0%) | 0 (0.0%) |
Fertility by Education in Forsyth
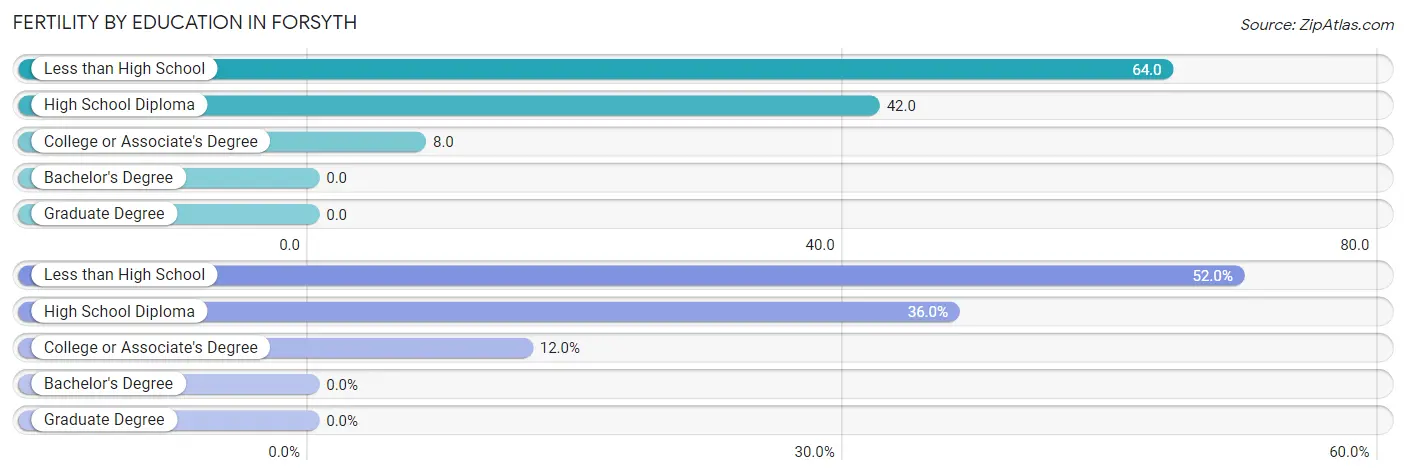
| Educational Attainment | Women with Births | Births / 1,000 Women |
| Less than High School | 13 (52.0%) | 64.0 |
| High School Diploma | 9 (36.0%) | 42.0 |
| College or Associate's Degree | 3 (12.0%) | 8.0 |
| Bachelor's Degree | 0 (0.0%) | 0.0 |
| Graduate Degree | 0 (0.0%) | 0.0 |
| Total | 25 (100.0%) | 25.0 |
Fertility by Education by Marriage Status in Forsyth
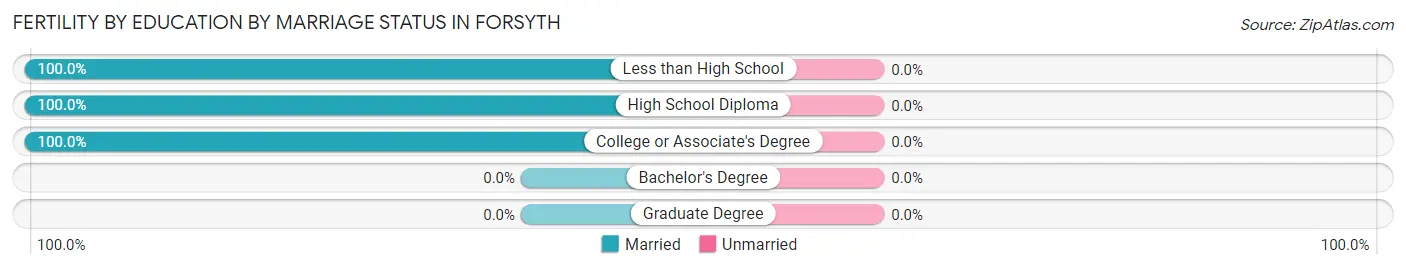
| Educational Attainment | Married | Unmarried |
| Less than High School | 13 (100.0%) | 0 (0.0%) |
| High School Diploma | 9 (100.0%) | 0 (0.0%) |
| College or Associate's Degree | 3 (100.0%) | 0 (0.0%) |
| Bachelor's Degree | 0 (0.0%) | 0 (0.0%) |
| Graduate Degree | 0 (0.0%) | 0 (0.0%) |
| Total | 25 (100.0%) | 0 (0.0%) |
Income in Forsyth
Income Overview in Forsyth
Per Capita Income in Forsyth is $36,159, while median incomes of families and households are $64,285 and $63,396 respectively.
| Characteristic | Number | Measure |
| Per Capita Income | 4,549 | $36,159 |
| Median Family Income | 1,271 | $64,285 |
| Mean Family Income | 1,271 | $85,408 |
| Median Household Income | 2,018 | $63,396 |
| Mean Household Income | 2,018 | $79,107 |
| Income Deficit | 1,271 | $6,783 |
| Wage / Income Gap (%) | 4,549 | 34.67% |
| Wage / Income Gap ($) | 4,549 | 65.33¢ per $1 |
| Gini / Inequality Index | 4,549 | 0.45 |
Earnings by Sex in Forsyth
Average Earnings in Forsyth are $41,901, $55,134 for men and $36,017 for women, a difference of 34.7%.
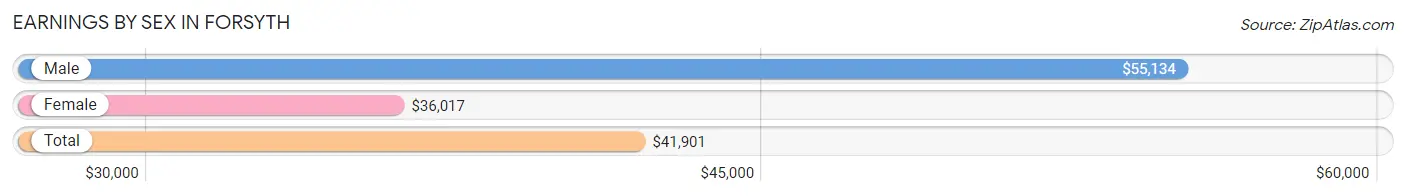
| Sex | Number | Average Earnings |
| Male | 993 (46.9%) | $55,134 |
| Female | 1,124 (53.1%) | $36,017 |
| Total | 2,117 (100.0%) | $41,901 |
Earnings by Sex by Income Bracket in Forsyth
The most common earnings brackets in Forsyth are $100,000+ for men (208 | 20.9%) and $35,000 to $39,999 for women (137 | 12.2%).
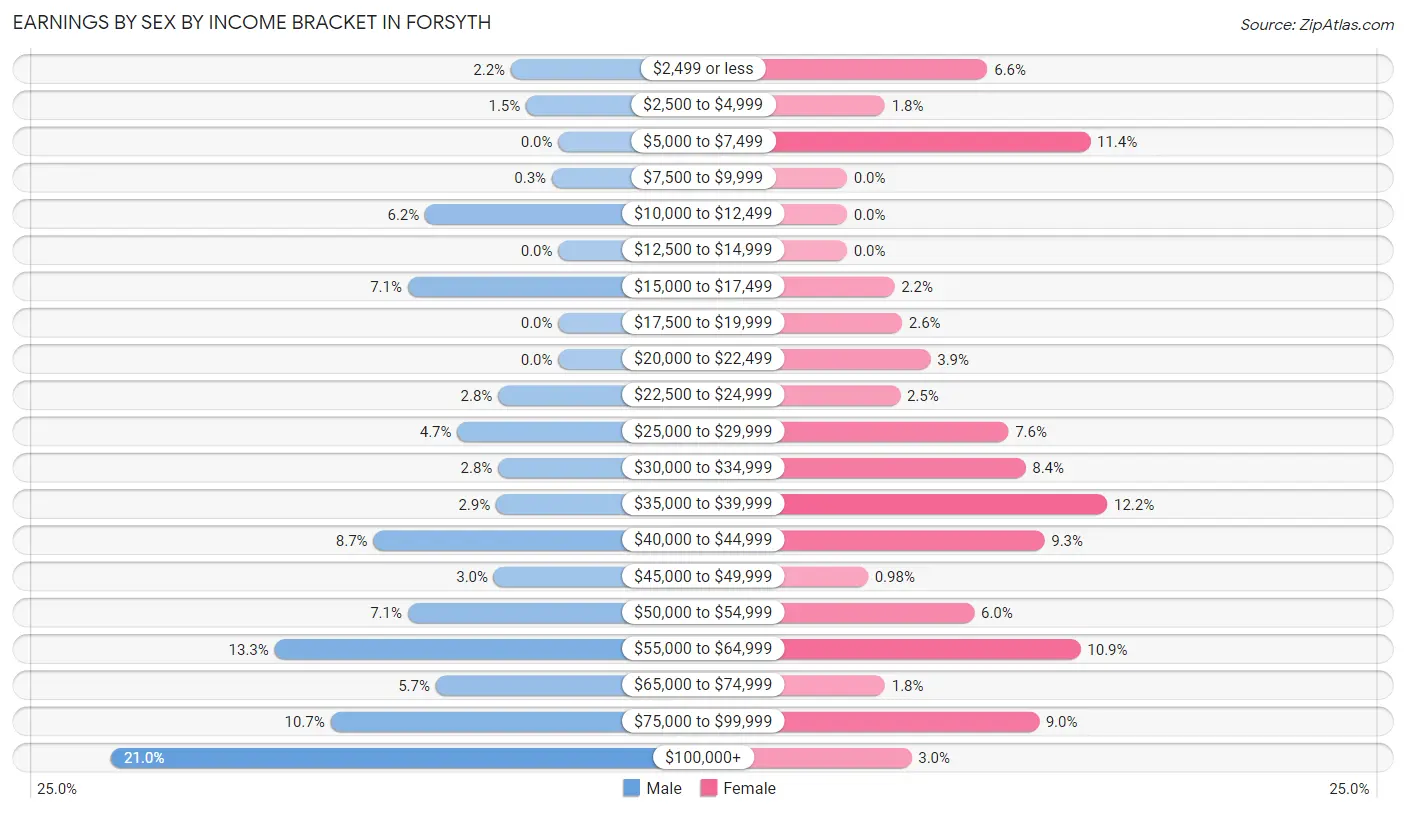
| Income | Male | Female |
| $2,499 or less | 22 (2.2%) | 74 (6.6%) |
| $2,500 to $4,999 | 15 (1.5%) | 20 (1.8%) |
| $5,000 to $7,499 | 0 (0.0%) | 128 (11.4%) |
| $7,500 to $9,999 | 3 (0.3%) | 0 (0.0%) |
| $10,000 to $12,499 | 62 (6.2%) | 0 (0.0%) |
| $12,500 to $14,999 | 0 (0.0%) | 0 (0.0%) |
| $15,000 to $17,499 | 70 (7.0%) | 25 (2.2%) |
| $17,500 to $19,999 | 0 (0.0%) | 29 (2.6%) |
| $20,000 to $22,499 | 0 (0.0%) | 44 (3.9%) |
| $22,500 to $24,999 | 28 (2.8%) | 28 (2.5%) |
| $25,000 to $29,999 | 47 (4.7%) | 85 (7.6%) |
| $30,000 to $34,999 | 28 (2.8%) | 94 (8.4%) |
| $35,000 to $39,999 | 29 (2.9%) | 137 (12.2%) |
| $40,000 to $44,999 | 86 (8.7%) | 104 (9.2%) |
| $45,000 to $49,999 | 30 (3.0%) | 11 (1.0%) |
| $50,000 to $54,999 | 70 (7.0%) | 67 (6.0%) |
| $55,000 to $64,999 | 132 (13.3%) | 123 (10.9%) |
| $65,000 to $74,999 | 57 (5.7%) | 20 (1.8%) |
| $75,000 to $99,999 | 106 (10.7%) | 101 (9.0%) |
| $100,000+ | 208 (20.9%) | 34 (3.0%) |
| Total | 993 (100.0%) | 1,124 (100.0%) |
Earnings by Sex by Educational Attainment in Forsyth
Average earnings in Forsyth are $55,599 for men and $37,020 for women, a difference of 33.4%. Men with an educational attainment of bachelor's degree enjoy the highest average annual earnings of $57,164, while those with high school diploma education earn the least with $30,268. Women with an educational attainment of graduate degree earn the most with the average annual earnings of $77,292, while those with high school diploma education have the smallest earnings of $28,250.
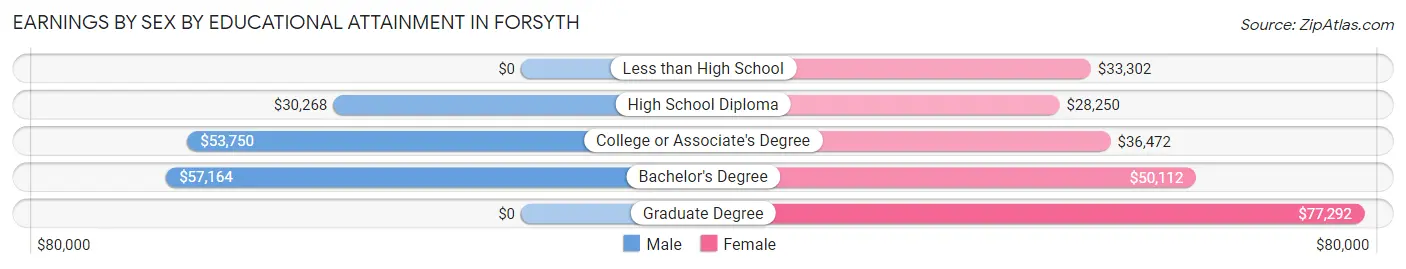
| Educational Attainment | Male Income | Female Income |
| Less than High School | - | - |
| High School Diploma | $30,268 | $28,250 |
| College or Associate's Degree | $53,750 | $36,472 |
| Bachelor's Degree | $57,164 | $50,112 |
| Graduate Degree | - | - |
| Total | $55,599 | $37,020 |
Family Income in Forsyth
Family Income Brackets in Forsyth
According to the Forsyth family income data, there are 386 families falling into the $50,000 to $74,999 income range, which is the most common income bracket and makes up 30.4% of all families. Conversely, the $10,000 to $14,999 income bracket is the least frequent group with only 13 families (1.0%) belonging to this category.
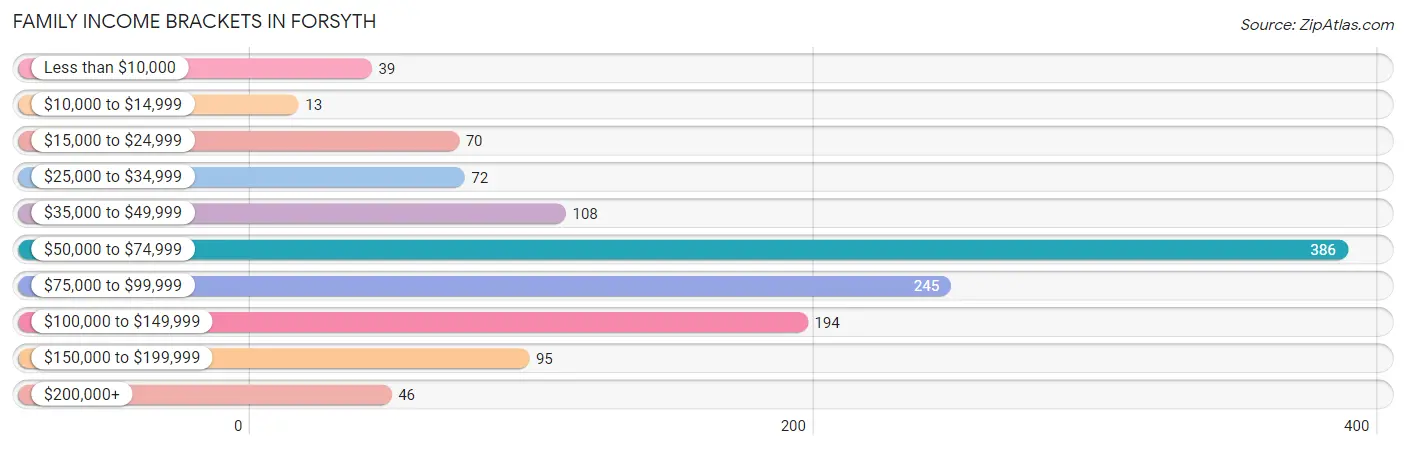
| Income Bracket | # Families | % Families |
| Less than $10,000 | 39 | 3.1% |
| $10,000 to $14,999 | 13 | 1.0% |
| $15,000 to $24,999 | 70 | 5.5% |
| $25,000 to $34,999 | 72 | 5.7% |
| $35,000 to $49,999 | 108 | 8.5% |
| $50,000 to $74,999 | 386 | 30.4% |
| $75,000 to $99,999 | 245 | 19.3% |
| $100,000 to $149,999 | 194 | 15.3% |
| $150,000 to $199,999 | 95 | 7.5% |
| $200,000+ | 46 | 3.6% |
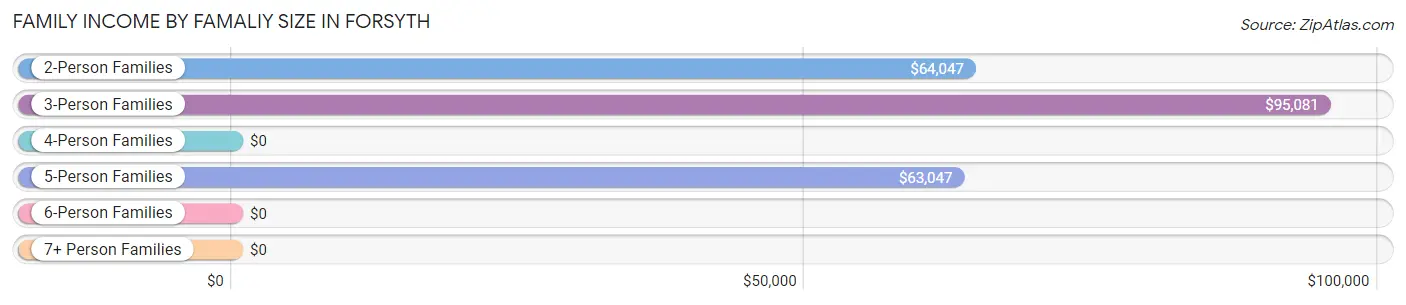
Family Income by Famaliy Size in Forsyth
3-person families (375 | 29.5%) account for the highest median family income in Forsyth with $95,081 per family, while 2-person families (677 | 53.3%) have the highest median income of $32,024 per family member.
| Income Bracket | # Families | Median Income |
| 2-Person Families | 677 (53.3%) | $64,047 |
| 3-Person Families | 375 (29.5%) | $95,081 |
| 4-Person Families | 132 (10.4%) | $0 |
| 5-Person Families | 87 (6.9%) | $63,047 |
| 6-Person Families | 0 (0.0%) | $0 |
| 7+ Person Families | 0 (0.0%) | $0 |
| Total | 1,271 (100.0%) | $64,285 |
Family Income by Number of Earners in Forsyth
The median family income in Forsyth is $64,285, with families comprising 3+ earners (86) having the highest median family income of $148,030, while families with 1 earner (399) have the lowest median family income of $42,120, accounting for 6.8% and 31.4% of families, respectively.
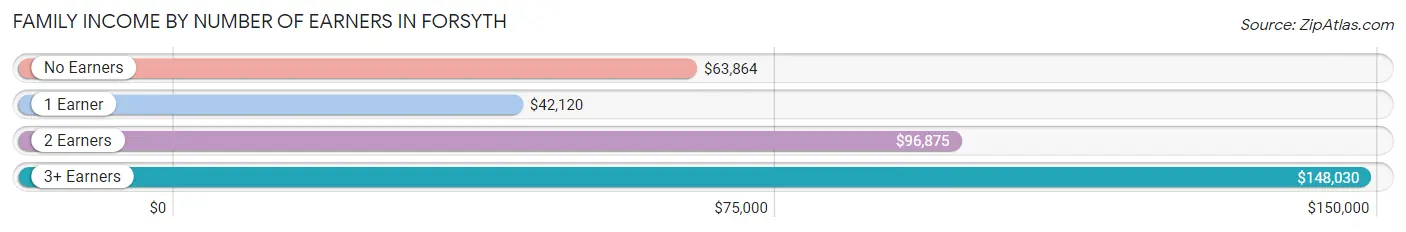
| Number of Earners | # Families | Median Income |
| No Earners | 328 (25.8%) | $63,864 |
| 1 Earner | 399 (31.4%) | $42,120 |
| 2 Earners | 458 (36.0%) | $96,875 |
| 3+ Earners | 86 (6.8%) | $148,030 |
| Total | 1,271 (100.0%) | $64,285 |
Household Income in Forsyth
Household Income Brackets in Forsyth
With 545 households falling in the category, the $50,000 to $74,999 income range is the most frequent in Forsyth, accounting for 27.0% of all households. In contrast, only 54 households (2.7%) fall into the $10,000 to $14,999 income bracket, making it the least populous group.
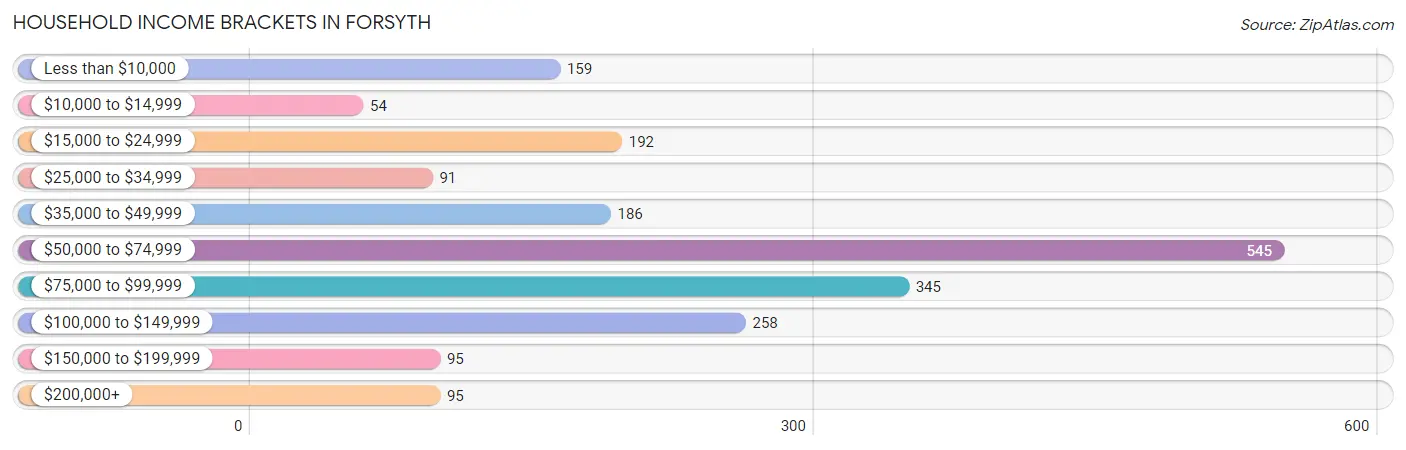
| Income Bracket | # Households | % Households |
| Less than $10,000 | 159 | 7.9% |
| $10,000 to $14,999 | 54 | 2.7% |
| $15,000 to $24,999 | 192 | 9.5% |
| $25,000 to $34,999 | 91 | 4.5% |
| $35,000 to $49,999 | 186 | 9.2% |
| $50,000 to $74,999 | 545 | 27.0% |
| $75,000 to $99,999 | 345 | 17.1% |
| $100,000 to $149,999 | 258 | 12.8% |
| $150,000 to $199,999 | 95 | 4.7% |
| $200,000+ | 95 | 4.7% |
Household Income by Householder Age in Forsyth
The median household income in Forsyth is $63,396, with the highest median household income of $64,869 found in the 65+ years age bracket for the primary householder. A total of 485 households (24.0%) fall into this category. Meanwhile, the 15 to 24 years age bracket for the primary householder has the lowest median household income of $0, with 58 households (2.9%) in this group.
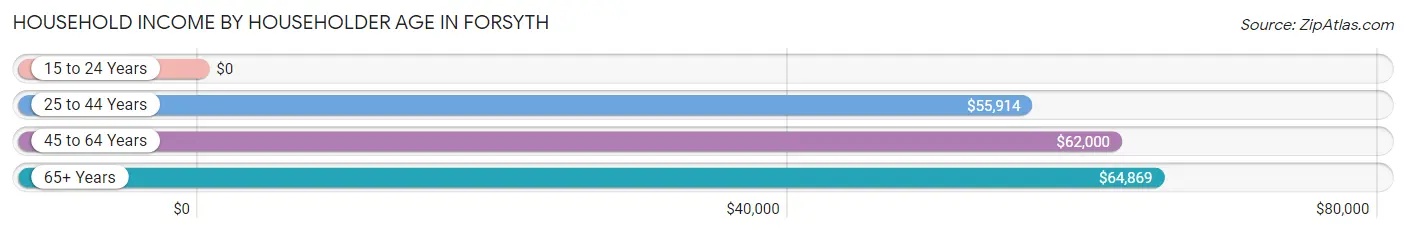
| Income Bracket | # Households | Median Income |
| 15 to 24 Years | 58 (2.9%) | $0 |
| 25 to 44 Years | 737 (36.5%) | $55,914 |
| 45 to 64 Years | 738 (36.6%) | $62,000 |
| 65+ Years | 485 (24.0%) | $64,869 |
| Total | 2,018 (100.0%) | $63,396 |
Poverty in Forsyth
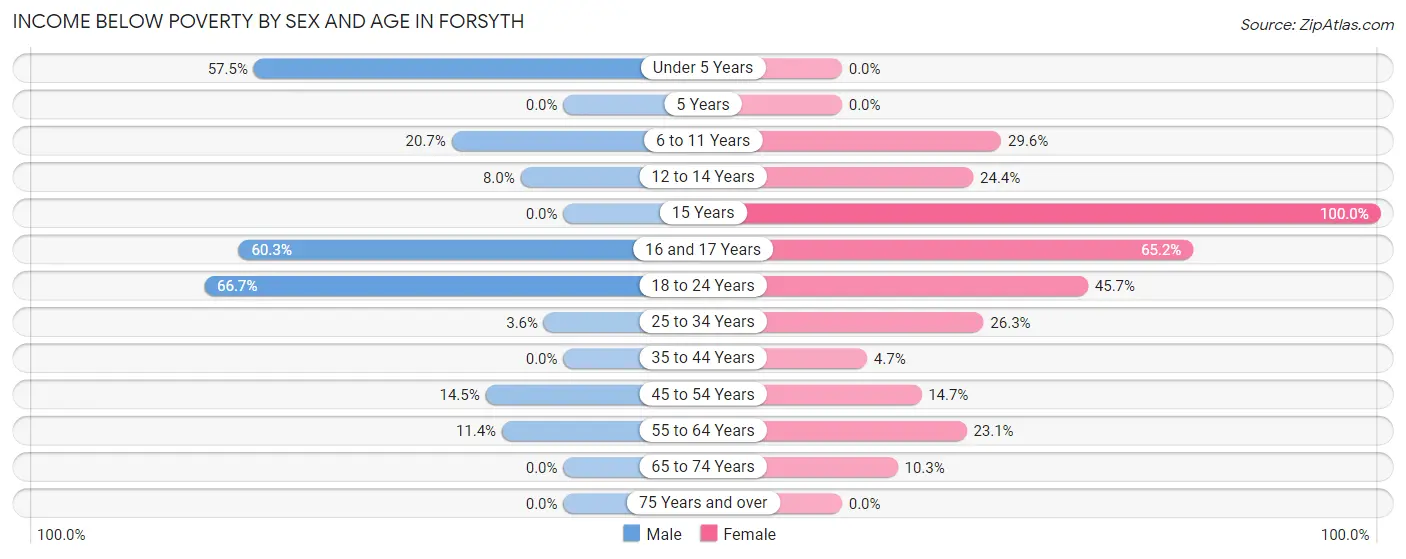
Income Below Poverty by Sex and Age in Forsyth
With 14.1% poverty level for males and 19.5% for females among the residents of Forsyth, 18 to 24 year old males and 15 year old females are the most vulnerable to poverty, with 54 males (66.7%) and 30 females (100.0%) in their respective age groups living below the poverty level.
| Age Bracket | Male | Female |
| Under 5 Years | 50 (57.5%) | 0 (0.0%) |
| 5 Years | 0 (0.0%) | 0 (0.0%) |
| 6 to 11 Years | 39 (20.7%) | 55 (29.6%) |
| 12 to 14 Years | 7 (8.0%) | 29 (24.4%) |
| 15 Years | 0 (0.0%) | 30 (100.0%) |
| 16 and 17 Years | 41 (60.3%) | 60 (65.2%) |
| 18 to 24 Years | 54 (66.7%) | 58 (45.7%) |
| 25 to 34 Years | 15 (3.6%) | 87 (26.3%) |
| 35 to 44 Years | 0 (0.0%) | 13 (4.7%) |
| 45 to 54 Years | 37 (14.4%) | 46 (14.7%) |
| 55 to 64 Years | 26 (11.4%) | 87 (23.1%) |
| 65 to 74 Years | 0 (0.0%) | 18 (10.3%) |
| 75 Years and over | 0 (0.0%) | 0 (0.0%) |
| Total | 269 (14.1%) | 483 (19.5%) |
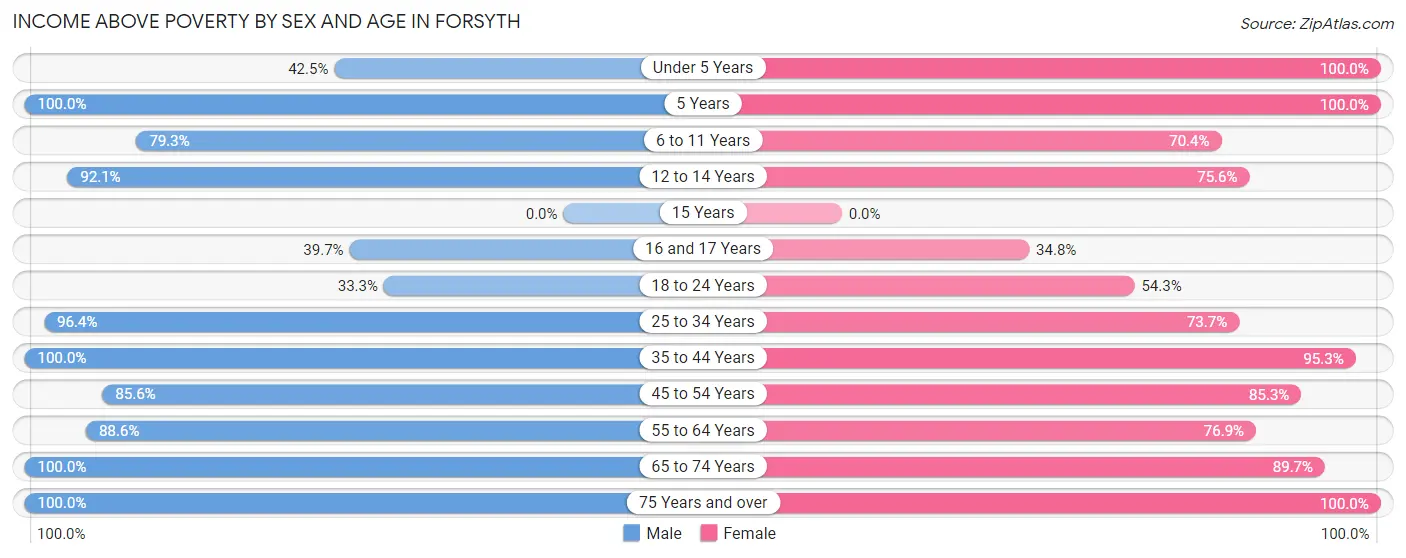
Income Above Poverty by Sex and Age in Forsyth
According to the poverty statistics in Forsyth, males aged 5 years and females aged under 5 years are the age groups that are most secure financially, with 100.0% of males and 100.0% of females in these age groups living above the poverty line.
| Age Bracket | Male | Female |
| Under 5 Years | 37 (42.5%) | 74 (100.0%) |
| 5 Years | 13 (100.0%) | 7 (100.0%) |
| 6 to 11 Years | 149 (79.3%) | 131 (70.4%) |
| 12 to 14 Years | 81 (92.0%) | 90 (75.6%) |
| 15 Years | 0 (0.0%) | 0 (0.0%) |
| 16 and 17 Years | 27 (39.7%) | 32 (34.8%) |
| 18 to 24 Years | 27 (33.3%) | 69 (54.3%) |
| 25 to 34 Years | 399 (96.4%) | 244 (73.7%) |
| 35 to 44 Years | 95 (100.0%) | 266 (95.3%) |
| 45 to 54 Years | 219 (85.6%) | 266 (85.3%) |
| 55 to 64 Years | 202 (88.6%) | 289 (76.9%) |
| 65 to 74 Years | 124 (100.0%) | 156 (89.7%) |
| 75 Years and over | 268 (100.0%) | 376 (100.0%) |
| Total | 1,641 (85.9%) | 2,000 (80.5%) |
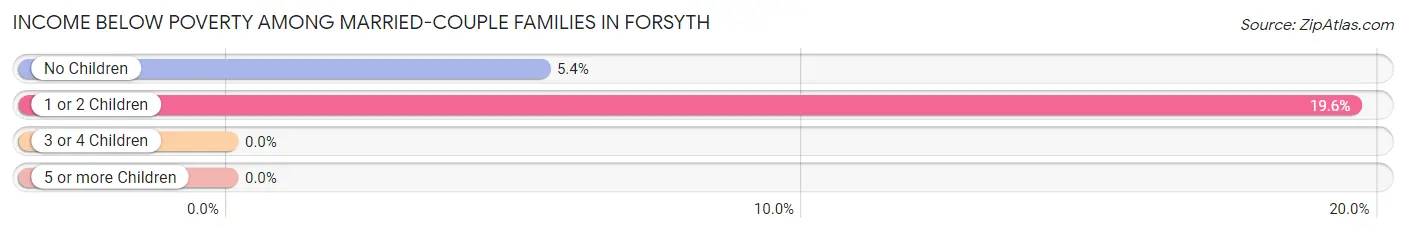
Income Below Poverty Among Married-Couple Families in Forsyth
The poverty statistics for married-couple families in Forsyth show that 8.4% or 67 of the total 802 families live below the poverty line. Families with 1 or 2 children have the highest poverty rate of 19.6%, comprising of 36 families. On the other hand, families with 3 or 4 children have the lowest poverty rate of 0.0%, which includes 0 families.
| Children | Above Poverty | Below Poverty |
| No Children | 540 (94.6%) | 31 (5.4%) |
| 1 or 2 Children | 148 (80.4%) | 36 (19.6%) |
| 3 or 4 Children | 47 (100.0%) | 0 (0.0%) |
| 5 or more Children | 0 (0.0%) | 0 (0.0%) |
| Total | 735 (91.6%) | 67 (8.4%) |
Income Below Poverty Among Single-Parent Households in Forsyth
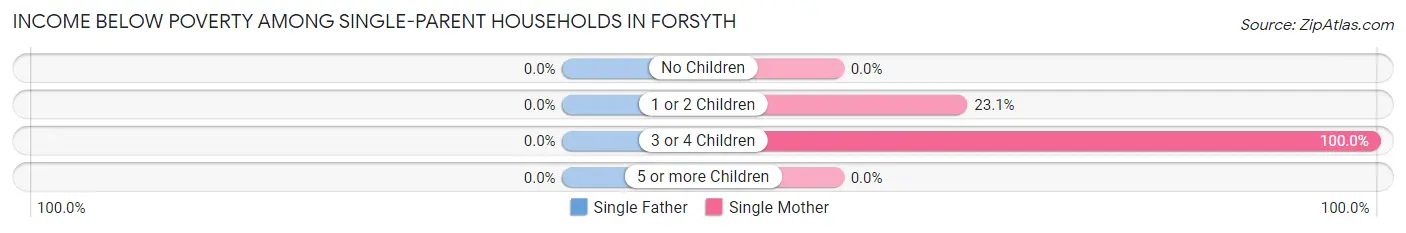
| Children | Single Father | Single Mother |
| No Children | 0 (0.0%) | 0 (0.0%) |
| 1 or 2 Children | 0 (0.0%) | 56 (23.1%) |
| 3 or 4 Children | 0 (0.0%) | 34 (100.0%) |
| 5 or more Children | 0 (0.0%) | 0 (0.0%) |
| Total | 0 (0.0%) | 90 (27.6%) |
Income Below Poverty Among Married-Couple vs Single-Parent Households in Forsyth
The poverty data for Forsyth shows that 67 of the married-couple family households (8.4%) and 90 of the single-parent households (19.2%) are living below the poverty level. Within the married-couple family households, those with 1 or 2 children have the highest poverty rate, with 36 households (19.6%) falling below the poverty line. Among the single-parent households, those with 3 or 4 children have the highest poverty rate, with 34 household (100.0%) living below poverty.
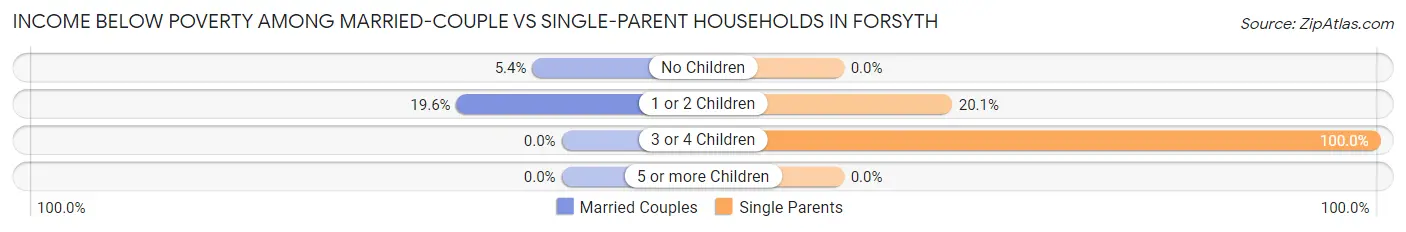
| Children | Married-Couple Families | Single-Parent Households |
| No Children | 31 (5.4%) | 0 (0.0%) |
| 1 or 2 Children | 36 (19.6%) | 56 (20.1%) |
| 3 or 4 Children | 0 (0.0%) | 34 (100.0%) |
| 5 or more Children | 0 (0.0%) | 0 (0.0%) |
| Total | 67 (8.4%) | 90 (19.2%) |
Employment Characteristics in Forsyth
Employment by Class of Employer in Forsyth
Among the 1,955 employed individuals in Forsyth, private company employees (1,149 | 58.8%), state government employees (362 | 18.5%), and local government employees (177 | 9.0%) make up the most common classes of employment.
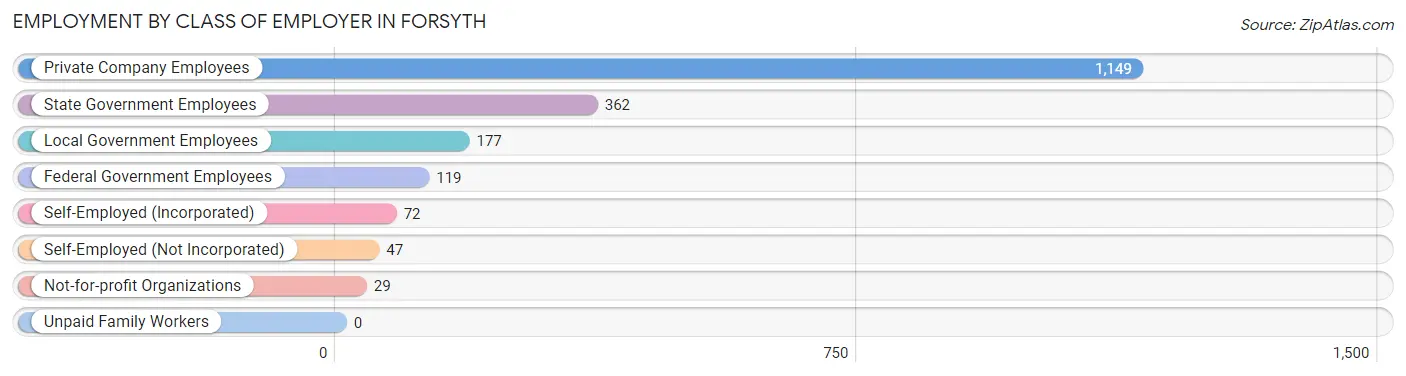
| Employer Class | # Employees | % Employees |
| Private Company Employees | 1,149 | 58.8% |
| Self-Employed (Incorporated) | 72 | 3.7% |
| Self-Employed (Not Incorporated) | 47 | 2.4% |
| Not-for-profit Organizations | 29 | 1.5% |
| Local Government Employees | 177 | 9.0% |
| State Government Employees | 362 | 18.5% |
| Federal Government Employees | 119 | 6.1% |
| Unpaid Family Workers | 0 | 0.0% |
| Total | 1,955 | 100.0% |
Employment Status by Age in Forsyth
According to the labor force statistics for Forsyth, out of the total population over 16 years of age (3,757), 56.4% or 2,119 individuals are in the labor force, with 6.7% or 142 of them unemployed. The age group with the highest labor force participation rate is 30 to 34 years, with 99.4% or 493 individuals in the labor force. Within the labor force, the 16 to 19 years age range has the highest percentage of unemployed individuals, with 45.3% or 53 of them being unemployed.
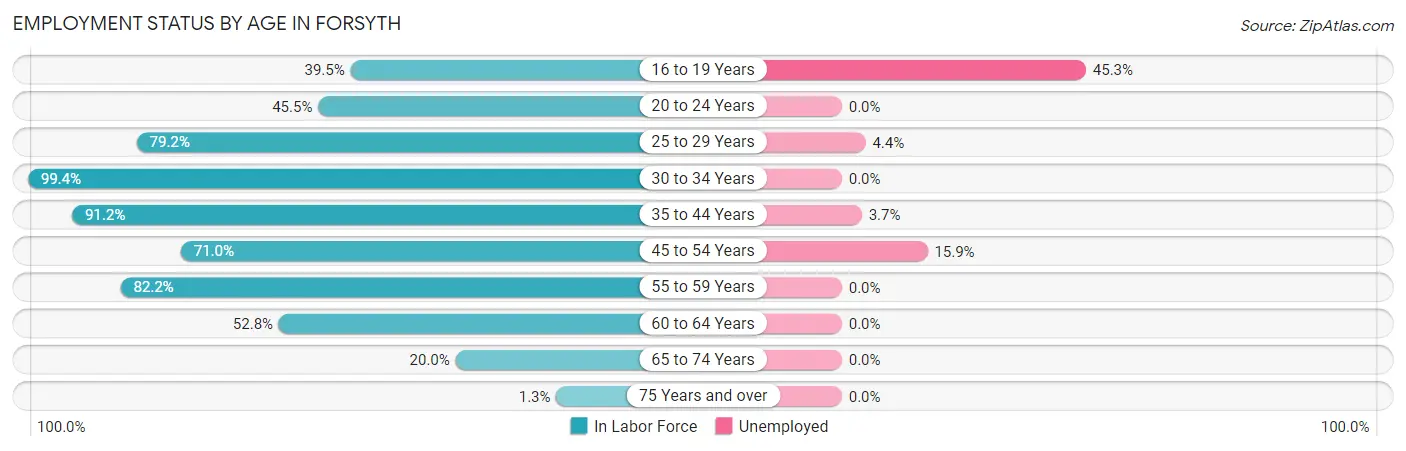
| Age Bracket | In Labor Force | Unemployed |
| 16 to 19 Years | 117 (39.5%) | 53 (45.3%) |
| 20 to 24 Years | 45 (45.5%) | 0 (0.0%) |
| 25 to 29 Years | 205 (79.2%) | 9 (4.4%) |
| 30 to 34 Years | 493 (99.4%) | 0 (0.0%) |
| 35 to 44 Years | 354 (91.2%) | 13 (3.7%) |
| 45 to 54 Years | 416 (71.0%) | 66 (15.9%) |
| 55 to 59 Years | 268 (82.2%) | 0 (0.0%) |
| 60 to 64 Years | 150 (52.8%) | 0 (0.0%) |
| 65 to 74 Years | 62 (20.0%) | 0 (0.0%) |
| 75 Years and over | 9 (1.3%) | 0 (0.0%) |
| Total | 2,119 (56.4%) | 142 (6.7%) |
Employment Status by Educational Attainment in Forsyth
According to labor force statistics for Forsyth, 80.6% of individuals (1,885) out of the total population between 25 and 64 years of age (2,339) are in the labor force, with 4.7% or 89 of them being unemployed. The group with the highest labor force participation rate are those with the educational attainment of bachelor's degree or higher, with 88.8% or 700 individuals in the labor force. Within the labor force, individuals with high school diploma education have the highest percentage of unemployment, with 20.5% or 75 of them being unemployed.
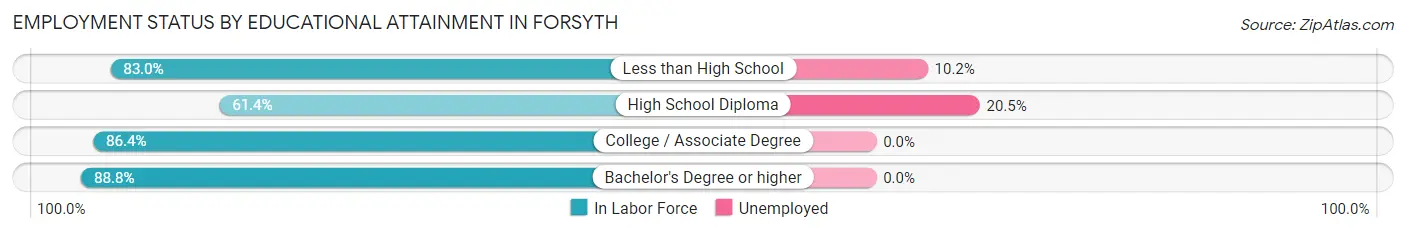
| Educational Attainment | In Labor Force | Unemployed |
| Less than High School | 127 (83.0%) | 16 (10.2%) |
| High School Diploma | 366 (61.4%) | 122 (20.5%) |
| College / Associate Degree | 693 (86.4%) | 0 (0.0%) |
| Bachelor's Degree or higher | 700 (88.8%) | 0 (0.0%) |
| Total | 1,885 (80.6%) | 110 (4.7%) |
Employment Occupations by Sex in Forsyth
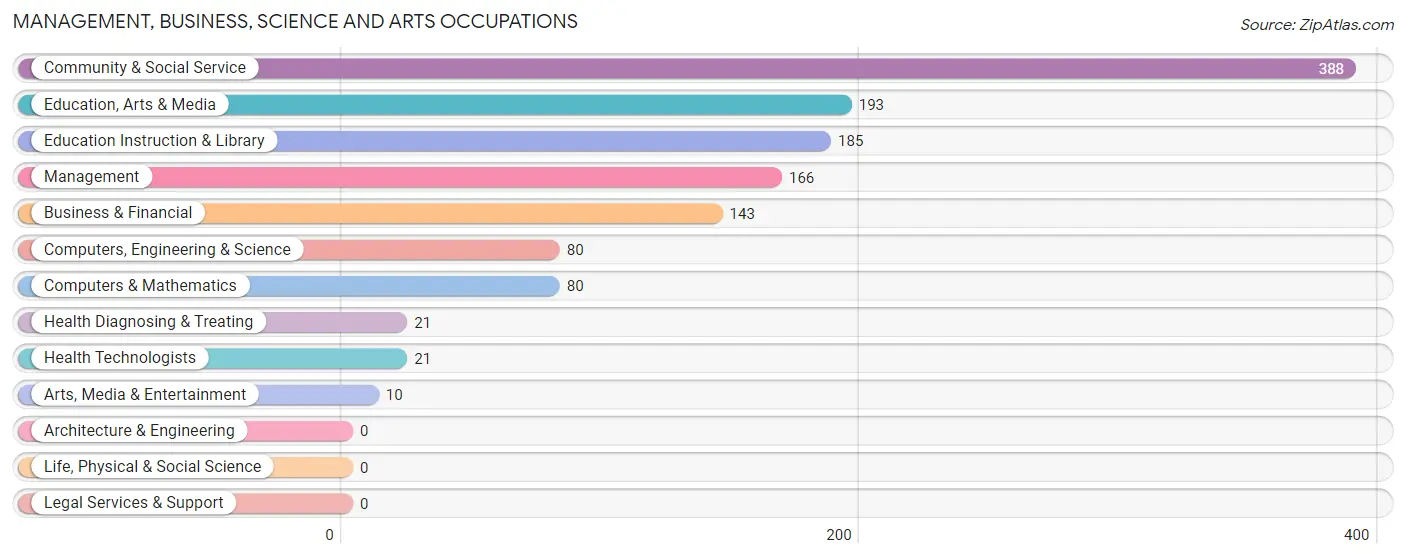
Management, Business, Science and Arts Occupations
The most common Management, Business, Science and Arts occupations in Forsyth are Community & Social Service (388 | 19.6%), Education, Arts & Media (193 | 9.8%), Education Instruction & Library (185 | 9.3%), Management (166 | 8.4%), and Business & Financial (143 | 7.2%).
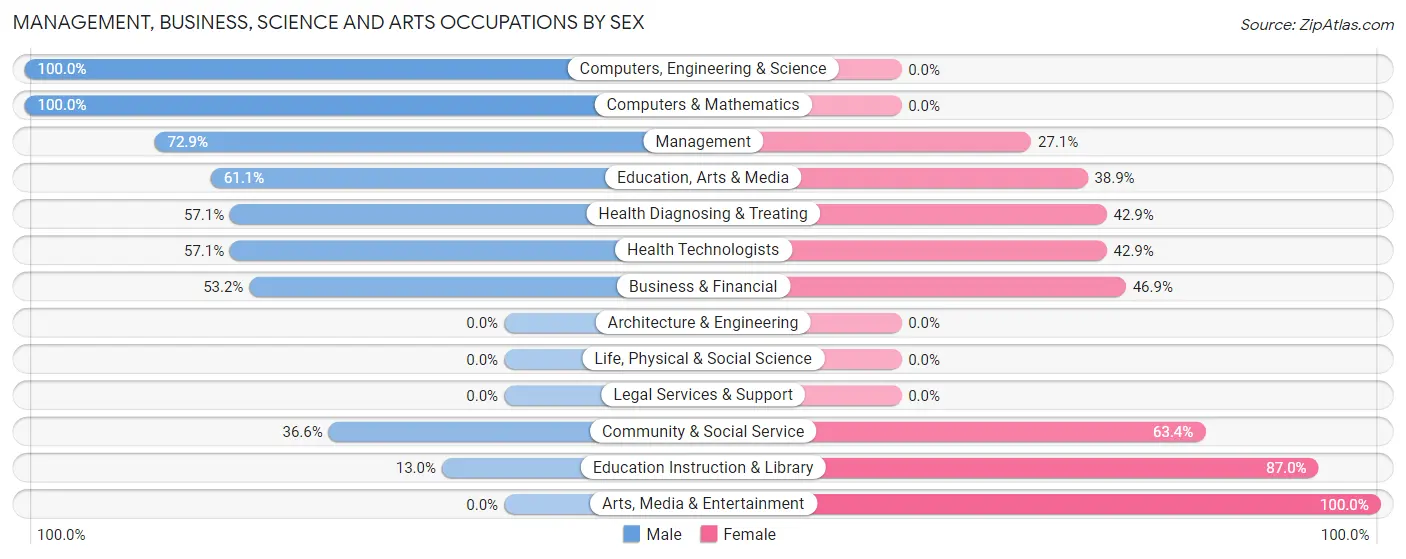
Management, Business, Science and Arts Occupations by Sex
Within the Management, Business, Science and Arts occupations in Forsyth, the most male-oriented occupations are Computers, Engineering & Science (100.0%), Computers & Mathematics (100.0%), and Management (72.9%), while the most female-oriented occupations are Arts, Media & Entertainment (100.0%), Education Instruction & Library (87.0%), and Community & Social Service (63.4%).
| Occupation | Male | Female |
| Management | 121 (72.9%) | 45 (27.1%) |
| Business & Financial | 76 (53.1%) | 67 (46.9%) |
| Computers, Engineering & Science | 80 (100.0%) | 0 (0.0%) |
| Computers & Mathematics | 80 (100.0%) | 0 (0.0%) |
| Architecture & Engineering | 0 (0.0%) | 0 (0.0%) |
| Life, Physical & Social Science | 0 (0.0%) | 0 (0.0%) |
| Community & Social Service | 142 (36.6%) | 246 (63.4%) |
| Education, Arts & Media | 118 (61.1%) | 75 (38.9%) |
| Legal Services & Support | 0 (0.0%) | 0 (0.0%) |
| Education Instruction & Library | 24 (13.0%) | 161 (87.0%) |
| Arts, Media & Entertainment | 0 (0.0%) | 10 (100.0%) |
| Health Diagnosing & Treating | 12 (57.1%) | 9 (42.9%) |
| Health Technologists | 12 (57.1%) | 9 (42.9%) |
| Total (Category) | 431 (54.0%) | 367 (46.0%) |
| Total (Overall) | 983 (49.7%) | 995 (50.3%) |
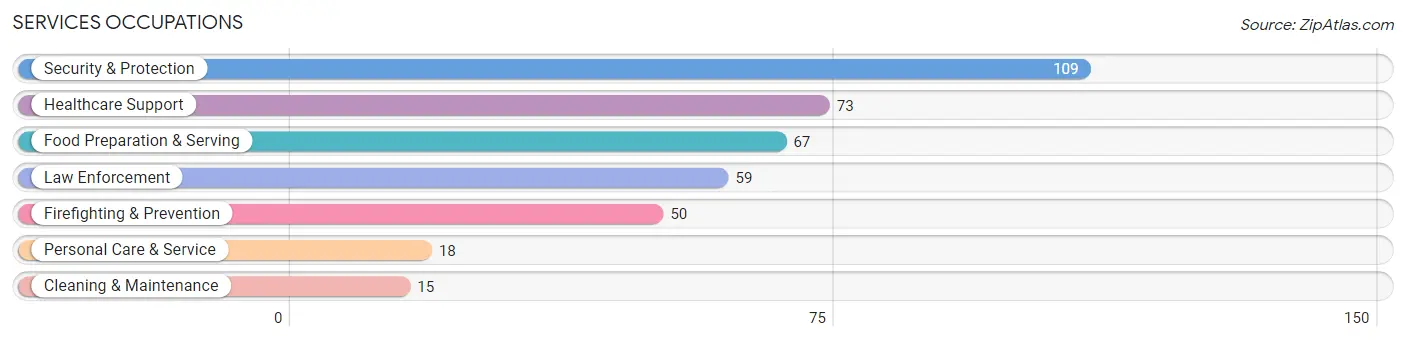
Services Occupations
The most common Services occupations in Forsyth are Security & Protection (109 | 5.5%), Healthcare Support (73 | 3.7%), Food Preparation & Serving (67 | 3.4%), Law Enforcement (59 | 3.0%), and Firefighting & Prevention (50 | 2.5%).
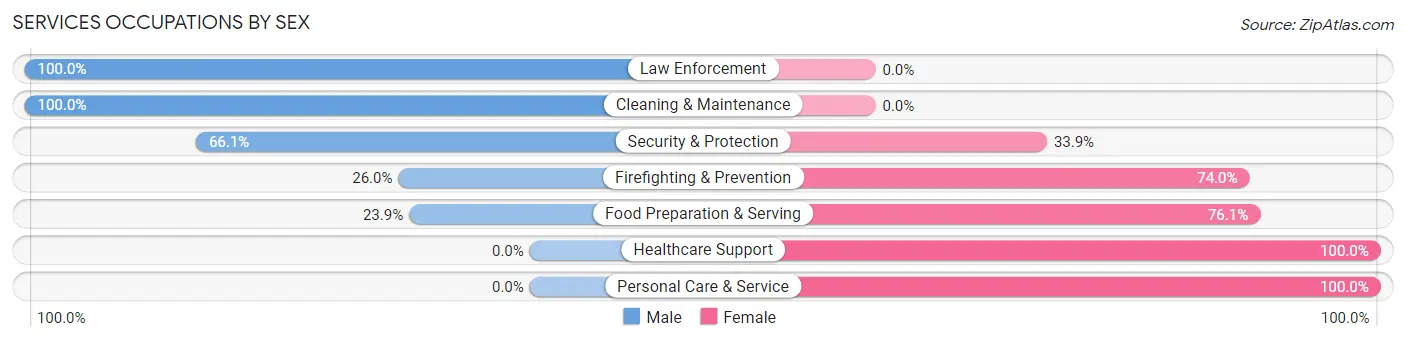
Services Occupations by Sex
Within the Services occupations in Forsyth, the most male-oriented occupations are Law Enforcement (100.0%), Cleaning & Maintenance (100.0%), and Security & Protection (66.1%), while the most female-oriented occupations are Healthcare Support (100.0%), Personal Care & Service (100.0%), and Food Preparation & Serving (76.1%).
| Occupation | Male | Female |
| Healthcare Support | 0 (0.0%) | 73 (100.0%) |
| Security & Protection | 72 (66.1%) | 37 (33.9%) |
| Firefighting & Prevention | 13 (26.0%) | 37 (74.0%) |
| Law Enforcement | 59 (100.0%) | 0 (0.0%) |
| Food Preparation & Serving | 16 (23.9%) | 51 (76.1%) |
| Cleaning & Maintenance | 15 (100.0%) | 0 (0.0%) |
| Personal Care & Service | 0 (0.0%) | 18 (100.0%) |
| Total (Category) | 103 (36.5%) | 179 (63.5%) |
| Total (Overall) | 983 (49.7%) | 995 (50.3%) |
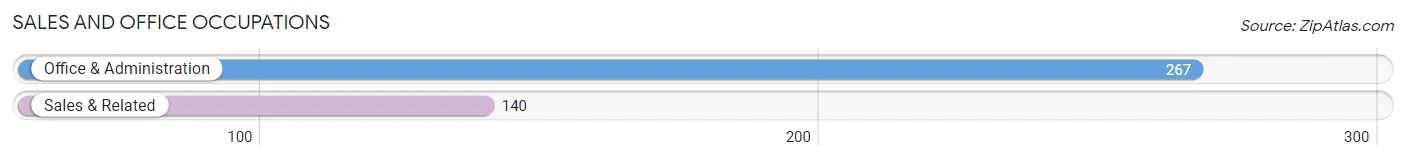
Sales and Office Occupations
The most common Sales and Office occupations in Forsyth are Office & Administration (267 | 13.5%), and Sales & Related (140 | 7.1%).
Sales and Office Occupations by Sex
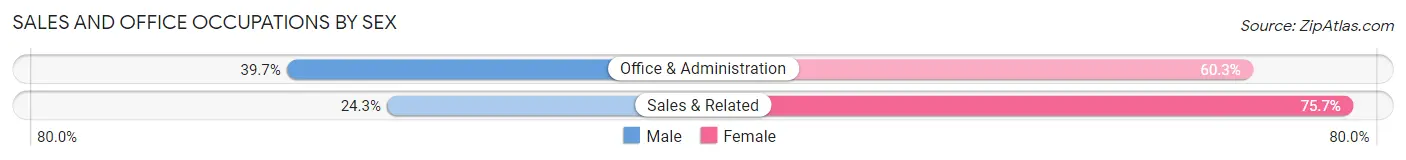
| Occupation | Male | Female |
| Sales & Related | 34 (24.3%) | 106 (75.7%) |
| Office & Administration | 106 (39.7%) | 161 (60.3%) |
| Total (Category) | 140 (34.4%) | 267 (65.6%) |
| Total (Overall) | 983 (49.7%) | 995 (50.3%) |
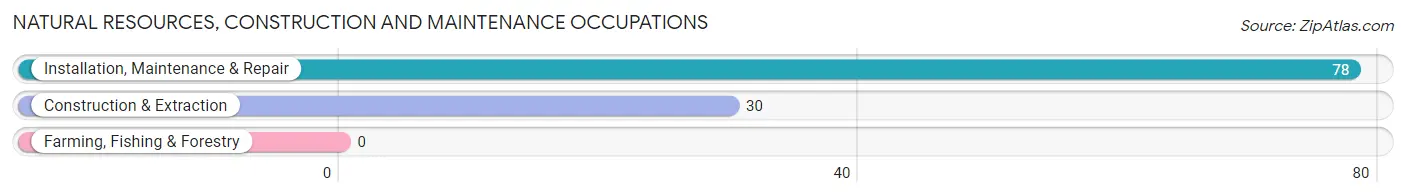
Natural Resources, Construction and Maintenance Occupations
The most common Natural Resources, Construction and Maintenance occupations in Forsyth are Installation, Maintenance & Repair (78 | 3.9%), and Construction & Extraction (30 | 1.5%).
Natural Resources, Construction and Maintenance Occupations by Sex
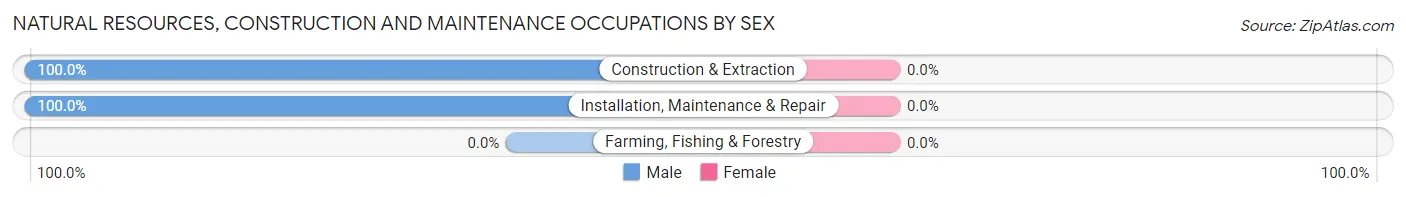
| Occupation | Male | Female |
| Farming, Fishing & Forestry | 0 (0.0%) | 0 (0.0%) |
| Construction & Extraction | 30 (100.0%) | 0 (0.0%) |
| Installation, Maintenance & Repair | 78 (100.0%) | 0 (0.0%) |
| Total (Category) | 108 (100.0%) | 0 (0.0%) |
| Total (Overall) | 983 (49.7%) | 995 (50.3%) |
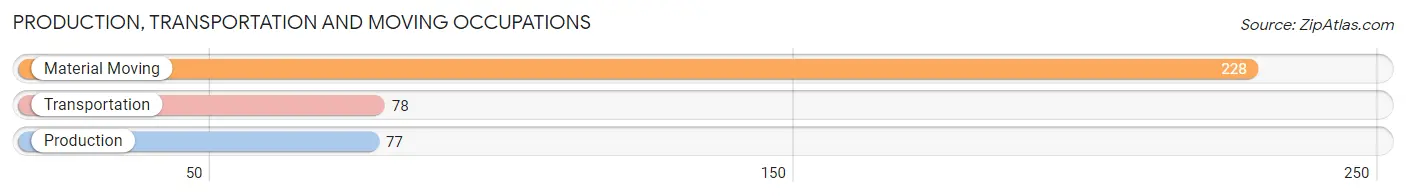
Production, Transportation and Moving Occupations
The most common Production, Transportation and Moving occupations in Forsyth are Material Moving (228 | 11.5%), Transportation (78 | 3.9%), and Production (77 | 3.9%).
Production, Transportation and Moving Occupations by Sex
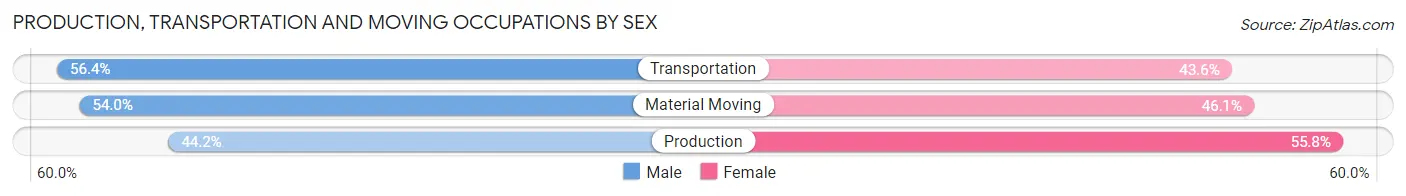
| Occupation | Male | Female |
| Production | 34 (44.2%) | 43 (55.8%) |
| Transportation | 44 (56.4%) | 34 (43.6%) |
| Material Moving | 123 (53.9%) | 105 (46.1%) |
| Total (Category) | 201 (52.5%) | 182 (47.5%) |
| Total (Overall) | 983 (49.7%) | 995 (50.3%) |
Employment Industries by Sex in Forsyth
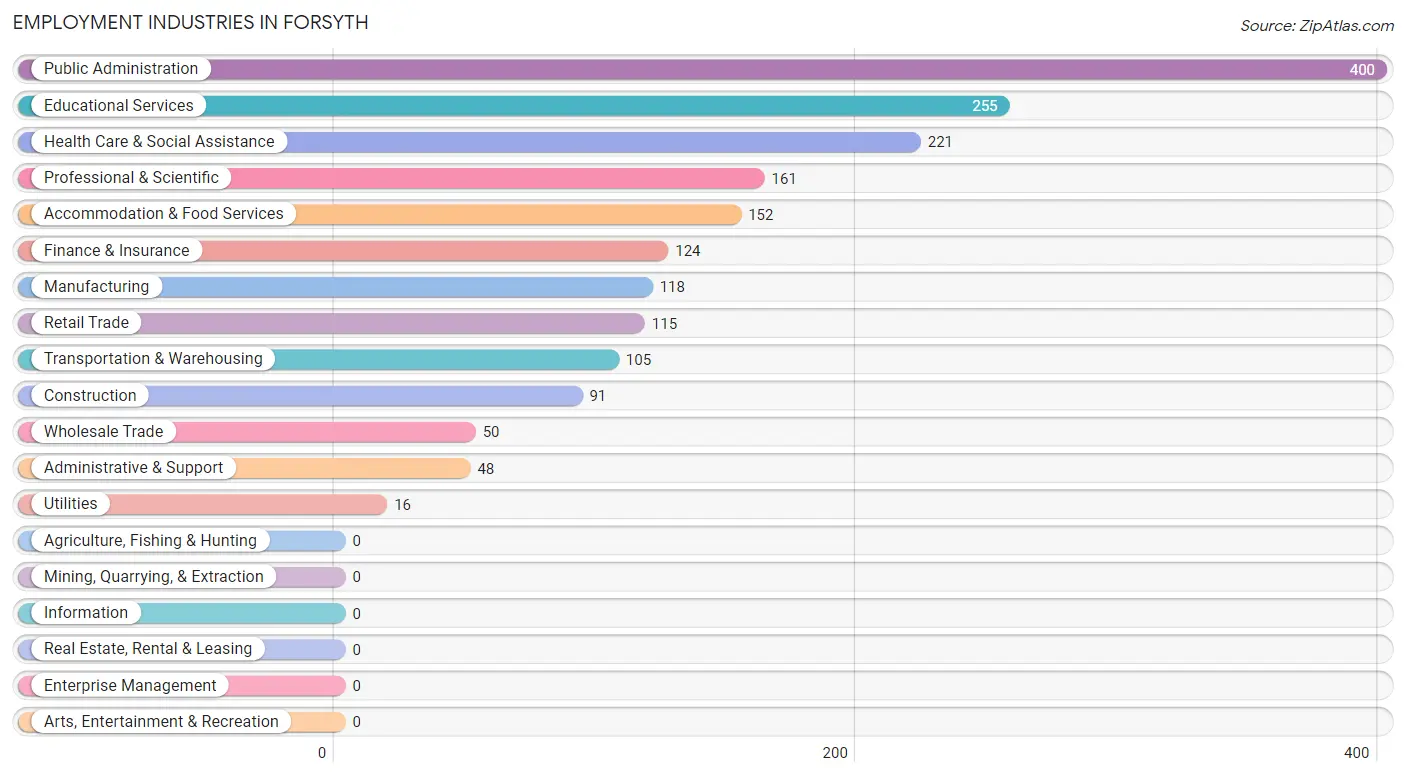
Employment Industries in Forsyth
The major employment industries in Forsyth include Public Administration (400 | 20.2%), Educational Services (255 | 12.9%), Health Care & Social Assistance (221 | 11.2%), Professional & Scientific (161 | 8.1%), and Accommodation & Food Services (152 | 7.7%).
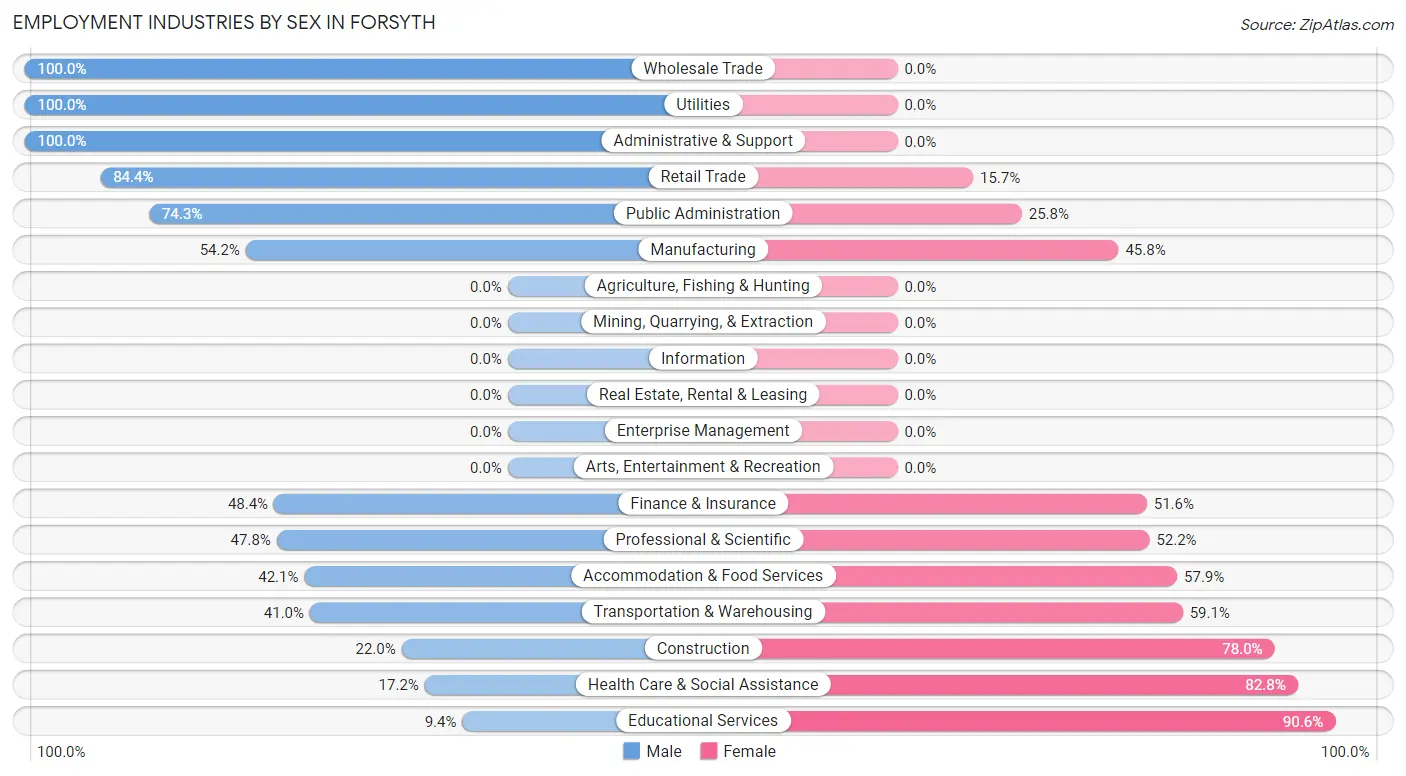
Employment Industries by Sex in Forsyth
The Forsyth industries that see more men than women are Wholesale Trade (100.0%), Utilities (100.0%), and Administrative & Support (100.0%), whereas the industries that tend to have a higher number of women are Educational Services (90.6%), Health Care & Social Assistance (82.8%), and Construction (78.0%).
| Industry | Male | Female |
| Agriculture, Fishing & Hunting | 0 (0.0%) | 0 (0.0%) |
| Mining, Quarrying, & Extraction | 0 (0.0%) | 0 (0.0%) |
| Construction | 20 (22.0%) | 71 (78.0%) |
| Manufacturing | 64 (54.2%) | 54 (45.8%) |
| Wholesale Trade | 50 (100.0%) | 0 (0.0%) |
| Retail Trade | 97 (84.4%) | 18 (15.7%) |
| Transportation & Warehousing | 43 (40.9%) | 62 (59.1%) |
| Utilities | 16 (100.0%) | 0 (0.0%) |
| Information | 0 (0.0%) | 0 (0.0%) |
| Finance & Insurance | 60 (48.4%) | 64 (51.6%) |
| Real Estate, Rental & Leasing | 0 (0.0%) | 0 (0.0%) |
| Professional & Scientific | 77 (47.8%) | 84 (52.2%) |
| Enterprise Management | 0 (0.0%) | 0 (0.0%) |
| Administrative & Support | 48 (100.0%) | 0 (0.0%) |
| Educational Services | 24 (9.4%) | 231 (90.6%) |
| Health Care & Social Assistance | 38 (17.2%) | 183 (82.8%) |
| Arts, Entertainment & Recreation | 0 (0.0%) | 0 (0.0%) |
| Accommodation & Food Services | 64 (42.1%) | 88 (57.9%) |
| Public Administration | 297 (74.3%) | 103 (25.8%) |
| Total | 983 (49.7%) | 995 (50.3%) |
Education in Forsyth
School Enrollment in Forsyth
The most common levels of schooling among the 1,088 students in Forsyth are elementary school (280 | 25.7%), middle school (274 | 25.2%), and college / undergraduate (185 | 17.0%).
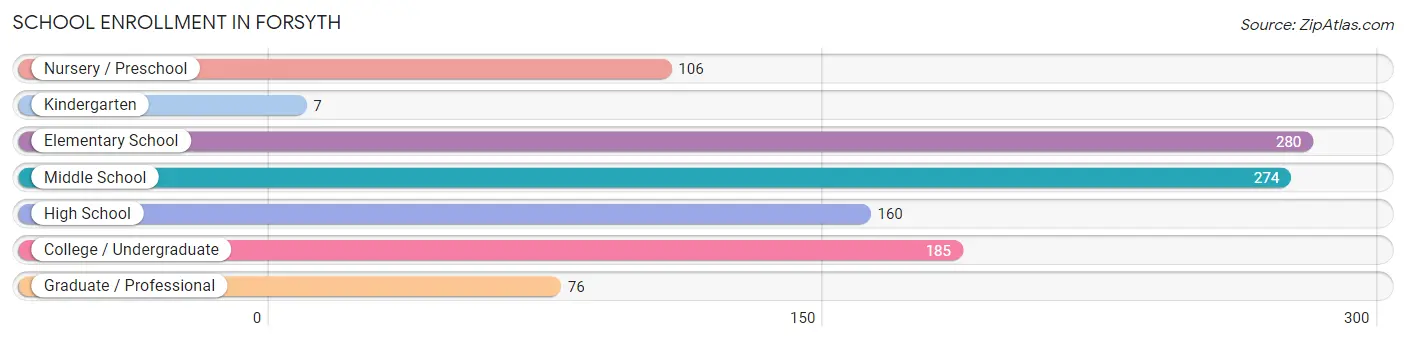
| School Level | # Students | % Students |
| Nursery / Preschool | 106 | 9.7% |
| Kindergarten | 7 | 0.6% |
| Elementary School | 280 | 25.7% |
| Middle School | 274 | 25.2% |
| High School | 160 | 14.7% |
| College / Undergraduate | 185 | 17.0% |
| Graduate / Professional | 76 | 7.0% |
| Total | 1,088 | 100.0% |
School Enrollment by Age by Funding Source in Forsyth
Out of a total of 1,088 students who are enrolled in schools in Forsyth, 154 (14.2%) attend a private institution, while the remaining 934 (85.8%) are enrolled in public schools. The age group of 3 to 4 year olds has the highest likelihood of being enrolled in private schools, with 41 (44.1% in the age bracket) enrolled. Conversely, the age group of 15 to 17 year olds has the lowest likelihood of being enrolled in a private school, with 190 (100.0% in the age bracket) attending a public institution.
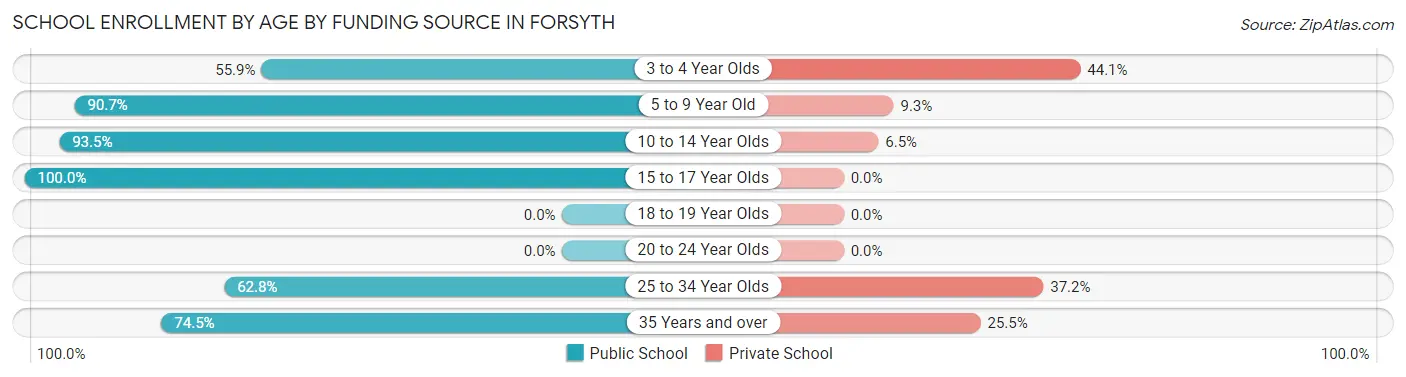
| Age Bracket | Public School | Private School |
| 3 to 4 Year Olds | 52 (55.9%) | 41 (44.1%) |
| 5 to 9 Year Old | 254 (90.7%) | 26 (9.3%) |
| 10 to 14 Year Olds | 275 (93.5%) | 19 (6.5%) |
| 15 to 17 Year Olds | 190 (100.0%) | 0 (0.0%) |
| 18 to 19 Year Olds | 0 (0.0%) | 0 (0.0%) |
| 20 to 24 Year Olds | 0 (0.0%) | 0 (0.0%) |
| 25 to 34 Year Olds | 49 (62.8%) | 29 (37.2%) |
| 35 Years and over | 114 (74.5%) | 39 (25.5%) |
| Total | 934 (85.8%) | 154 (14.2%) |
Educational Attainment by Field of Study in Forsyth
Business (269 | 24.0%), education (184 | 16.4%), bio, nature & agricultural (164 | 14.6%), multidisciplinary studies (108 | 9.6%), and arts & humanities (96 | 8.6%) are the most common fields of study among 1,121 individuals in Forsyth who have obtained a bachelor's degree or higher.
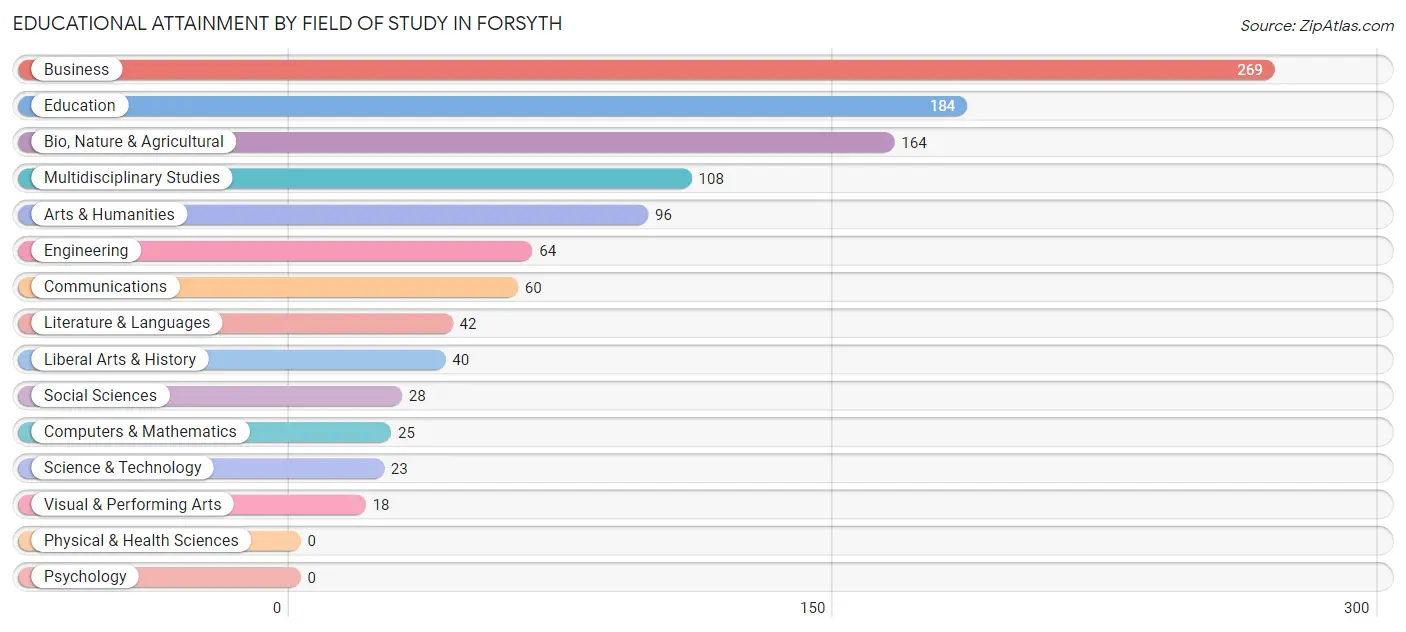
| Field of Study | # Graduates | % Graduates |
| Computers & Mathematics | 25 | 2.2% |
| Bio, Nature & Agricultural | 164 | 14.6% |
| Physical & Health Sciences | 0 | 0.0% |
| Psychology | 0 | 0.0% |
| Social Sciences | 28 | 2.5% |
| Engineering | 64 | 5.7% |
| Multidisciplinary Studies | 108 | 9.6% |
| Science & Technology | 23 | 2.1% |
| Business | 269 | 24.0% |
| Education | 184 | 16.4% |
| Literature & Languages | 42 | 3.7% |
| Liberal Arts & History | 40 | 3.6% |
| Visual & Performing Arts | 18 | 1.6% |
| Communications | 60 | 5.3% |
| Arts & Humanities | 96 | 8.6% |
| Total | 1,121 | 100.0% |
Transportation & Commute in Forsyth
Vehicle Availability by Sex in Forsyth
The most prevalent vehicle ownership categories in Forsyth are males with 2 vehicles (418, accounting for 43.5%) and females with 2 vehicles (258, making up 42.0%).
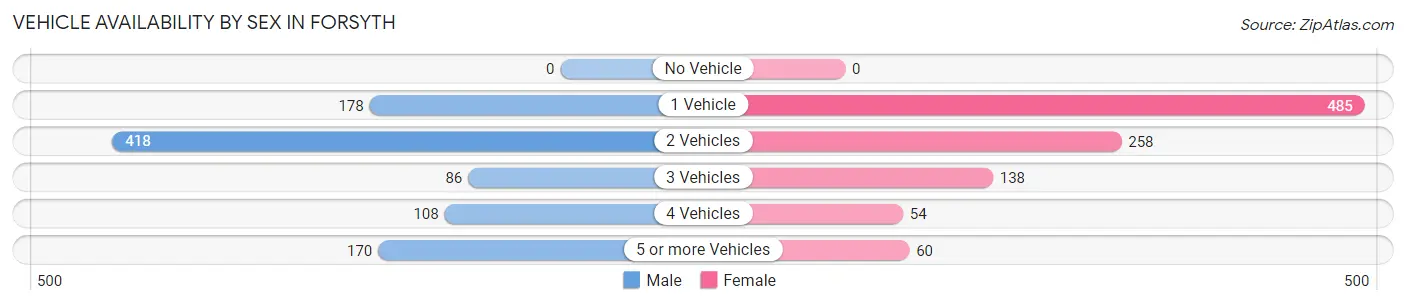
| Vehicles Available | Male | Female |
| No Vehicle | 0 (0.0%) | 0 (0.0%) |
| 1 Vehicle | 178 (18.5%) | 485 (48.7%) |
| 2 Vehicles | 418 (43.5%) | 258 (25.9%) |
| 3 Vehicles | 86 (9.0%) | 138 (13.9%) |
| 4 Vehicles | 108 (11.3%) | 54 (5.4%) |
| 5 or more Vehicles | 170 (17.7%) | 60 (6.0%) |
| Total | 960 (100.0%) | 995 (100.0%) |
Commute Time in Forsyth
The most frequently occuring commute durations in Forsyth are 25 to 29 minutes (342 commuters, 17.6%), 5 to 9 minutes (284 commuters, 14.6%), and 30 to 34 minutes (270 commuters, 13.9%).
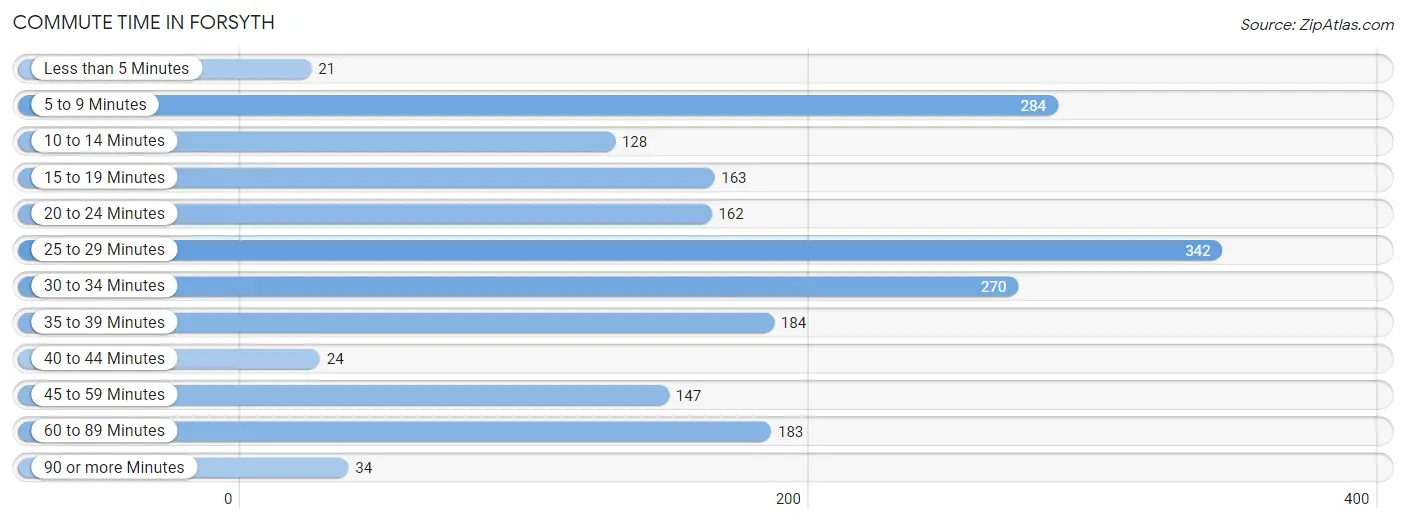
| Commute Time | # Commuters | % Commuters |
| Less than 5 Minutes | 21 | 1.1% |
| 5 to 9 Minutes | 284 | 14.6% |
| 10 to 14 Minutes | 128 | 6.6% |
| 15 to 19 Minutes | 163 | 8.4% |
| 20 to 24 Minutes | 162 | 8.3% |
| 25 to 29 Minutes | 342 | 17.6% |
| 30 to 34 Minutes | 270 | 13.9% |
| 35 to 39 Minutes | 184 | 9.5% |
| 40 to 44 Minutes | 24 | 1.2% |
| 45 to 59 Minutes | 147 | 7.6% |
| 60 to 89 Minutes | 183 | 9.4% |
| 90 or more Minutes | 34 | 1.8% |
Commute Time by Sex in Forsyth
The most common commute times in Forsyth are 25 to 29 minutes (206 commuters, 21.7%) for males and 30 to 34 minutes (154 commuters, 15.5%) for females.
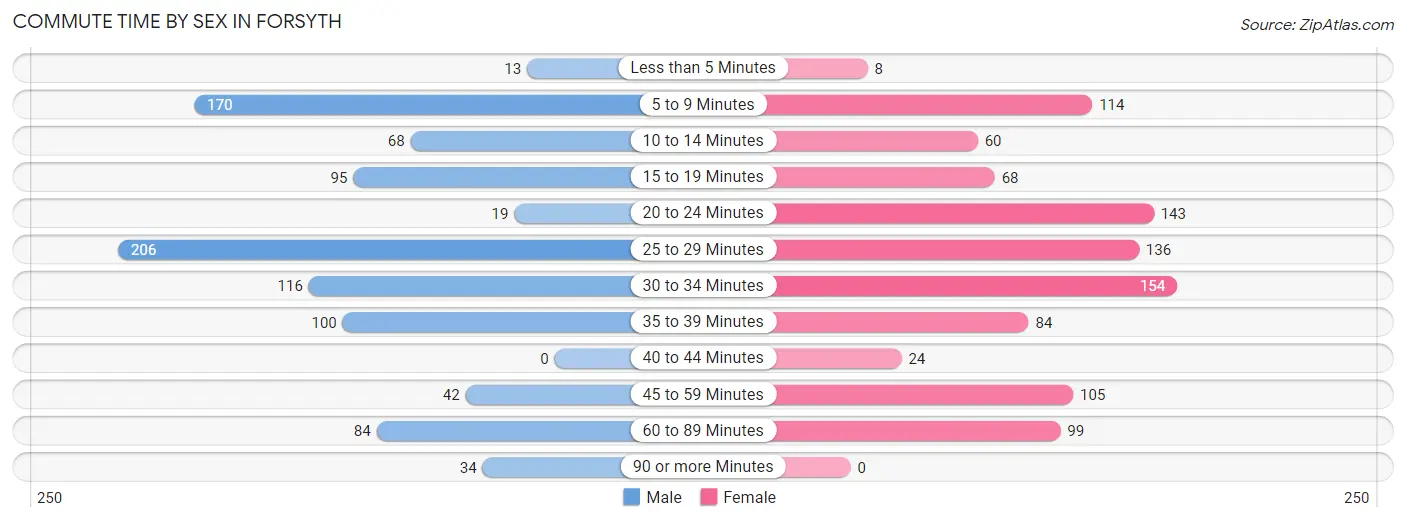
| Commute Time | Male | Female |
| Less than 5 Minutes | 13 (1.4%) | 8 (0.8%) |
| 5 to 9 Minutes | 170 (17.9%) | 114 (11.5%) |
| 10 to 14 Minutes | 68 (7.2%) | 60 (6.0%) |
| 15 to 19 Minutes | 95 (10.0%) | 68 (6.8%) |
| 20 to 24 Minutes | 19 (2.0%) | 143 (14.4%) |
| 25 to 29 Minutes | 206 (21.7%) | 136 (13.7%) |
| 30 to 34 Minutes | 116 (12.2%) | 154 (15.5%) |
| 35 to 39 Minutes | 100 (10.6%) | 84 (8.4%) |
| 40 to 44 Minutes | 0 (0.0%) | 24 (2.4%) |
| 45 to 59 Minutes | 42 (4.4%) | 105 (10.5%) |
| 60 to 89 Minutes | 84 (8.9%) | 99 (10.0%) |
| 90 or more Minutes | 34 (3.6%) | 0 (0.0%) |
Time of Departure to Work by Sex in Forsyth
The most frequent times of departure to work in Forsyth are 7:00 AM to 7:29 AM (265, 28.0%) for males and 7:30 AM to 7:59 AM (234, 23.5%) for females.
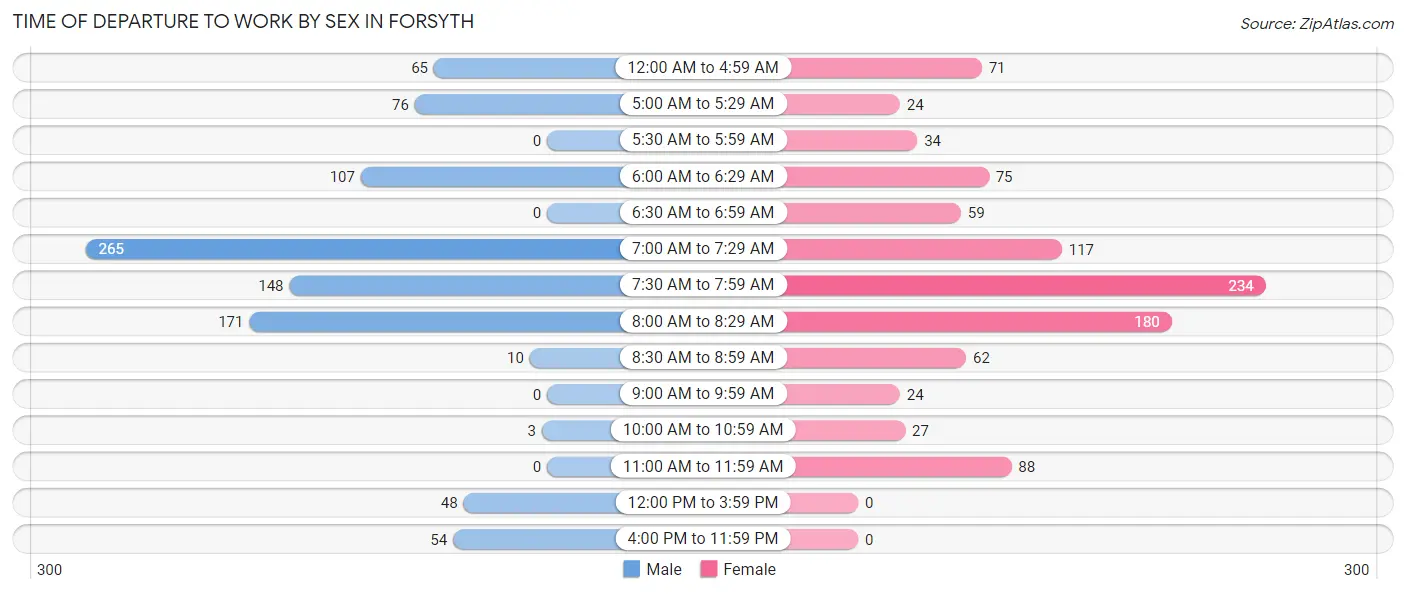
| Time of Departure | Male | Female |
| 12:00 AM to 4:59 AM | 65 (6.9%) | 71 (7.1%) |
| 5:00 AM to 5:29 AM | 76 (8.0%) | 24 (2.4%) |
| 5:30 AM to 5:59 AM | 0 (0.0%) | 34 (3.4%) |
| 6:00 AM to 6:29 AM | 107 (11.3%) | 75 (7.5%) |
| 6:30 AM to 6:59 AM | 0 (0.0%) | 59 (5.9%) |
| 7:00 AM to 7:29 AM | 265 (28.0%) | 117 (11.8%) |
| 7:30 AM to 7:59 AM | 148 (15.6%) | 234 (23.5%) |
| 8:00 AM to 8:29 AM | 171 (18.1%) | 180 (18.1%) |
| 8:30 AM to 8:59 AM | 10 (1.1%) | 62 (6.2%) |
| 9:00 AM to 9:59 AM | 0 (0.0%) | 24 (2.4%) |
| 10:00 AM to 10:59 AM | 3 (0.3%) | 27 (2.7%) |
| 11:00 AM to 11:59 AM | 0 (0.0%) | 88 (8.8%) |
| 12:00 PM to 3:59 PM | 48 (5.1%) | 0 (0.0%) |
| 4:00 PM to 11:59 PM | 54 (5.7%) | 0 (0.0%) |
| Total | 947 (100.0%) | 995 (100.0%) |
Housing Occupancy in Forsyth
Occupancy by Ownership in Forsyth
Of the total 2,018 dwellings in Forsyth, owner-occupied units account for 1,190 (59.0%), while renter-occupied units make up 828 (41.0%).
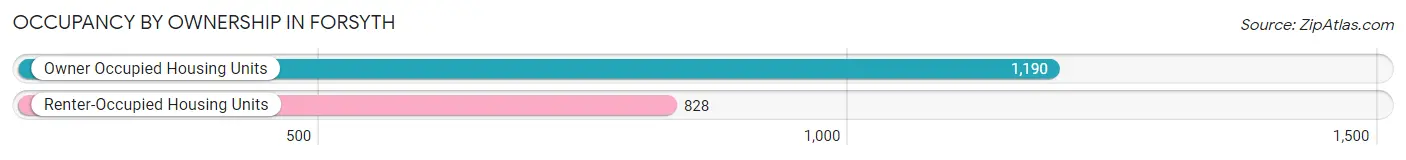
| Occupancy | # Housing Units | % Housing Units |
| Owner Occupied Housing Units | 1,190 | 59.0% |
| Renter-Occupied Housing Units | 828 | 41.0% |
| Total Occupied Housing Units | 2,018 | 100.0% |
Occupancy by Household Size in Forsyth
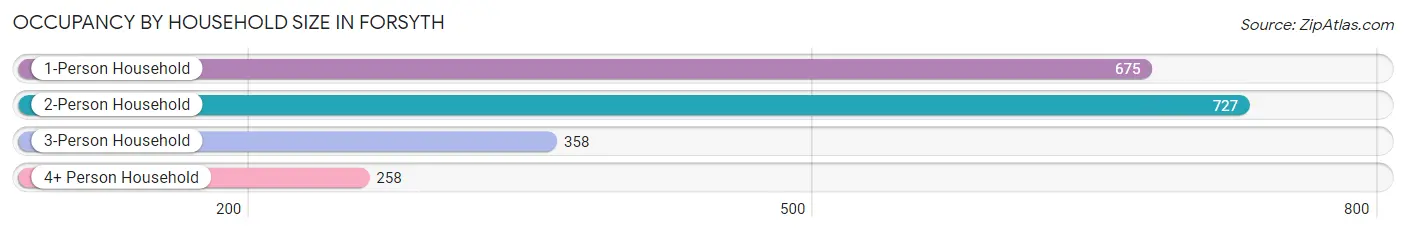
| Household Size | # Housing Units | % Housing Units |
| 1-Person Household | 675 | 33.5% |
| 2-Person Household | 727 | 36.0% |
| 3-Person Household | 358 | 17.7% |
| 4+ Person Household | 258 | 12.8% |
| Total Housing Units | 2,018 | 100.0% |
Occupancy by Ownership by Household Size in Forsyth
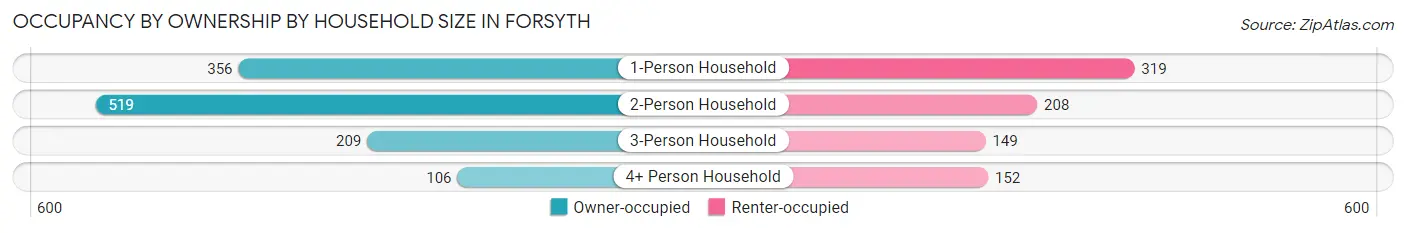
| Household Size | Owner-occupied | Renter-occupied |
| 1-Person Household | 356 (52.7%) | 319 (47.3%) |
| 2-Person Household | 519 (71.4%) | 208 (28.6%) |
| 3-Person Household | 209 (58.4%) | 149 (41.6%) |
| 4+ Person Household | 106 (41.1%) | 152 (58.9%) |
| Total Housing Units | 1,190 (59.0%) | 828 (41.0%) |
Occupancy by Educational Attainment in Forsyth
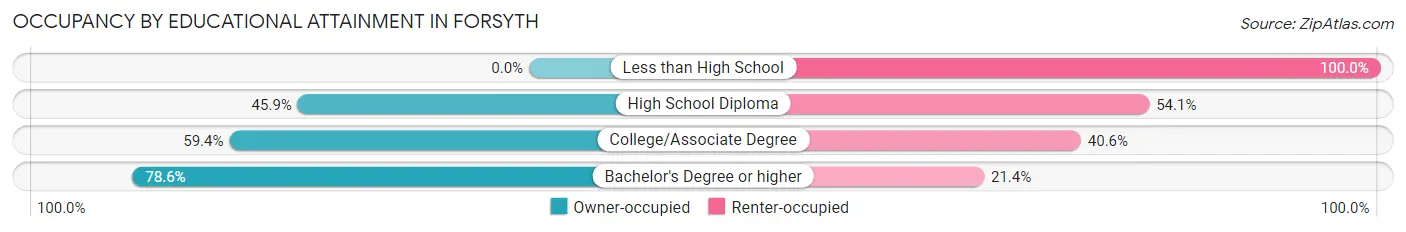
| Household Size | Owner-occupied | Renter-occupied |
| Less than High School | 0 (0.0%) | 91 (100.0%) |
| High School Diploma | 288 (45.9%) | 340 (54.1%) |
| College/Associate Degree | 369 (59.4%) | 252 (40.6%) |
| Bachelor's Degree or higher | 533 (78.6%) | 145 (21.4%) |
Occupancy by Age of Householder in Forsyth
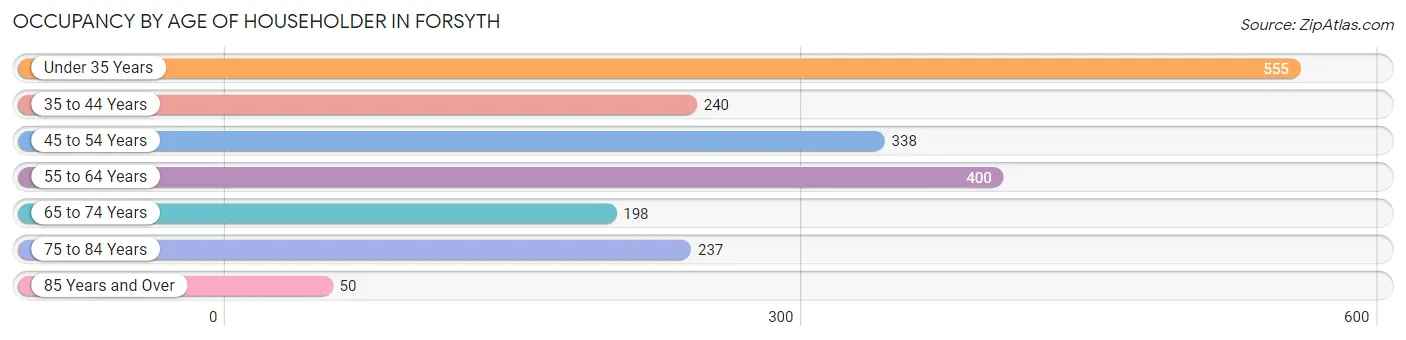
| Age Bracket | # Households | % Households |
| Under 35 Years | 555 | 27.5% |
| 35 to 44 Years | 240 | 11.9% |
| 45 to 54 Years | 338 | 16.8% |
| 55 to 64 Years | 400 | 19.8% |
| 65 to 74 Years | 198 | 9.8% |
| 75 to 84 Years | 237 | 11.7% |
| 85 Years and Over | 50 | 2.5% |
| Total | 2,018 | 100.0% |
Housing Finances in Forsyth
Median Income by Occupancy in Forsyth
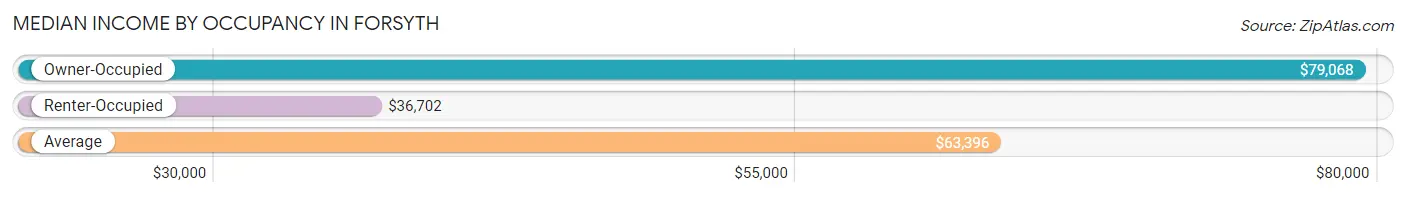
| Occupancy Type | # Households | Median Income |
| Owner-Occupied | 1,190 (59.0%) | $79,068 |
| Renter-Occupied | 828 (41.0%) | $36,702 |
| Average | 2,018 (100.0%) | $63,396 |
Occupancy by Householder Income Bracket in Forsyth
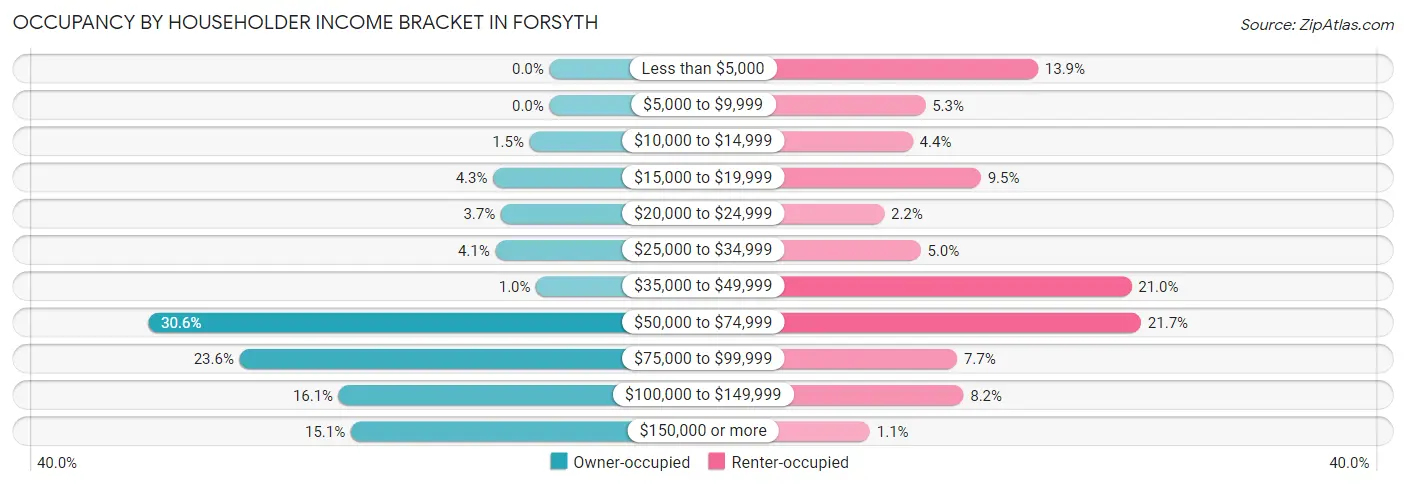
| Income Bracket | Owner-occupied | Renter-occupied |
| Less than $5,000 | 0 (0.0%) | 115 (13.9%) |
| $5,000 to $9,999 | 0 (0.0%) | 44 (5.3%) |
| $10,000 to $14,999 | 18 (1.5%) | 36 (4.3%) |
| $15,000 to $19,999 | 51 (4.3%) | 79 (9.5%) |
| $20,000 to $24,999 | 44 (3.7%) | 18 (2.2%) |
| $25,000 to $34,999 | 49 (4.1%) | 41 (5.0%) |
| $35,000 to $49,999 | 12 (1.0%) | 174 (21.0%) |
| $50,000 to $74,999 | 364 (30.6%) | 180 (21.7%) |
| $75,000 to $99,999 | 281 (23.6%) | 64 (7.7%) |
| $100,000 to $149,999 | 191 (16.1%) | 68 (8.2%) |
| $150,000 or more | 180 (15.1%) | 9 (1.1%) |
| Total | 1,190 (100.0%) | 828 (100.0%) |
Monthly Housing Cost Tiers in Forsyth
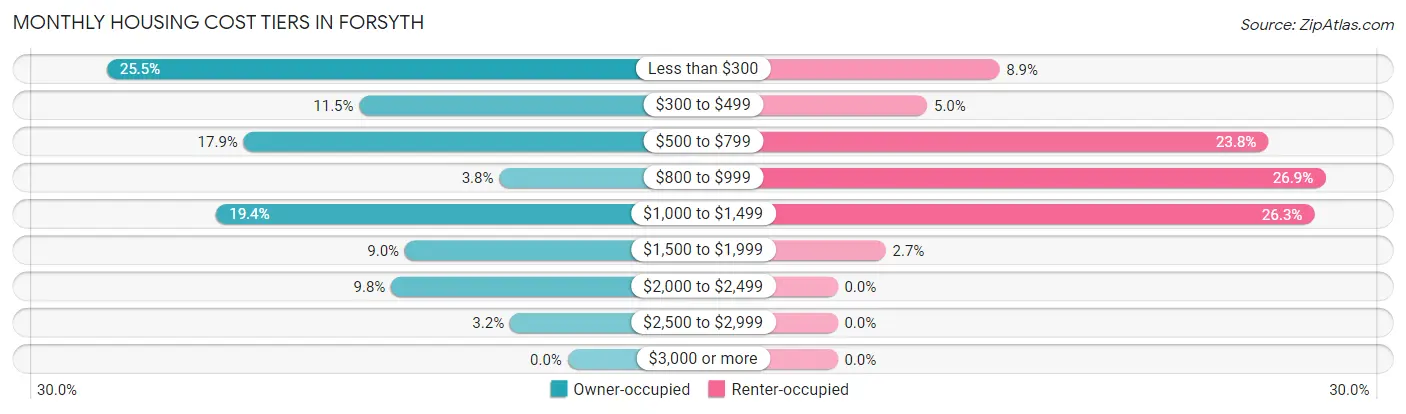
| Monthly Cost | Owner-occupied | Renter-occupied |
| Less than $300 | 303 (25.5%) | 74 (8.9%) |
| $300 to $499 | 137 (11.5%) | 41 (5.0%) |
| $500 to $799 | 213 (17.9%) | 197 (23.8%) |
| $800 to $999 | 45 (3.8%) | 223 (26.9%) |
| $1,000 to $1,499 | 231 (19.4%) | 218 (26.3%) |
| $1,500 to $1,999 | 107 (9.0%) | 22 (2.7%) |
| $2,000 to $2,499 | 116 (9.8%) | 0 (0.0%) |
| $2,500 to $2,999 | 38 (3.2%) | 0 (0.0%) |
| $3,000 or more | 0 (0.0%) | 0 (0.0%) |
| Total | 1,190 (100.0%) | 828 (100.0%) |
Physical Housing Characteristics in Forsyth
Housing Structures in Forsyth
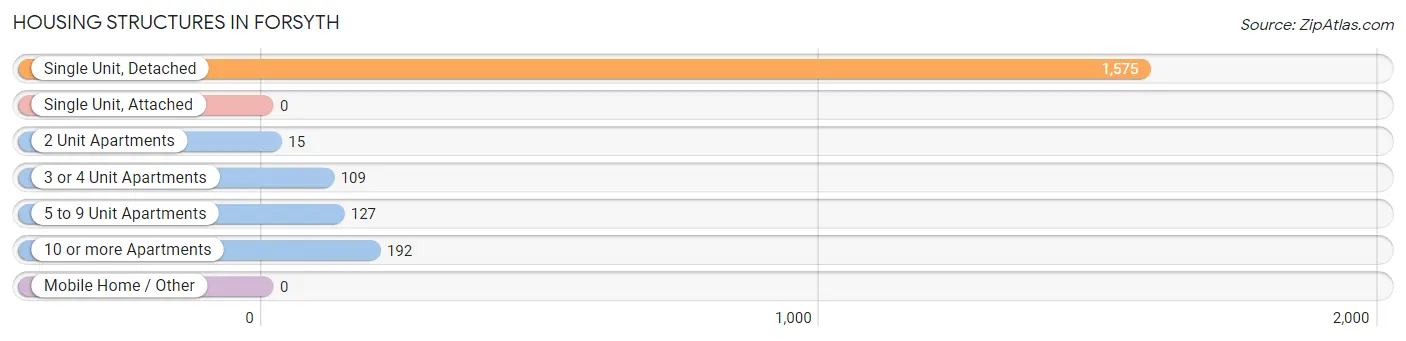
| Structure Type | # Housing Units | % Housing Units |
| Single Unit, Detached | 1,575 | 78.0% |
| Single Unit, Attached | 0 | 0.0% |
| 2 Unit Apartments | 15 | 0.7% |
| 3 or 4 Unit Apartments | 109 | 5.4% |
| 5 to 9 Unit Apartments | 127 | 6.3% |
| 10 or more Apartments | 192 | 9.5% |
| Mobile Home / Other | 0 | 0.0% |
| Total | 2,018 | 100.0% |
Housing Structures by Occupancy in Forsyth
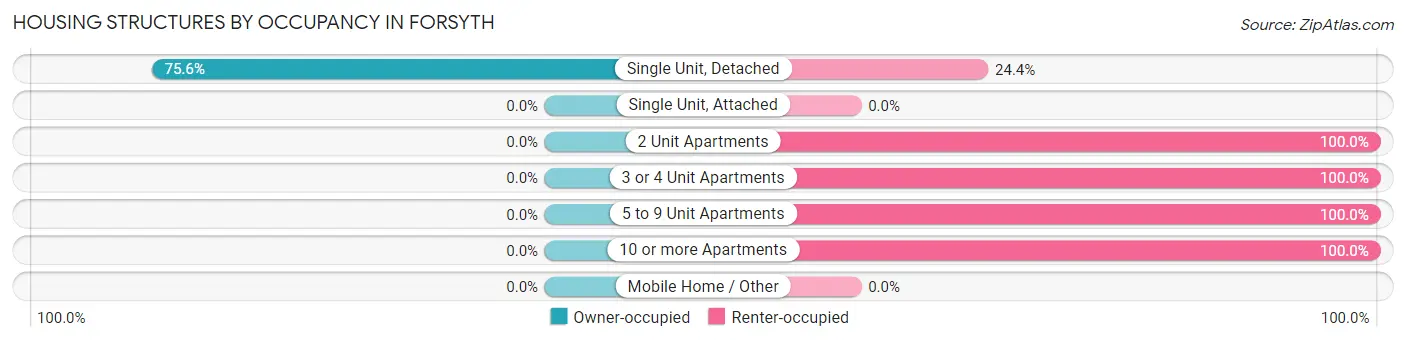
| Structure Type | Owner-occupied | Renter-occupied |
| Single Unit, Detached | 1,190 (75.6%) | 385 (24.4%) |
| Single Unit, Attached | 0 (0.0%) | 0 (0.0%) |
| 2 Unit Apartments | 0 (0.0%) | 15 (100.0%) |
| 3 or 4 Unit Apartments | 0 (0.0%) | 109 (100.0%) |
| 5 to 9 Unit Apartments | 0 (0.0%) | 127 (100.0%) |
| 10 or more Apartments | 0 (0.0%) | 192 (100.0%) |
| Mobile Home / Other | 0 (0.0%) | 0 (0.0%) |
| Total | 1,190 (59.0%) | 828 (41.0%) |
Housing Structures by Number of Rooms in Forsyth
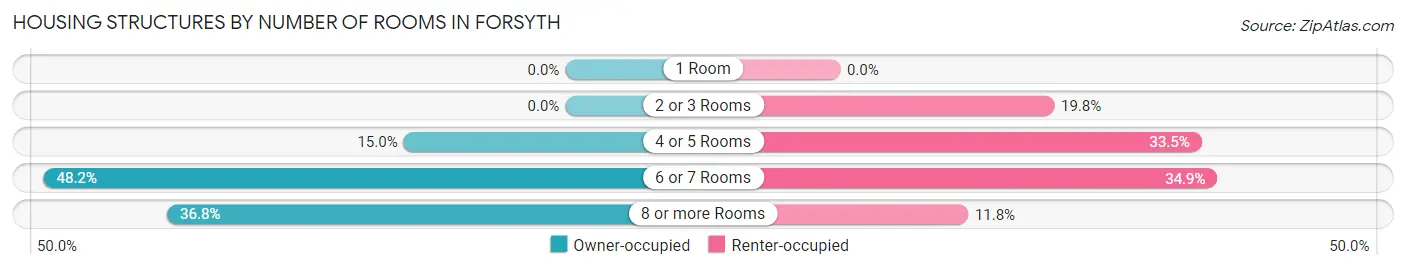
| Number of Rooms | Owner-occupied | Renter-occupied |
| 1 Room | 0 (0.0%) | 0 (0.0%) |
| 2 or 3 Rooms | 0 (0.0%) | 164 (19.8%) |
| 4 or 5 Rooms | 178 (15.0%) | 277 (33.5%) |
| 6 or 7 Rooms | 574 (48.2%) | 289 (34.9%) |
| 8 or more Rooms | 438 (36.8%) | 98 (11.8%) |
| Total | 1,190 (100.0%) | 828 (100.0%) |
Housing Structure by Heating Type in Forsyth
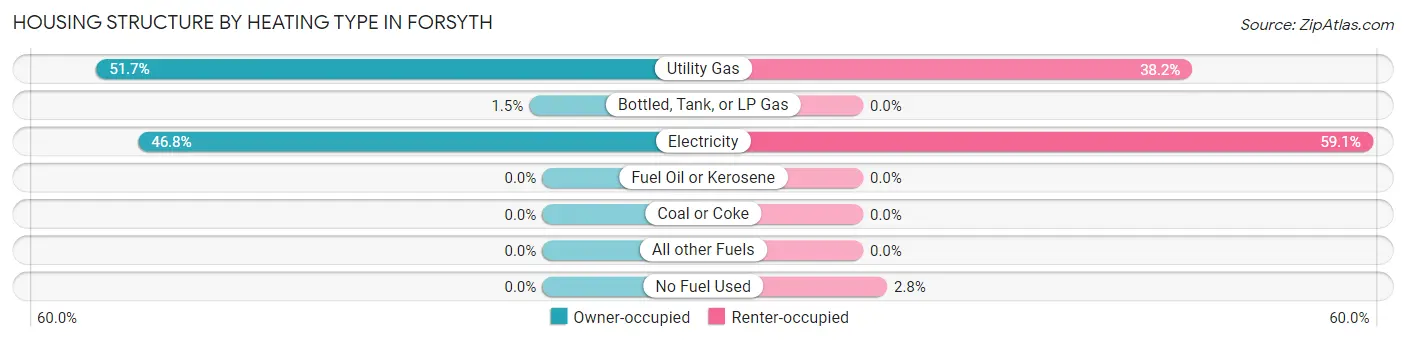
| Heating Type | Owner-occupied | Renter-occupied |
| Utility Gas | 615 (51.7%) | 316 (38.2%) |
| Bottled, Tank, or LP Gas | 18 (1.5%) | 0 (0.0%) |
| Electricity | 557 (46.8%) | 489 (59.1%) |
| Fuel Oil or Kerosene | 0 (0.0%) | 0 (0.0%) |
| Coal or Coke | 0 (0.0%) | 0 (0.0%) |
| All other Fuels | 0 (0.0%) | 0 (0.0%) |
| No Fuel Used | 0 (0.0%) | 23 (2.8%) |
| Total | 1,190 (100.0%) | 828 (100.0%) |
Household Vehicle Usage in Forsyth
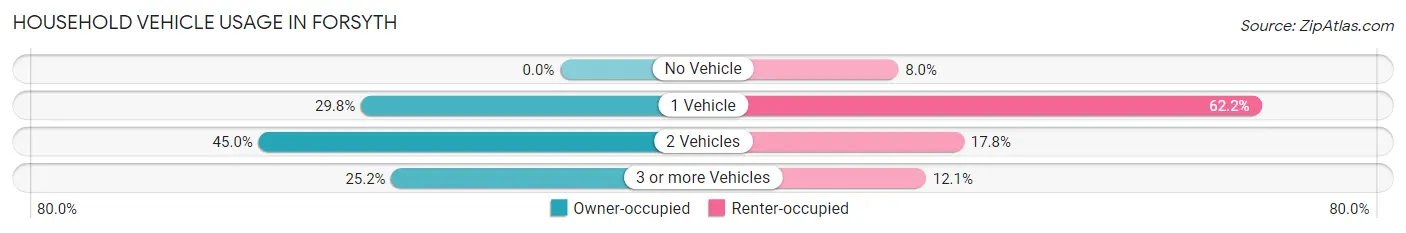
| Vehicles per Household | Owner-occupied | Renter-occupied |
| No Vehicle | 0 (0.0%) | 66 (8.0%) |
| 1 Vehicle | 354 (29.7%) | 515 (62.2%) |
| 2 Vehicles | 536 (45.0%) | 147 (17.7%) |
| 3 or more Vehicles | 300 (25.2%) | 100 (12.1%) |
| Total | 1,190 (100.0%) | 828 (100.0%) |
Real Estate & Mortgages in Forsyth
Real Estate and Mortgage Overview in Forsyth
| Characteristic | Without Mortgage | With Mortgage |
| Housing Units | 639 | 551 |
| Median Property Value | $155,600 | $198,800 |
| Median Household Income | $64,694 | $143 |
| Monthly Housing Costs | $312 | $0 |
| Real Estate Taxes | $631 | $0 |
Property Value by Mortgage Status in Forsyth
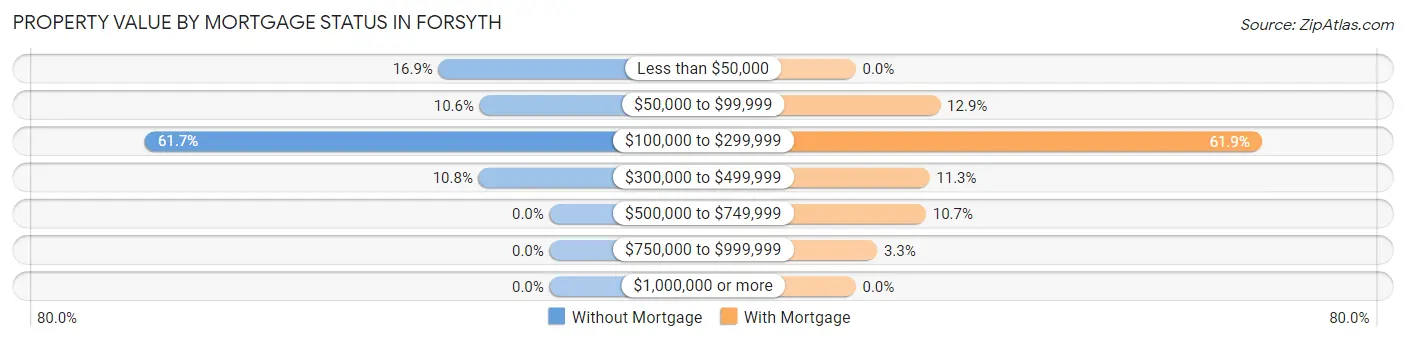
| Property Value | Without Mortgage | With Mortgage |
| Less than $50,000 | 108 (16.9%) | 0 (0.0%) |
| $50,000 to $99,999 | 68 (10.6%) | 71 (12.9%) |
| $100,000 to $299,999 | 394 (61.7%) | 341 (61.9%) |
| $300,000 to $499,999 | 69 (10.8%) | 62 (11.3%) |
| $500,000 to $749,999 | 0 (0.0%) | 59 (10.7%) |
| $750,000 to $999,999 | 0 (0.0%) | 18 (3.3%) |
| $1,000,000 or more | 0 (0.0%) | 0 (0.0%) |
| Total | 639 (100.0%) | 551 (100.0%) |
Household Income by Mortgage Status in Forsyth
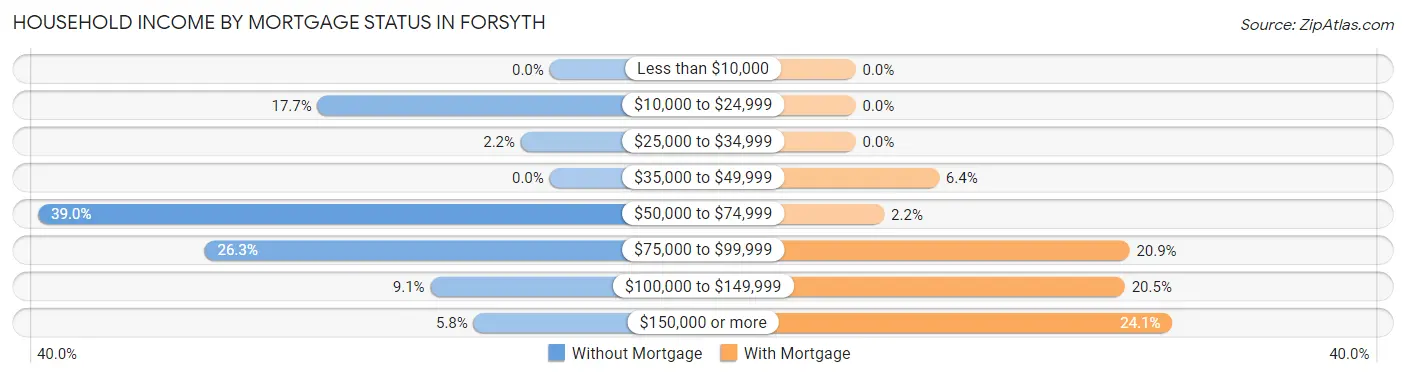
| Household Income | Without Mortgage | With Mortgage |
| Less than $10,000 | 0 (0.0%) | 0 (0.0%) |
| $10,000 to $24,999 | 113 (17.7%) | 0 (0.0%) |
| $25,000 to $34,999 | 14 (2.2%) | 0 (0.0%) |
| $35,000 to $49,999 | 0 (0.0%) | 35 (6.4%) |
| $50,000 to $74,999 | 249 (39.0%) | 12 (2.2%) |
| $75,000 to $99,999 | 168 (26.3%) | 115 (20.9%) |
| $100,000 to $149,999 | 58 (9.1%) | 113 (20.5%) |
| $150,000 or more | 37 (5.8%) | 133 (24.1%) |
| Total | 639 (100.0%) | 551 (100.0%) |
Property Value to Household Income Ratio in Forsyth
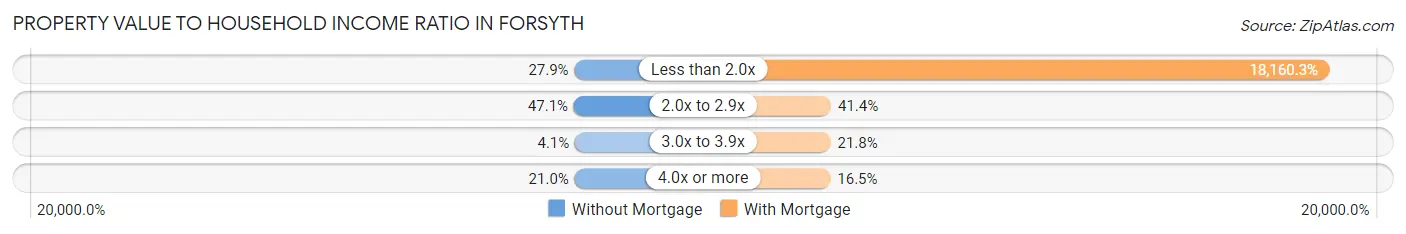
| Value-to-Income Ratio | Without Mortgage | With Mortgage |
| Less than 2.0x | 178 (27.9%) | 100,063 (18,160.2%) |
| 2.0x to 2.9x | 301 (47.1%) | 228 (41.4%) |
| 3.0x to 3.9x | 26 (4.1%) | 120 (21.8%) |
| 4.0x or more | 134 (21.0%) | 91 (16.5%) |
| Total | 639 (100.0%) | 551 (100.0%) |
Real Estate Taxes by Mortgage Status in Forsyth
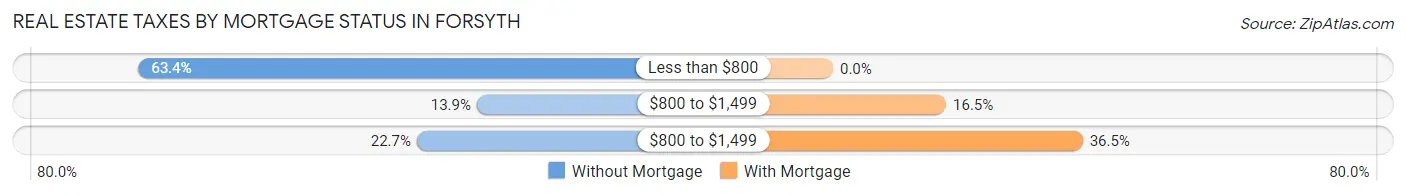
| Property Taxes | Without Mortgage | With Mortgage |
| Less than $800 | 405 (63.4%) | 0 (0.0%) |
| $800 to $1,499 | 89 (13.9%) | 91 (16.5%) |
| $800 to $1,499 | 145 (22.7%) | 201 (36.5%) |
| Total | 639 (100.0%) | 551 (100.0%) |
Health & Disability in Forsyth
Health Insurance Coverage by Age in Forsyth
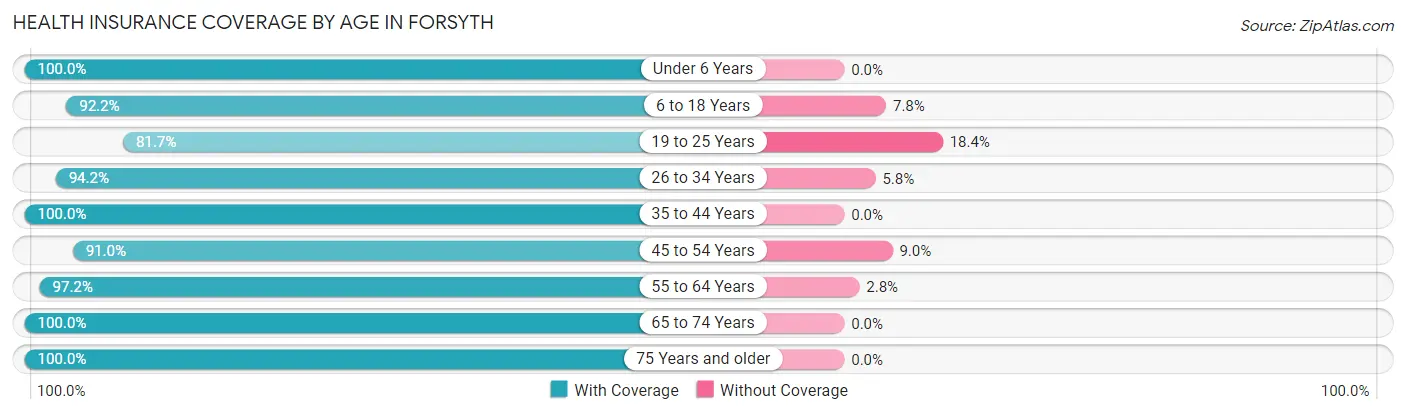
| Age Bracket | With Coverage | Without Coverage |
| Under 6 Years | 181 (100.0%) | 0 (0.0%) |
| 6 to 18 Years | 711 (92.2%) | 60 (7.8%) |
| 19 to 25 Years | 258 (81.7%) | 58 (18.3%) |
| 26 to 34 Years | 600 (94.2%) | 37 (5.8%) |
| 35 to 44 Years | 374 (100.0%) | 0 (0.0%) |
| 45 to 54 Years | 517 (91.0%) | 51 (9.0%) |
| 55 to 64 Years | 587 (97.2%) | 17 (2.8%) |
| 65 to 74 Years | 298 (100.0%) | 0 (0.0%) |
| 75 Years and older | 644 (100.0%) | 0 (0.0%) |
| Total | 4,170 (94.9%) | 223 (5.1%) |
Health Insurance Coverage by Citizenship Status in Forsyth
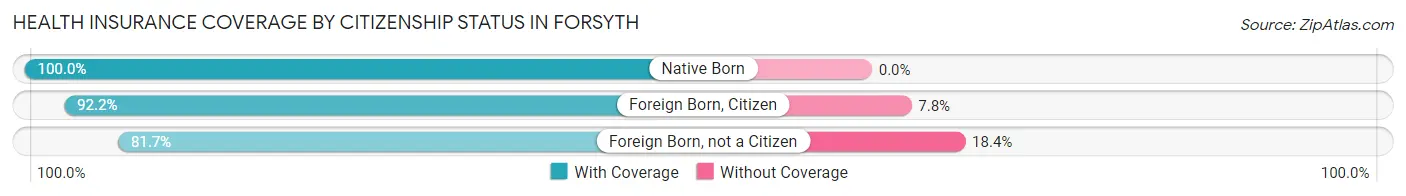
| Citizenship Status | With Coverage | Without Coverage |
| Native Born | 181 (100.0%) | 0 (0.0%) |
| Foreign Born, Citizen | 711 (92.2%) | 60 (7.8%) |
| Foreign Born, not a Citizen | 258 (81.7%) | 58 (18.3%) |
Health Insurance Coverage by Household Income in Forsyth
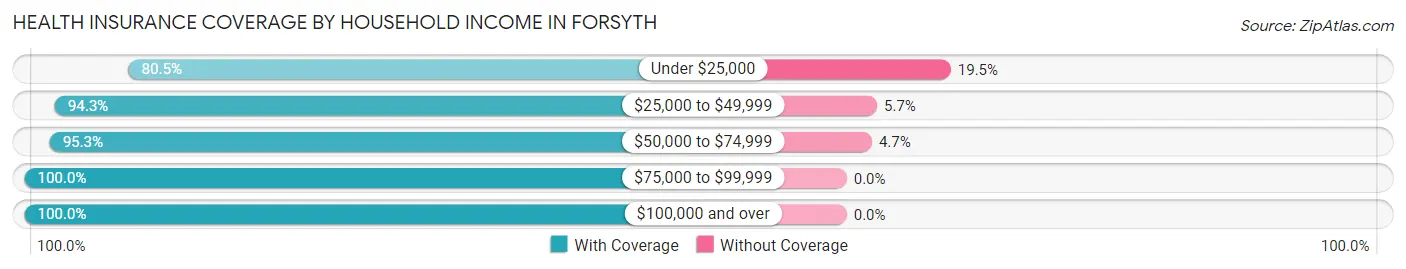
| Household Income | With Coverage | Without Coverage |
| Under $25,000 | 545 (80.5%) | 132 (19.5%) |
| $25,000 to $49,999 | 714 (94.3%) | 43 (5.7%) |
| $50,000 to $74,999 | 968 (95.3%) | 48 (4.7%) |
| $75,000 to $99,999 | 694 (100.0%) | 0 (0.0%) |
| $100,000 and over | 1,249 (100.0%) | 0 (0.0%) |
Public vs Private Health Insurance Coverage by Age in Forsyth
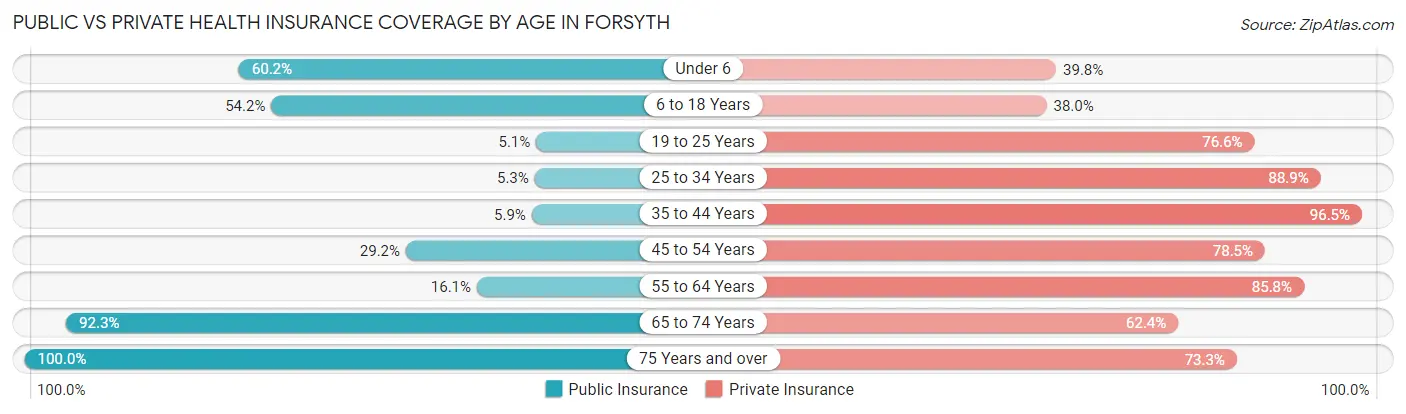
| Age Bracket | Public Insurance | Private Insurance |
| Under 6 | 109 (60.2%) | 72 (39.8%) |
| 6 to 18 Years | 418 (54.2%) | 293 (38.0%) |
| 19 to 25 Years | 16 (5.1%) | 242 (76.6%) |
| 25 to 34 Years | 34 (5.3%) | 566 (88.8%) |
| 35 to 44 Years | 22 (5.9%) | 361 (96.5%) |
| 45 to 54 Years | 166 (29.2%) | 446 (78.5%) |
| 55 to 64 Years | 97 (16.1%) | 518 (85.8%) |
| 65 to 74 Years | 275 (92.3%) | 186 (62.4%) |
| 75 Years and over | 644 (100.0%) | 472 (73.3%) |
| Total | 1,781 (40.5%) | 3,156 (71.8%) |
Disability Status by Sex by Age in Forsyth
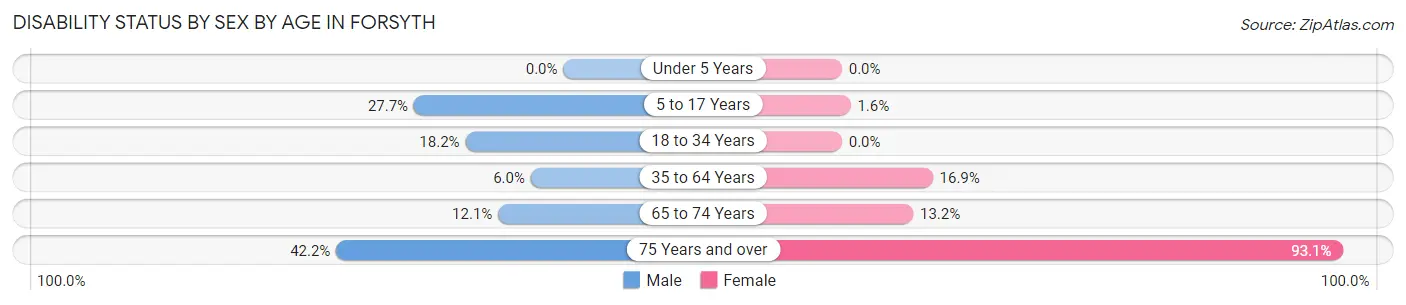
| Age Bracket | Male | Female |
| Under 5 Years | 0 (0.0%) | 0 (0.0%) |
| 5 to 17 Years | 99 (27.7%) | 7 (1.6%) |
| 18 to 34 Years | 90 (18.2%) | 0 (0.0%) |
| 35 to 64 Years | 35 (6.0%) | 163 (16.9%) |
| 65 to 74 Years | 15 (12.1%) | 23 (13.2%) |
| 75 Years and over | 113 (42.2%) | 350 (93.1%) |
Disability Class by Sex by Age in Forsyth
Disability Class: Hearing Difficulty
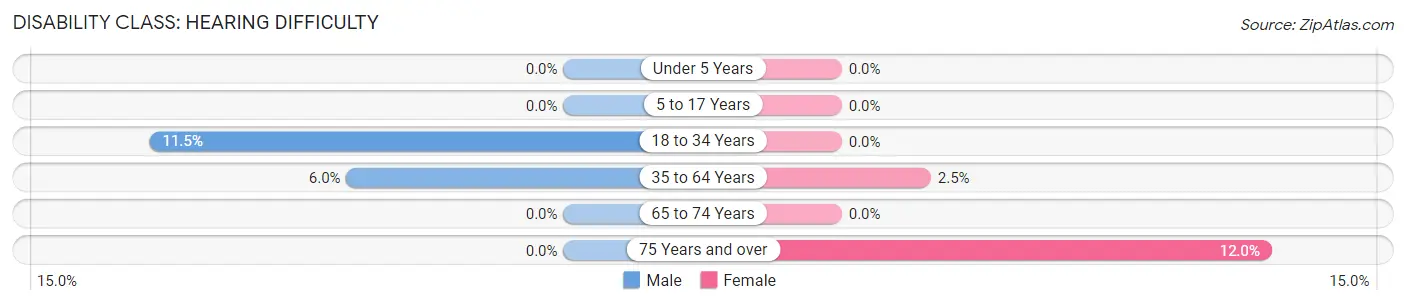
| Age Bracket | Male | Female |
| Under 5 Years | 0 (0.0%) | 0 (0.0%) |
| 5 to 17 Years | 0 (0.0%) | 0 (0.0%) |
| 18 to 34 Years | 57 (11.5%) | 0 (0.0%) |
| 35 to 64 Years | 35 (6.0%) | 24 (2.5%) |
| 65 to 74 Years | 0 (0.0%) | 0 (0.0%) |
| 75 Years and over | 0 (0.0%) | 45 (12.0%) |
Disability Class: Vision Difficulty
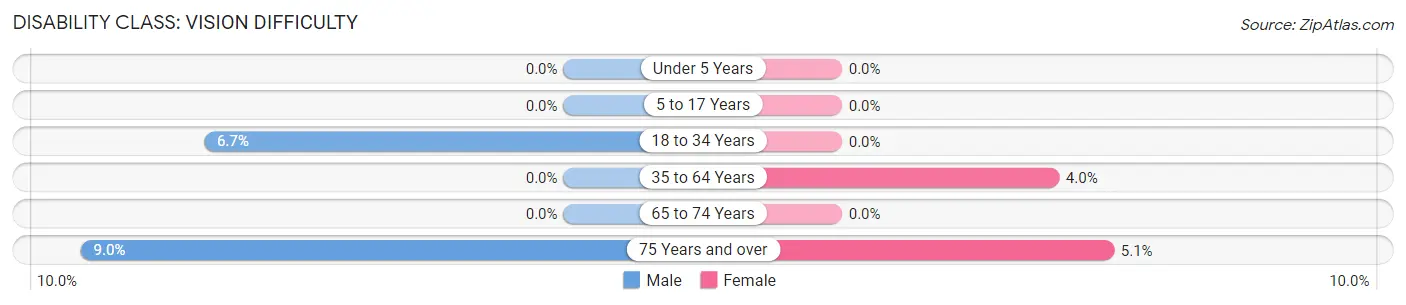
| Age Bracket | Male | Female |
| Under 5 Years | 0 (0.0%) | 0 (0.0%) |
| 5 to 17 Years | 0 (0.0%) | 0 (0.0%) |
| 18 to 34 Years | 33 (6.7%) | 0 (0.0%) |
| 35 to 64 Years | 0 (0.0%) | 39 (4.0%) |
| 65 to 74 Years | 0 (0.0%) | 0 (0.0%) |
| 75 Years and over | 24 (9.0%) | 19 (5.1%) |
Disability Class: Cognitive Difficulty
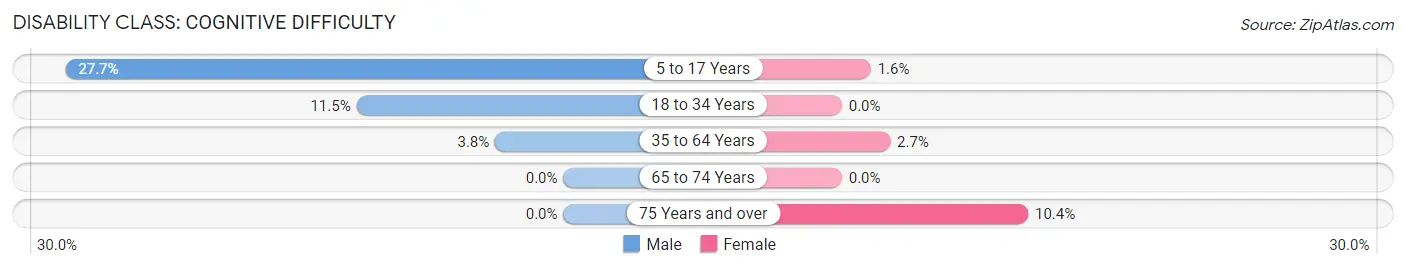
| Age Bracket | Male | Female |
| 5 to 17 Years | 99 (27.7%) | 7 (1.6%) |
| 18 to 34 Years | 57 (11.5%) | 0 (0.0%) |
| 35 to 64 Years | 22 (3.8%) | 26 (2.7%) |
| 65 to 74 Years | 0 (0.0%) | 0 (0.0%) |
| 75 Years and over | 0 (0.0%) | 39 (10.4%) |
Disability Class: Ambulatory Difficulty
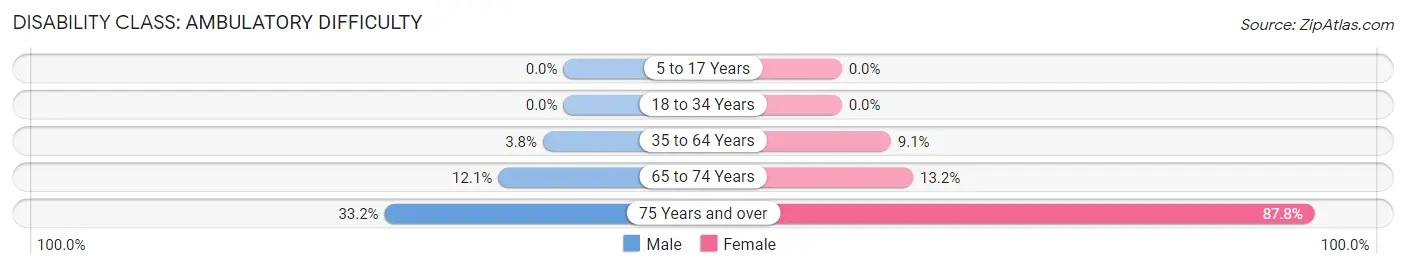
| Age Bracket | Male | Female |
| 5 to 17 Years | 0 (0.0%) | 0 (0.0%) |
| 18 to 34 Years | 0 (0.0%) | 0 (0.0%) |
| 35 to 64 Years | 22 (3.8%) | 88 (9.1%) |
| 65 to 74 Years | 15 (12.1%) | 23 (13.2%) |
| 75 Years and over | 89 (33.2%) | 330 (87.8%) |
Disability Class: Self-Care Difficulty
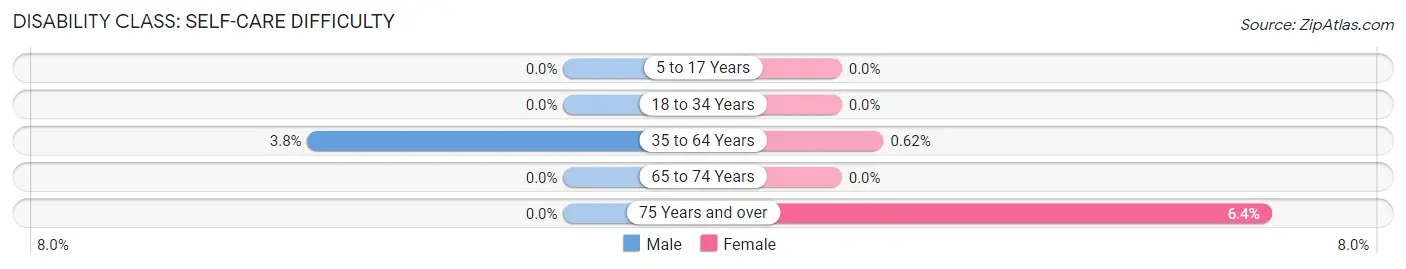
| Age Bracket | Male | Female |
| 5 to 17 Years | 0 (0.0%) | 0 (0.0%) |
| 18 to 34 Years | 0 (0.0%) | 0 (0.0%) |
| 35 to 64 Years | 22 (3.8%) | 6 (0.6%) |
| 65 to 74 Years | 0 (0.0%) | 0 (0.0%) |
| 75 Years and over | 0 (0.0%) | 24 (6.4%) |
Technology Access in Forsyth
Computing Device Access in Forsyth
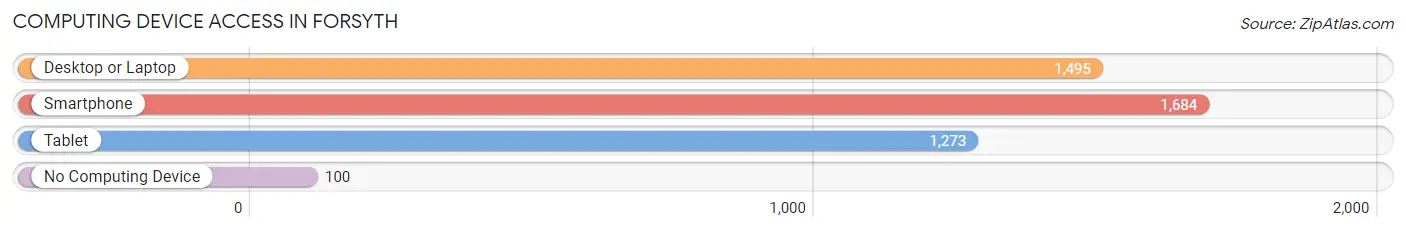
| Device Type | # Households | % Households |
| Desktop or Laptop | 1,495 | 74.1% |
| Smartphone | 1,684 | 83.5% |
| Tablet | 1,273 | 63.1% |
| No Computing Device | 100 | 5.0% |
| Total | 2,018 | 100.0% |
Internet Access in Forsyth
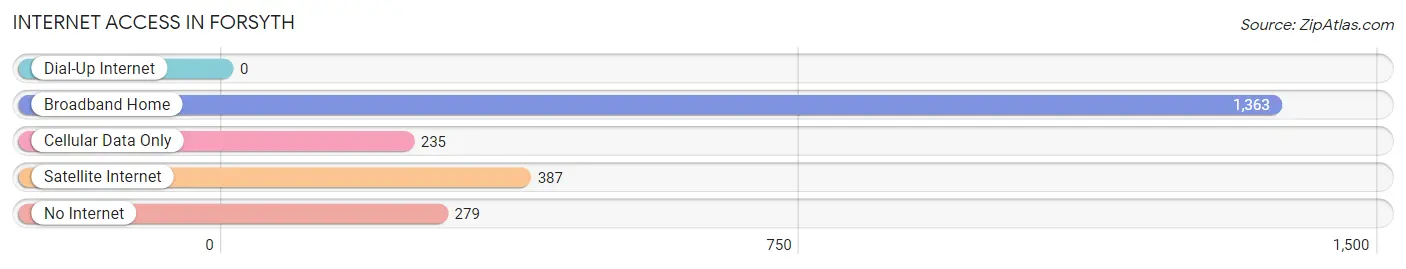
| Internet Type | # Households | % Households |
| Dial-Up Internet | 0 | 0.0% |
| Broadband Home | 1,363 | 67.5% |
| Cellular Data Only | 235 | 11.7% |
| Satellite Internet | 387 | 19.2% |
| No Internet | 279 | 13.8% |
| Total | 2,018 | 100.0% |
Forsyth Summary
Forsyth, Georgia is a small city located in Monroe County, Georgia, United States. It is the county seat of Monroe County and is located about 45 miles south of Atlanta. The city has a population of 3,735 as of the 2010 census.
Forsyth was founded in 1823 and was named after John Forsyth, the Governor of Georgia from 1827 to 1829. The city was originally a trading post and was the site of the first county courthouse in Monroe County. The city was incorporated in 1856 and has since grown to become the county seat of Monroe County.
Geography
Forsyth is located at 33°59'N 83°59'W (33.983, -83.983). The city is situated in the Piedmont region of Georgia and is located in the foothills of the Blue Ridge Mountains. The city is located on the Ocmulgee River and is surrounded by the cities of Macon, Warner Robins, and Milledgeville.
The city has a total area of 4.2 square miles, all of which is land. The city has a humid subtropical climate, with hot, humid summers and mild winters.
Economy
Forsyth has a diverse economy, with a variety of industries and businesses. The city is home to several manufacturing companies, including a paper mill, a furniture factory, and a plastics plant. The city is also home to several retail stores, restaurants, and other businesses.
The city is also home to several educational institutions, including the Monroe County School System, Georgia College and State University, and Middle Georgia State University.
Demographics
As of the 2010 census, Forsyth had a population of 3,735. The racial makeup of the city was 73.3% White, 22.2% African American, 0.3% Native American, 0.7% Asian, 0.1% Pacific Islander, 1.7% from other races, and 1.9% from two or more races. Hispanic or Latino of any race were 3.3% of the population.
The median income for a household in the city was $35,938, and the median income for a family was $45,938. The per capita income for the city was $18,938. About 17.3% of families and 20.3% of the population were below the poverty line, including 28.3% of those under age 18 and 11.3% of those age 65 or over.
Forsyth is a small city with a rich history and a diverse economy. The city is home to several educational institutions and businesses, and is a great place to live and work.
Common Questions
What is the Total Population of Forsyth?
Total Population of Forsyth is 4,549.
What is the Total Male Population of Forsyth?
Total Male Population of Forsyth is 2,008.
What is the Total Female Population of Forsyth?
Total Female Population of Forsyth is 2,541.
What is the Ratio of Males per 100 Females in Forsyth?
There are 79.02 Males per 100 Females in Forsyth.
What is the Ratio of Females per 100 Males in Forsyth?
There are 126.54 Females per 100 Males in Forsyth.
What is the Median Population Age in Forsyth?
Median Population Age in Forsyth is 43.3 Years.
What is the Average Family Size in Forsyth
Average Family Size in Forsyth is 2.8 People.
What is the Average Household Size in Forsyth
Average Household Size in Forsyth is 2.2 People.
What is Per Capita Income in Forsyth?
Per Capita income in Forsyth is $36,159.
What is the Median Family Income in Forsyth?
Median Family Income in Forsyth is $64,285.
What is the Median Household income in Forsyth?
Median Household Income in Forsyth is $63,396.
What is Income or Wage Gap in Forsyth?
Income or Wage Gap in Forsyth is 34.7%.
Women in Forsyth earn 65.3 cents for every dollar earned by a man.
What is Family Income Deficit in Forsyth?
Family Income Deficit in Forsyth is $6,783.
Families that are below poverty line in Forsyth earn $6,783 less on average than the poverty threshold level.
What is Inequality or Gini Index in Forsyth?
Inequality or Gini Index in Forsyth is 0.45.
How Large is the Labor Force in Forsyth?
There are 2,119 People in the Labor Forcein in Forsyth.
What is the Percentage of People in the Labor Force in Forsyth?
56.4% of People are in the Labor Force in Forsyth.
What is the Unemployment Rate in Forsyth?
Unemployment Rate in Forsyth is 6.7%.